Munich Personal RePEc Archive
Methodology for an Early Warning
System: The Signals Approach
Reinhart, Carmen and Goldstein, Morris and Kaminsky,
Graciela
University of Maryland, College Park, Department of Economics
2000
Methodology for an Early Warning System: The Signals Approach
Assessing Financial Vulnerability: An Early Warning System for Emerging MarketsNotes from Chapter 2
Morris Goldstein, Graciela L. Kaminsky, and Carmen M. Reinhart (Washington, DC: Institute for International Economics, 2000)
. In this chapter we provide a brief review of the “signals” approach used in this book to
assess the probability of a currency or a banking crisis. This methodology was first used to
analyze the performance of a variety of macroeconomic and financial indicators around the
“twin crises” in Kaminsky and Reinhart (1996) and is described in greater detail in Kaminsky,
Lizondo, and Reinhart (1998). In the analysis that follows we focus on a sample of 25 countries
over the period 1970 to 1995. The out-of-sample performance of the “signals” approach will be
assessed using data for the January 1996-June 1997 period.
The countries in our list fall into four regional groupings, Africa, Asia, Europe and the
Middle East, and Latin America and are those listed in Table 1.3. The basic premise of the
signals approach is that the economy behaves differently on the eve of financial crises and that
this aberrant behavior has a recurrent systematic pattern. This “anomalous” pattern, in turn, is
manifested in the evolution of a broad array of economic and financial indicators. For instance,
currency crises are often preceded by an “overvaluation” of the currency; banking crises tend to
follow sharp declines in asset prices. The empirical evidence provides ample support for this
premise.1 However, in order to implement the signals approach, we need to clarify a minimum
number of concepts which will be used throughout the analysis.
Defining currency and banking crises
Currency Crises: A currency crisis is defined as a situation in which an attack on the
currency leads to substantial reserve losses and/or to a sharp depreciation of the currency--if the
speculative attack is ultimately successful. This definition of currency crisis has the advantage
that it is comprehensive enough to capture not only speculative attacks on fixed exchange rates,
such as that of Thailand prior to July 2, 1997, but also attacks that force a large devaluation
beyond the established rules of a crawling-peg regime or an exchange rate band, such as
Indonesia’s prior to its floatation of the rupiah on August 14, 1997. Since reserve losses also
count, the index also captures unsuccessful speculative attacks, such as Argentina in the wake of
the Mexican 1994 peso crisis.
For each country, balance of payments crises are identified by the behavior of an index of
“exchange market pressure.” This index is a weighted average of monthly percentage changes in
the exchange rate and monthly percentage changes in gross international reserves in U.S. dollars
(the latter with a negative weight).2 Periods in which the index is above its mean by more than
three standard deviations are defined as crises. As noted in earlier papers which use this
approach, the dates of the crises map well onto the dates obtained if one were to exclusively rely
on events, such the closing of the exchange markets or a change in the exchange rate regime.
Banking crises: The dating of banking crises stresses events.3 Specifically, the
beginning of a banking crisis is marked by either: (1) bank runs that lead to the closure, merging,
or takeover by the public sector of one or more financial institutions or, (2) if there are no runs,
the merging, closure, or large-scale government intervention or assistance of an important
institution or group of institutions.
The Indicators
Theory provides ample guidance on the choice of potential indicators. In addition to the
15 indicators originally considered in Kaminsky and Reinhart (1996), we evaluate the ability of
nine additional indicators that figure prominently in both the theoretical literature on banking and
currency crises and in the popular discussion of these events.4 Four of these indicators are
expressed as a share of GDP, these are: current account balance, short-term capital inflows,
foreign direct investment, and the overall budget deficit. In addition, we look at the growth rates
in general government consumption/GDP, central bank credit to the public sector/GDP, net
credit to the public sector/GDP, and the current account balance as a share of investment. The
3 Their paper discusses the relative merits of this definition.
4 The indicators in that study were: (1) international reserves (in U.S. dollars); (2) imports (in U.S. dollars); (3) exports (in U.S. dollars); (4) the terms of trade (defined as the unit value of exports over the unit value of imports); (5) deviations of the real exchange rate from trend (in percentage terms); (6) the differential between foreign (U.S. or German) and domestic real interest rates on deposits (monthly rates, deflated using consumer prices and measured in
latter measure of the current account was motivated by the often-voiced view, particularly in the
wake of the 1994-1995 Mexican peso crisis, that large current account deficits are more of a
concern it they stem from low saving as opposed to high levels of investment. Recent events in
Asia--a region noted for its exceptionally high levels of domestic saving and its even higher
levels of investment--have lead to a reassessment of that view. As most of these indicators are
not available at monthly or quarterly frequencies, annual data was used. In Chapter 4, we also
examine the track record of sovereign credit ratings when it comes to “predicting” financial
crises. Specifically, we examine the performance of the Institutional Investor and Moody’s
ratings.
For the monthly variables (with the exception of the deviation of the real exchange rate
from trend, the “excess” of real M1 balances, and the three variables based on interest rates), the
indicator on a given month was defined as the percentage change in the level of the variable with
respect to its level a year earlier.5 This filter has several attractive features: It reduces the
noisiness of working with monthly data; it facilitates cross-country comparisons; and it ensures
the variables are stationary with well-defined moments.
For the rating agencies, Institutional Investors constructs an index that is increasing in
creditworthiness and ranges from zero to one hundred; this index is published twice a year and is
released in March and September. Hence, we work with the 6-month percent change in this
rating index. For Moody’s, monthly changes are used; a downgrade takes on the value of minus
one, no change in the rating takes on a value of zero, and an upgrade takes on the value of one.6
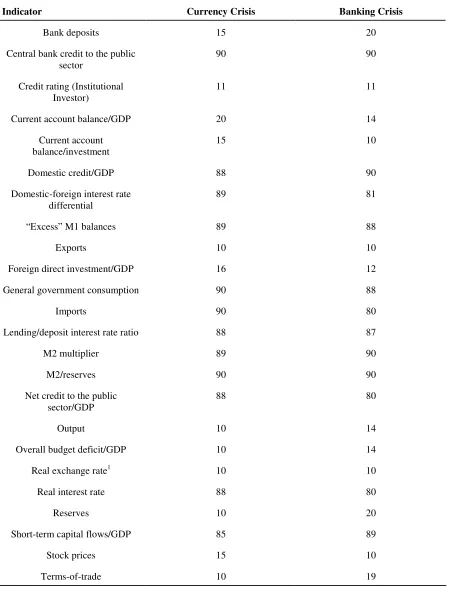
Table 2.1 The Optimal Thresholds (in percent)
Indicator Currency Crisis Banking Crisis
Bank deposits 15 20
Central bank credit to the public sector
90 90
Credit rating (Institutional Investor)
11 11
Current account balance/GDP 20 14
Current account balance/investment
15 10
Domestic credit/GDP 88 90
Domestic-foreign interest rate differential
89 81
“Excess” M1 balances 89 88
Exports 10 10
Foreign direct investment/GDP 16 12
General government consumption 90 88
Imports 90 80
Lending/deposit interest rate ratio 88 87
M2 multiplier 89 90
M2/reserves 90 90
Net credit to the public sector/GDP
88 80
Output 10 14
Overall budget deficit/GDP 10 14
Real exchange rate1 10 10
Real interest rate 88 80
Reserves 10 20
Short-term capital flows/GDP 85 89
Stock prices 15 10
1
An increase in the index denotes a real depreciation.
The Signaling window
Let us call a signal (yet to be precisely defined) a departure from “normal” behavior in an
indicator. For instance, an unusually large decline in exports or output may signal a future
currency or banking crisis. Thus, if an indicator sends a signal that is followed by a crisis within
a plausible time frame--this is labeled a good signal. If the signal is not followed by a crisis
within that interval of time it is called a false signal, or noise. As in the earlier studies that have
employed this approach the signaling window is set a priori at 24 months preceding the currency
crisis. Hence, if that unusually large decline in exports alluded to earlier were to occur 28
months prior to the crisis, the signal would fall outside the signaling window and would be
labeled a false alarm.
Hence, we have the following two by two matrix,
Crisis occurs in the following 24 months
No crisis occurs in the following 24 months
Signal A B
No signal C D
A perfect indicator would only have entries in cells A and D. For banking crises we
employ a different signaling window. Namely, any signal given in the 12 months preceding the
beginning of the crisis or the 12 months following the beginning of the crisis is labeled a good
signal. As discussed in Kaminsky and Reinhart (1996), the more protracted nature of the
banking crises and the high incidence of denial that there are problems at the early stages of the
The threshold
Suppose we wish to test the null or maintained hypothesis that the economy is in a “state
of tranquility” versus the alternative hypothesis that a crisis will occur sometime in the next 24
months. Furthermore, suppose we wish to test this hypothesis on an indicator-by-indicator basis.
As in any hypothesis test, this calls for selecting a threshold or critical value that divides the
probability distribution of that indicator into a region that is considered normal or probable under
the null hypothesis and a region that is considered aberrant or unlikely under the null
hypothesis--the rejection region. Hence, if the observed outcome for a particular variable falls into the
rejection region, that variable is said to be sending a signal.
Table 2.1 lists the thresholds for all the indicators for both currency and banking crises.
For instance, the threshold for short-term capital flows as a percent of GDP listed in Table 2.1 is
85 percent. This conveys two bits of information. First, it indicates that 15 percent of all the
observations in our sample (for this variable) are considered signals. Second, it highlights that
the rejection region is located at the upper tail of the frequency distribution, meaning that a high
ratio of short-term capital inflows to GDP will lead to a rejection of the null hypothesis of
tranquility in favor of the alternative hypothesis that a crisis is brewing.
However, while the threshold or percentile that defines the size of the rejection region is
uniform across countries for each indicator, the corresponding country-specific values are
allowed to differ. Consider the following illustration. There are two countries, one which has
received little or no short term capital inflows (as a percent of GDP) during the entire sample,
percentile of the frequency distribution for the low capital importer may be as small as ½ percent
of GDP and any increase beyond that would be considered a signal. Meanwhile, the country
where the norm was a higher volume of capital inflows is likely to have a higher critical value,
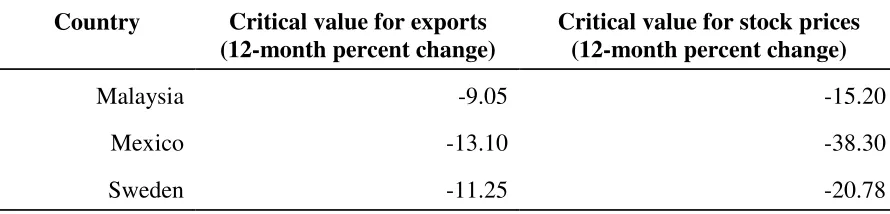
hence, only values above, say, 3 percent of GDP would be considered signals. Table 2.2
illustrates this point by showing the country-specific critical values for export growth and annual
stock returns for Malaysia, Mexico, and Sweden. A twenty five percent decline in stock prices
would be considered a signal of a future currency crisis in Malaysia and Sweden but not in
Mexico, with its far greater historical volatility. Indeed, as shown in Kaminsky and Reinhart
(1998a), the volatility pattern for these three countries is representative of the broader historical
regional pattern. Yet, the wild gyrations in financial markets in Asia in 1997-98 may be
[image:10.612.73.518.434.541.2]unraveling those historic patterns.
Table 2.2 Illustrative examples of country-specific thresholds: Currency crises
Country Critical value for exports (12-month percent change)
Critical value for stock prices (12-month percent change)
Malaysia -9.05 -15.20
Mexico -13.10 -38.30
Figure 2.1 provides an illustration over the emtire sample for our measure of the extent
of overvaluation in the real exchange rate for Mexico. The horizontal line is the country-specific
threshold and a reading below this line (recall a decline represents an appreciation), represents a
signal. The shaded areas are the twenty four months prior to the crises, or the signaling
window. Around 1982 the shaded area is wider due to the fact that there was a “double dip,” as
two crises were registered in 1982.
To select the optimal threshold for each indicator, we allowed the size of the rejection
region to oscillate between 10 percent and 20 percent, for each choice the noise-to-signal ratio
was tabulated and the “optimal” set of thresholds was defined as the one that minimized the
noise-to-signal ratio; i.e., the ratio of false signals to good signals.7
In the next chapter, we describe the empirical results of applying the signals approach to
the data.
REFERENCES
Agenor, Pierre-Richard, Jagdeep S. Bhandari, and Robert P. Flood. 1992. “Speculative Attacks and Models of Balance of Payments Crises.” IMF Staff Papers 39 (June), 357–94.
Bank of International Settlements. 1998. The Maturity, Sectoral, and Nationality Distribution of International Bank Lending. Basle: Bank for International Settlements.
Berg, Andrew, and Catherine Patillo. 1999. “Are Currency Crises Predictable? A Test.” forthcoming in Journal of International Money ad Finance, (August).
Blanco, Herminio, and Peter M. Garber. 1986. “Recurrent Devaluation and Speculative Attacks on the Mexican Peso.” Journal of Political Economy, 94 (February ), 148–66.
Borensztein, Eduardo, and José de Gregorio. 1998. “Devaluations and Inflation After Currency Crises.” Unpublished paper.
Calomiris, Charles, 1997. The Post Modern Bank Safety Net: Lessons from Developed and Developing Countries. Washington, DC: American Enterprise Institute.
Calvo, Guillermo A. 1998. “Varieties of Capital-Market Crises.” In Guillermo A. Calvo and M. King The Debt Burden and Its Consequences for Monetary Policy. New York:
MacMillan Press.
Calvo, Guillermo A., Morris Goldstein. 1996. “What Role for the Official Sector? “In
Guillermo A. Calvo, Morris Goldstein, and Eduard Hochreiter Private Capital Flows to Emerging Markets After the Mexican Crisis, Washington: Institute for International Economics, 233-82.
Calvo, Guillermo A., and Enrique Mendoza. 1996. “Mexico's Balance-of-Payments Crisis: A Chronicle of A Death Foretold,” Journal of International Economics 41, No. 3/4, (November), 235-264.
Calvo, Sara, and Carmen M. Reinhart. 1996. “Capital Flows to Latin America: Is There
Evidence of Contagion Effects?.” In Guillermo A. Calvo, Morris Goldstein, and Eduard Hochreiter Private Capital Flows to Emerging Markets After the Mexican Crisis, Washington: Institute for International Economics, 151–71.
Ratings,” Federal Reserve Bank of New York Economic Policy Review, (October), 1-15.
Cantor, Richard, and Frank Packer. 1996b. “Sovereign Risk Assessment and Agency Credit Ratings,” European Financial Management, Vol. 2, 247-56.
Caprio, Gerald, Jr. and, Klingebiel, Daniela. 1996a. “Bank Insolvency: Bad Luck, Bad Policy, or Bad Banking?” in Annual World Bank Conference on Development Economics. Washington, DC: The World Bank, 79-104.
.Caprio, Gerald, Jr. and, Klingebiel, Daniela. 1996b. “Bank Insolvency: Cross-country Experiences.” Unpublished paper.
Claessens, Stijn, and Thomas Glaessner. 1997. “Are Financial Sector Weaknesses Undermining the Asian Miracle? Unpublished paper.
Cooper, Richard. 1971. “Currency Devaluation in Developing Countries.” In G. Ranis,
Government and Economic Development, New Haven: Yale University Press.
Corsetti, Giancarlo, Paolo Pesenti, and Nouriel Poubini. 1997. "What Caused the Asian Currency and Financial Crisis?". Unpublished paper.
Cumby, Robert, and Sweder van Wijnbergen. 1989. “Financial Policy and Speculative Runs with a Crawling Peg: Argentina 1979–81,” Journal of International Economics 17 (August), 111–27.
Demirguç-Kunt, Asli, and Enrica Detragiache. 1998. “Banking Crises Around the World: Are There Any Common Threads.” IMF Staff Papers, (March).
Diamond, Douglas, and Phillip Dybvig. 1983. “Bank Runs, Liquidity, and Deposit Insurance.”
Journal of Political Economy 91 (June), 401-19.
Diebold, Francis and Glen Rudebusch. 1989. “Scoring the Leading Indicators.” Journal of Business 62, No. 3 (July), 369-91.
Dooley, Michael P. 1997. “A Model of Crises in Emerging Markets.” National Bureau of Economic Research Working Paper No. 6300. Cambridge: National Bureau of Economic Research
Collapses,” Brookings Papers on Economic Activity, No. 2, 219–95.
Doukas, John. 1989. “Contagion Effect on Sovereign Interest Rate Spreads.” Economic Letters 29, 237-41.
Edwards, Sebastian. 1986. “Are Devaluations Contractionary?” Review of Economics and Statistics 68, 501-08.
Edwards, Sebastian. 1989. Real Exchange Rates, Devaluation, and Adjustment: Exchange Rate Policy in Developing Countries. Cambridge, Massachusetts: MIT Press.
Eichengreen, Barry, Andrew Rose, and Charles Wyplosz. 1995. “Exchange Market Mayhem: The Antecedents and Aftermath of Speculative Attacks.” Economic Policy 21 (October), 249–312.
Eichengreen, Barry, Andrew Rose, and Charles Wyplosz. 1996. “Contagious Currency Crises,” National Bureau of Economic Research Working Paper 5681, (July).
Eichengreen, Barry, Andrew Rose. 1997. “Staying Afloat When the Wind Shifts: External Factors and Emerging-Market Banking Crises.” Unpublished paper.
Eschweiler. 1997. Did the Market See the Asian Crisis Coming? Unpublished paper.
Fischer, Stanley. 1993. “The Role of Macroeconomic Factors on Growth,” Journal of Monetary Economics 32 (3), 395-415.
Frankel, Jeffrey A., and Andrew K. Rose. 1996. “Exchange Rate Crises in Emerging Markets.”
Journal of International Economics 41, No. 3/4 (November), 351-68.Frankel, Jeffrey A., and Sergio L Schmukler 1996. “Crisis, Contagion, and Country Funds: Effects on East Asia and Latin America.” In Reuven Glick Managing Capital Flows and Exchange Rates: Perspectives from the Pacific Basin. Cambridge: Cambridge University Press. 232-266.
Furman, Jason, and Joseph E. Stiglitz. 1998. “Economic Crises: Evidence and Insights from East Asia.” Forthcoming in Brookings Papers on Economic Activity 2, (June).
Gavin, Michael, and Ricardo Hausman. 1996. “The Roots of Banking Crises: The
Macroeconomic Context.” In Banking Crises in Latin America. Washington, DC: Inter-American Development Bank, 27-63.
Gerlach, Stefan, and Frank Smets. 1994. “Contagious Speculative Attacks.” CEPR Discussion Paper No. 1055, (November), London: Center for Economic Policy Research.
Goldstein, Morris. 1996. “Presumptive Indicators/Early Warning Signals of Vulnerability to Financial Crises in Emerging Market Economies.” Unpublished paper.
Goldstein, Morris. 1997. “The Case for an International Banking Standard.” Policy Analyses in International Economics 47, (April), Washington, DC: Institute for International
Economics.
Goldstein, Morris. 1998a. “Early Warning Indicators and The Asian Financial Crisis” Unpublished paper.
Goldstein, Morris, 1998b. The Asian Financial Crisis: Causes, Cures, and Systemic
Implications.”Policy Analyses in International Economics 55, (June), Washington, DC: Institute for International Economics.
Goldstein, Morris. 1998. “Commentary: The Causes and Propagation of Financial Stability: Lessons for Policy makers. In Federal reserve Bank of Kansas City Maintaining
Financial Stability in a Global Economy. Kansas City: Federal Reserve Bank of Kansas City.
Goldstein, Morris. 1998. “Banking Crises: International Experience. In Gerard Caprio, George Kaufman, and Danny Leipziger Preventing Banking Crises. Chicago: Federal Reserve Bank of Chicago; Washington, DC: The World Bank. Forthcoming.
Goldstein, Morris, and Philip Turner. 1996. “Banking Crises in Emerging Economies: Origins and Policy Options.” Bank for International Settlements Economic Paper No. 46, (October). Basle: Bank for International Settlements.
Goldfajn, Ilan, and Rodrigo O.Valdés. 1998. “Are Currency Crises Predictable?,” European Economic Review, forthcoming.
Honohan, Patrick. 1997. “Banking System Failures in Developing and Transition Countries: Diagnosis and Prediction.” Bank for International Settlements Working Paper No. 39, (January).
International Monetary Fund. 1997a. International Capital Markets, (September). Washington: International Monetary Fund.
International Monetary Fund. 1998a. World Economic Outlook, (May). Washington: International Monetary Fund.
International Monetary Fund. 1998b. International Capital Markets, (September). Washington: International Monetary Fund.
International Monetary Fund. 1998c. World Economic Outlook, (October). Washington: International Monetary Fund.
Kamin, Steven B.. 1988. “Devaluation, External Balance, and Macroeconomic Performance: A Look at the Numbers,” Studies in International Finance, No. 62, (August). Princeton: Princeton University, Department of Economics, International Finance Section.
Kamin, Steven B., and John H. Rogers. 1997. “Output and the Real Exchange Rate in Developing Countries: An Application to Mexico,” Unpublished paper.
Kaminsky, Graciela L. 1998. “Currency and Banking Crises: A Composite Leading Indicator.” International Finance Discussion Paper Series No. 629 (December). Washington: Board of Governors of the Federal Reserve.
Kaminsky, Graciela L., and Carmen M. Reinhart. 1996. “The Twin Crises: The Causes of Banking and Balance-of-Payments Problems,” International Finance Discussion Paper No. 544, (March). Washington: Board of Governors of the Federal Reserve.
Kaminsky, Graciela, and Carmen M. Reinhart. 1998a. “Financial Crises in Asia and Latin America: Then and Now.” American Economic Review 88, No.2 ( May). 444-48.
Kaminsky, Graciela, and Carmen M. Reinhart. 1998b. “On Crises, Contagion, and Confusion.” Unpublished paper.
Kiguel, Miguel A., and Nita Ghei. 1992. “Devaluation in Low-Inflation Economies,” Policy Research Working Paper 1224. Washington: The World Bank.
Krueger, Anne O. 1978. Liberalization Attempts and Consequences, Cambridge, MA: Ballinger.
Krugman, Paul. 1979. “A Model of Balance of Payments Crises.” Journal of Money, Credit, and Banking 11 (August), 311–25.
Krugman, Paul. 1998. “What Happened to Asia?.” Unpublished paper.
Larraín, Guillermo, Helmut Reisen, and Julia von Maltzan. 1997. “Emerging Market Risk and Sovereign Credit Ratings,” OECD Development Centre Technical Papers No. 124, (April). Paris: The Organisation for Economic Co-operation and Development.
Lee, Suk Hun. 1993. “Are the Credit Ratings Assigned by Bankers Based on the Willingness of Borrowers to Repay?,” Journal of Development Economics 40, (April), 349-59.
Leiderman, Leonardo, and Alfredo Thorne. 1996. In Private Capital Flows to Emerging Markets After the Mexican Crisis, ed. by Guillermo A. Calvo, Morris Goldstein, and Eduard Hochreiter Washington, DC: Institute for International Economics, 1–43.
Lindgren, Carl-Johan, Gillian Garcia, and Matthew Saal. 1996. Bank Soundness and Macroeconomic Policy. Washington, DC: International Monetary Fund.
Lizondo, Saul, and Peter J. Montiel. 1989. “Contractionary Devaluation in Developing Countries: An Analytical Overview.” IMF Staff Papers 36 (March), 182-227.
Seventies: Do They Fit Out of Sample?” Journal of International Economics 14 (February), 3-24.
Mishkin, Frederic S. 1996. “Understanding Financial Crises: A Developing Country Perspective,” in Annual World Bank Conference on Development Economics, Washington, DC: World Bank, 29-62.
Moore, Geoffrey H. 1959. “The 1957-58 Business Contractions: New Model or Old? American Economic Review 49 (May), 292-308.
Morley, Samuel A.1992. “On the Effect of Devaluation During Stabilization Programs in LDCs,” Review of Economics and Statistics 74 No.1 (February), 21-7.
Obstfeld, Maurice, and Kenneth Rogoff. 1995. “The Mirage of Fixed Exchange Rates,” Journal of Economic Perspectives 9, (Fall), 73-96.
Radelet, Steven, and Jeffrey Sachs. 1998. “The East Asian Financial Crisis: Diagnosis, Remedies, Prospects,”Brookings Papers on Economic Activity, 1.
Rojas-Suarez, Liliana. 1998. “Early Warning Indicators of Banking Crises: What Works for Emerging Markets? With Applications to Latin America,” Unpublished paper.
Rojas-Suarez, Liliana, and Steven R. Weisbrod. 1995. Financial Fragilities in Latin America: The 1980s and 1990s. International Monetary Fund Occasional Paper 132, (October). Washington,DC: International Monetary Fund.
Rose, Andrew K., and Lars E.O. Svensson. 1994. “European Exchange Rate Credibility Before the Fall.” European Economic Review 38 (May), 1185-1216.
Sachs, Jeffrey, Aaron Tornell and Andres Velasco. 1996. “Financial Crises in Emerging Markets: The Lessons From 1995.” Brookings Papers on Economic Activity, No. 1, 147–215.
Sundararajan, V. and Baliño, Tomas. 1991. Banking Crises: Cases and Issues. Washington, DC: International Monetary Fund.
Valdés, Rodrigo O. 1997. “Emerging Markets Contagion: Evidence and Theory.” Unpublished paper.
Velasco, Andres. 1987. “Financial and Balance of Payments Crises: A Simple Model of the Southern Cone Experience.” Journal of Development Economics 27 (October ), 263–83.
Wolf, Holger C. 1997. “Regional Contagion Effects in Emerging Markets.” Princeton University Working Papers in International Finance, G-97-03, (October).
APPENDIX A: DATA AND DEFINITIONS
Crisis index: The index is a weighted average of exchange rate and reserve changes, with
weights such that the two components of the index have equal conditional volatilities. Since
changes in the exchange rate enter with a positive weight and changes in reserves have a
negative weight attached, readings of this index that were three standard deviations or more
above the mean were cataloged as crises. For countries in the sample that had hyperinflation,
the construction of the index was modified. While a 100 percent devaluation may be traumatic
for a country with low-to-moderate inflation, a devaluation of that magnitude is commonplace
during hyperinflations. A single index for the countries that had hyperinflation episodes would
miss sizable devaluations and reserve losses in the moderate inflation periods, since the historic
mean is distorted by the high-inflation episode. To avoid this, we divided the sample according
to whether inflation in the previous six months was higher than 150 percent and then
constructed an index for each subsample. Our cataloging of crises for these countries coincides
fairly tightly with our chronology of currency market disruptions. Eichengreen, Rose, and
Wyplosz (1995) also include interest rates in this index, however, our data on
market-determined interest rates for developing countries does not span the entire sample.
The indicators:
Sources: International Financial Statistics (IFS), International Monetary Fund; Emerging
Market Indicators, International Finance Corporation (IFC); World Development Indicators, the
World Bank, when data was missing from these sources, central bank bulletins and other
country-specific sources were used as supplements. Unless otherwise noted, we used 12-month
percent changes.
2. Domestic credit/nominal GDP: IFS line 52 divided by IFS line 99b (interpolated). Monthly
nominal GDP was interpolated from annual or quarterly data.
3. Real interest rates on deposits: IFS line 60l, monthly rates, deflated using consumer prices
(IFS line 64) expressed in percentage points.
4. The ratio of lending rates to deposit rates: IFS line 60p divided by IFS line60l; was used in
lieu of differentials to ameliorate the distortions caused by the large percentage point spreads
observed during high inflation. In levels.
5. “Excess” real balances: M1 (IFS line34) deflated by consumer prices (IFS line 64) less an
estimated demand for money. The demand for real balances is determined by real GDP
(interpolated IFS line99b), domestic consumer price inflation, and a time trend. Domestic
inflation was used in lieu of nominal interest rates, as market-determined interest rates were not
available during the entire sample for a number of countries; the time trend (which can enter
log-linearly, linearly, or exponentially) is motivated by its role as a proxy for financial
innovation and/or currency substitution. Excess money supply (demand) during pre-crisis
periods (mc) is reported as a percent relative to excess supply (demand) during tranquil times
(mt)--that is, 100 x (mc-mt)/mt.
6. M2 (in US dollars)/reserves (in US dollars): IFS lines 34 plus 35 converted into dollars
(using IFS line ae) divided by IFS line 1L.d.
7. Bank deposits: IFS line 24 plus 25.
8. Exports (in US dollars): IFS line 70.
9. Imports (in US dollars): IFS line 71.
(IFS line 75). For those developing countries where import unit values (or import price indices)
were not available, an index of prices of manufactured exports from industrial countries to
developing countries was used.
11. The real exchange rate: This measure used is based on consumer price indexes (IFS lines
64) and is defined as the relative price of foreign goods (in domestic currency) to the price of
domestic goods. If the central bank of the home country pegs the currency to the dollar
(Deutsche mark), the relevant foreign price index is that of the United States (Germany). Hence,
for all the European countries the foreign price index is that of Germany while for all the other
countries, consumer prices in the United States were used. The trend was specified as,
alternatively, log-linear, linear, and exponential; the best fit among these was selected on a
country-by-country basis. Deviations from trend during crisis periods (dc) were compared to
the deviations during tranquil times (dt) and are shown in Figures 2 and 3 as a percent of the
deviations in tranquil times (i.e.,100 x (dc-dt)/dt).
12. Reserves: IFS line 1L.d.
13. Domestic-foreign interest rate differential on deposits: Monthly rates in percentage
points. IFS lines 60l. Interest rates in the home country are compared with interest rates in the
United States (Germany) if the domestic central bank pegs the currency to the dollar (Deutsche
14. Output: For most countries, the measure of output used is industrial production (IFS
line 66). However, for some countries (the commodity exporters) an index of output of
primary commodities is used (IFS lines 66aa).
15: Stock returns (in dollars): IFC global indices are used for all emerging markets; for
industrial countries the quotes from the main bourses are used.