O C T O B E R 1 9 9 5
WRL
Research Report 95/6
The Predictability of
Branches in Libraries
The Western Research Laboratory (WRL) is a computer systems research group that was founded by Digital Equipment Corporation in 1982. Our focus is computer science research relevant to the design and application of high performance scientific computers. We test our ideas by designing, building, and using real systems. The systems we build are research prototypes; they are not intended to become products.
There are two other research laboratories located in Palo Alto, the Network Systems Lab (NSL) and the Systems Research Center (SRC). Another Digital research group is located in Cambridge, Massachusetts (CRL).
Our research is directed towards mainstream high-performance computer systems. Our prototypes are intended to foreshadow the future computing environments used by many Digital customers. The long-term goal of WRL is to aid and accelerate the development of high-performance uni- and multi-processors. The research projects within WRL will address various aspects of high-performance computing.
We believe that significant advances in computer systems do not come from any single technological advance. Technologies, both hardware and software, do not all advance at the same pace. System design is the art of composing systems which use each level of technology in an appropriate balance. A major advance in overall system performance will require reexamination of all aspects of the system.
We do work in the design, fabrication and packaging of hardware; language processing and scaling issues in system software design; and the exploration of new applications areas that are opening up with the advent of higher performance systems. Researchers at WRL cooperate closely and move freely among the various levels of system design. This allows us to explore a wide range of tradeoffs to meet system goals.
We publish the results of our work in a variety of journals, conferences, research reports, and technical notes. This document is a research report. Research reports are normally accounts of completed research and may include material from earlier technical notes. We use technical notes for rapid distribution of technical material; usually this represents research in progress.
Research reports and technical notes may be ordered from us. You may mail your order to:
Technical Report Distribution
DEC Western Research Laboratory, WRL-2 250 University Avenue
Palo Alto, California 94301 USA
Reports and technical notes may also be ordered by electronic mail. Use one of the fol-lowing addresses:
Digital E-net: JOVE::WRL-TECHREPORTS
Internet: [email protected]
UUCP: decpa!wrl-techreports
To obtain more details on ordering by electronic mail, send a message to one of these addresses with the word ‘‘help’’ in the Subject line; you will receive detailed instruc-tions.
Reports and technical notes may also be accessed via the World Wide Web:
The Predictability of
Branches in Libraries
Brad Calder
Dirk Grunwald
Amitabh Srivastava
Abstract
Profile-based optimizations are being used with increasing frequency.
Profile information can be used to improve instruction scheduling, code
layout, and to increase instruction level parallelism. These optimizations
have been shown to be effective when they are applied to the same program
from which the profile was gathered. However, it is an open question how
profile-based optimizations should be applied to library subroutines. If many
programs use libraries in the same way, it may be possible to ‘‘pre-optimize’’
a library, or to use an optimized shared library.
This study examines the use of commonly used libraries among 43 C and
FORTRAN programs to see if the libraries have common behavior across
different programs. We examine the behavior of the most commonly used
Unix libraries on Digital Unix. We found that libraries have very predictable
behavior between applications. This implies that profile-based compiler
op-timizations may be effective for libraries across different applications.
Therefore, one can use profile optimizations on shared and non-shared
libraries before they are shipped, allowing a program using those libraries to
take advantage of profile-based optimizations without having to gather any
profiles. All results in this study are shown using branch misprediction
rates. We feel this metric indicates the likelihood that programs have similar
behavior, and allows comparison to earlier branch prediction studies.
1
Introduction
Profile-guided code optimizations have been shown to be effective by several researchers. Among these
optimizations are basic block and procedure layout optimizations to improve cache and branch behavior [3,
10, 12], register allocation, and trace scheduling [5, 6, 11, 7]. The technique that all these optimizations
have in common is that they use profiles from a previous run of a given program to predict the behavior of
a future run of the same program. However, many researchers believe that collecting profile information
is too costly or time-consuming, and that many programmers may not collect such information. Thus,
there has been considerable interest in heuristic prediction, or predicting the behavior of a program from
the program’s structure [1, 4, 16, 14]. These methods use heuristics or statistical information to predict a
programs behavior. They have reasonable prediction accuracy, predicting the direction of 75% to 80% of
the conditional branches in a given program, and they can be applied at compile time to guide the same
compiler optimizations that are applied with profiles.
There are a number of ramifications if computer architects and system designers increasingly rely on
profile-guided optimizations to achieve higher performance. Software engineering practices promote code
reuse, and programmers typically use an existing library if possible. Many systems use shared libraries to
reduce the space devoted to redundant copies of library routines, and a shared library may be concurrently
used by a large number of applications. If programs tend to use shared libraries in a similar manner,
performing profile-guided optimizations on those libraries may be possible. Furthermore, many computer
users may not gather profile information for further optimization. If existing shared and non-shared libraries
could be pre-optimized, system performance would improve with little cost.
To our knowledge, there is no study that has examined using profiles from one application to predict the
branch activity of another application. This study examines the behavior of some of the most commonly
used Unix libraries: libc, libm, libX11, libXt, libXaw, libUfor, libfor, and libFutil.
There are two desirable outcomes to our study. The most obvious outcome is that we wanted to determine
if programs do or do not use subroutines from libraries in the same fashion. Additionally, we wanted to see
how much time is spent by applications in library routines.
In this paper, we examine the common behavior between different applications by examining the
branch-ing behavior usbranch-ing shared libraries. Our measurements show that programs tend to spend a considerable
amount of time in library code: 59% for X11 programs, 16% for Fortran programs, and 10% for our other
2
Background
Several studies have examined how execution from one run of a program predicts the future behavior of
that program. David Wall provided an early study on predicting the future behavior of a program using
profiles [15]. The results showed that using profiles from a different run of the application achieved results
close to that of a perfect profile from the same run. Fisher and Freudenberger confirmed this observation
applied to static branch prediction [8]. They used traces from one execution of a program to predict the
outcome of conditional branches for the same and different inputs. They defined perfect profile prediction
to be the prediction accuracy achieved when the same input was used to trace the program and then used
to measure the accuracy of static branch prediction. Their C/Integer results show that, on average, 95% of
the perfect profile prediction accuracy is achieved when profiling a program with the best matched previous
trace. Only 75% of the perfect profile prediction accuracy was achieved when taking the worse previous
trace. Both of these studies and others have promoted profile based optimizations as a means to achieve
increased processing performance.
More recently, other studies have been performed using compile time heuristics to estimate profile
information. These studies address a number of issues. First, it may be possible to use simple heuristics to
estimate profiles, implying that profile-based optimizations can be performed using heuristics [9].
Further-more, even though many extant compilers perform some profile-based optimizations, most programmers
do not use such options, either because the profiling method is not standardized across platforms, they are
unaware of the option, they are uncertain of the benefits of profile-based optimization, or they believe that
the process of gathering profiles and recompiling their programs is too expensive and complicated.
Ball and Larus proposed several heuristics for predicting a program’s behavior at compile time [1]. In
a later study [4], we found their heuristics to be reasonably accurate, resulting in a 25% mispredict rate at
compile time without profile information. By comparison, perfect profile prediction had a 8% miss rate for
the same collection of programs. Other studies by Wagner et. al. [14] and Wu and Larus [16] have focused
on using these heuristics and other techniques to fully estimate a programs behavior at compile time.
In a recent study, we examined an alternative technique for predicting program behavior by combining
profile information gathered from a number of applications. We collected a “feature vector” describing
an individual conditional branch, and then used various machine-learning techniques to determine what
combination of features, if any, accurately predicted the branches. We have considered two techniques; the
first, described in [4], uses a “neural network” to combine the information from the feature vectors, and
the second technique uses “decision trees” to accomplish the same goal. We found that we could create
heuristics to be used at compile time for a specific compiler, language and architecture. Our results show
that this technique, called Evidence-based Static Prediction (ESP), results in a 20% mispredict rate, which
This study is motivated by these previous studies. We wondered if it would be effective to use profile
information to predict library behavior across different applications rather than predicting the behavior of
library routines using the Ball and Larus heuristics or the ESP techniques. We felt libraries had similar
behavior between different applications. If this was true, as this study shows, then we could use profiles
to perform compiler optimizations on libraries. Any program can then take advantage of the pre-optimized
libraries without having to pay the overhead of gathering profiles and performing compiler optimizations
on the library code.
3
Evaluation Methods
To perform our evaluation, we collected information from 43 C and FORTRAN programs. We instrumented
the programs from the SPEC92 benchmark suite and other programs, including many from the Perfect
Club [2] suite and a large number of applications for the X window system. We used ATOM to instrument
the programs [13]. The programs were compiled on a variety of DEC Alpha workstations using the Alpha
AXP-21064 processor with either the DEC C, C++ or FORTRAN compilers. Most programs were compiled
using the standard OSF/1 V3.2 operating systems; other programs were compiled using different compilers
and different versions of the operating system. All programs were compiled with optimization and linked
with shared libraries. Although we used shared libraries in our study, the results should be immediately
applicable to non-shared libraries. We instrumented the shared libraries because it clearly identified the
location of each subroutine, which could not be done by the subroutine name alone. For example, some
programs provide their own implementation of “qsort”. We wanted to determine when an application or
system routine was being used.
Table 1 shows the basic statistics for the programs we instrumented. Later tables examine a subset of the
programs shown in Table 1, because not all programs use all libraries. The first column in Table 1 lists the
number of instructions traced in millions of instructions, and the second column gives the percentage of traced
instructions that are branches. The next six columns divide the traced branches into six classes: conditional
branches (CB), unconditional branches (UB), procedure calls (PC), indirect procedure calls (IJSR), return
instructions (RET), and indirect jumps (JMP). The second to last column shows the percentage of procedure
calls that are between (Inter) libraries (objects). Procedure calls to shared libraries are implemented as
indirect jumps on the Alpha architecture running Digital Unix. Furthermore, shared libraries require that
symbols be “preemptable” – that is, if the main program defines a subroutine, and that subroutine name is
called within a library routine, the library routine must call the subroutine in the main program. This applies
to all procedures declared in libraries that are not statically defined. This means that procedure calls to
non-statically defined procedures within a shared library must use an indirect jump to locate the appropriate
# Insn’s % of Breakdown of Branches %Procs Program (Mill.) Branches %CB %UB %PC %IJSR %RET %JMP Inter N-Static APS 1459 4.7 84.9 4.6 5.0 0.1 5.2 0.2 53.5 2.5 CSS 382 9.5 77.3 8.7 5.1 0.9 5.9 2.1 40.8 14.3 LGS 904 8.1 85.4 3.2 4.9 0.7 5.7 0.0 27.7 0.0 LWS 14392 8.2 80.2 3.2 5.5 2.8 8.3 0.0 70.2 0.0 NAS 3511 3.8 60.8 5.7 15.3 0.2 15.5 2.5 97.9 2.1 SDS 1108 6.8 99.1 0.1 0.4 0.0 0.4 0.0 6.0 4.9 TFS 1718 3.4 94.0 1.0 2.3 0.0 2.4 0.3 93.2 5.9 TIS 1731 5.2 100.0 0.0 0.0 0.0 0.0 0.0 28.4 60.4 WSS 5556 5.6 85.8 6.7 1.7 0.4 2.0 3.4 57.6 33.9 fpppp 4262 2.7 87.1 7.5 0.7 2.0 2.7 0.0 30.6 0.1 hydro2d 6349 5.6 97.2 0.0 1.4 0.0 1.4 0.0 99.2 0.2 mdljsp2 3681 9.6 95.4 4.0 0.3 0.0 0.3 0.0 0.1 0.1 nasa7 6237 3.0 82.6 5.4 5.1 0.7 5.8 0.4 92.8 6.1 ora 5654 5.8 71.1 1.7 7.7 5.9 13.6 0.0 94.5 0.0 su2cor 4872 4.0 77.6 6.8 7.4 0.0 7.4 0.8 98.8 0.0 swm256 11041 1.7 99.6 0.2 0.1 0.0 0.1 0.1 96.1 0.3 tomcatv 910 3.3 99.8 0.1 0.0 0.0 0.0 0.0 44.0 54.7 turb3d 8682 6.4 82.4 5.0 5.0 1.2 6.2 0.3 66.9 0.0 wave5 3494 5.4 77.4 4.9 7.6 1.1 8.6 0.5 65.1 0.0 alvinn 5235 9.1 98.3 0.8 0.4 0.0 0.4 0.0 21.8 69.8 compress 89 12.4 86.6 8.8 2.3 0.0 2.3 0.0 0.1 0.1 ditroff 39 17.5 76.3 4.1 9.6 0.1 9.7 0.1 11.6 0.0 ear 13143 7.8 50.6 1.2 24.1 0.0 24.1 0.1 94.3 2.7 eqntott 1782 11.3 93.5 1.7 0.7 1.6 2.3 0.2 23.1 66.9 espresso 505 17.7 93.0 2.4 2.1 0.1 2.2 0.1 20.2 1.2 go 22770 15.6 80.4 4.0 7.7 0.0 7.7 0.1 0.2 0.0 li 1307 18.4 63.9 7.7 12.9 0.4 13.2 1.8 0.1 0.2 m88ksim 70796 18.7 69.9 16.0 6.5 0.1 6.6 0.9 0.0 0.0 perl 3400 14.1 66.7 8.0 9.9 1.0 10.8 3.7 24.2 2.9 sc 900 23.0 84.3 3.2 5.6 0.0 5.6 1.2 20.4 40.2 vortex 90401 16.3 69.2 10.1 10.3 0.0 10.3 0.1 5.9 0.2 cbzone 25 11.9 74.4 5.3 9.6 0.2 9.8 0.6 55.4 15.4 ghostview 22 15.4 78.2 5.1 7.7 0.5 8.2 0.3 43.0 31.6 gs 446 14.8 74.5 10.8 4.4 1.2 5.6 3.4 17.8 3.5 xanim 70 12.6 89.8 6.4 1.9 0.0 1.9 0.0 76.2 12.4 xfig 161 16.1 75.2 6.5 8.3 0.6 8.9 0.4 43.0 27.9 xkeycaps 32 17.7 76.2 6.6 6.8 1.6 8.4 0.3 52.2 22.0 xmgr 155 15.5 76.2 6.6 6.8 1.6 8.4 0.4 39.2 25.1 xpaint 20 14.9 73.6 7.0 8.1 1.4 9.5 0.4 52.3 31.5 xpilot 190 13.5 86.8 3.6 4.4 0.1 4.5 0.6 25.7 19.1 xpool 622 8.0 51.0 9.1 17.4 2.6 19.9 0.1 52.1 1.1 xtex 50 13.6 77.3 9.0 6.0 0.1 6.1 1.4 62.2 11.2 xv 1440 7.0 81.6 2.9 7.7 0.0 7.7 0.0 90.9 0.8 Fortran Avg 4523 5.4 86.2 3.6 4.0 0.8 4.8 0.6 61.2 9.8 C Avg 17531 15.1 77.7 5.7 7.7 0.3 7.9 0.7 18.5 15.4 X Avg 270 13.4 76.2 6.6 7.4 0.8 8.3 0.7 50.8 16.8 Overall Avg 6966 10.4 81.1 5.0 6.0 0.7 6.6 0.6 46.4 13.3
% of Instructions Executed in Each Library
Programs main libc libm libUfor libfor libFutil libots
APS 92.17 0.12 5.19 1.19 0.46 0.87 —
CSS 65.52 0.85 10.96 3.71 16.62 2.34 —
LGS 93.36 — 5.19 1.43 0.01 — —
LWS 56.90 — 43.08 — 0.01 0.01 —
NAS 51.73 0.09 42.56 0.11 3.53 1.98 —
SDS 99.63 0.03 0.03 0.04 0.12 0.15 —
TFS 94.49 0.14 4.48 0.11 0.51 0.27 —
TIS 99.99 — — — — — —
WSS 80.75 0.38 3.11 0.20 7.02 8.54 —
fpppp
p
95.18 — 4.81 — — — —
hydro2d
p
94.34 — 5.63 — 0.02 — —
mdljsp2p
99.99 — — — — — —
nasa7
p
87.60 0.05 11.81 0.07 0.25 0.22 —
ora
p
44.66 — 55.34 — — — —
su2corp
77.04 — 22.96 — — — —
swm256
p
99.89 — 0.11 — — — —
tomcatv
p
99.87 — — 0.02 0.06 0.04 —
turb3d 89.17 — 10.83 — — — —
wave5
p
77.89 — 16.45 5.66 — — —
[image:9.612.144.472.103.396.2]Avg 84.22 0.09 12.76 0.66 1.51 0.76 0.00
Table 2: Percentage of instructions executed in the main program and each library for the FORTRAN programs. Programs with a check mark (
p
) are in the SPEC92 benchmark suite.
destination are within the same library, but because of symbol preemption an indirect procedure call must
be used since the destination procedure is not statically defined (N-Static).
These last two columns in Table 1 are of interest when implementing shared libraries. Overall, 60%
(46:4%+13:3%) of the procedure calls executed by the programs must be implemented as indirect procedure
calls. A sizable fraction of these calls (13.3%) occur because of the symbol preemption rules in Unix. Indirect
procedure calls contribute considerable overhead to applications. Not only do they require mechanisms such
as branch target buffers or specialized compiler optimizations to avoid mispredict penalties, the need for the
late binding in shared libraries makes inter-procedural optimization very difficult or impossible. There are a
number of optimizations or organizations that can be considered to reduce the overhead of shared libraries;
however, these are issues we will address in a later paper.
3.1 Choosing the Libraries for this Study
Tables 2, 3, and 4 show all the libraries used by the FORTRAN and C programs we measured. All the
% of Instructions Executed in Each Library
Programs main libc libm libots libcurses
alvinn
p
97.25 2.12 0.63
compress
p
99.98 0.02
ditroff 87.80 12.20
ear
p
90.33 6.12 3.55
eqntott
p
94.29 5.71
espressop
93.93 6.07
go 99.99 0.01
li
p
99.71 0.29 —
m88ksim 99.75 0.03 — 0.22
perl 70.70 29.30 —
sc
p
53.03 18.42 — 28.55
vortex 95.11 4.89 —
[image:10.612.171.443.172.374.2]Avg 90.15 7.10 0.35 0.02 2.38
Table 3: Percentage of instructions executed in the main program and each library for the C programs that do not use the X11 libraries. Programs with a check mark (
p
) are in the SPEC92 benchmark suite.
% of Instructions Executed in Each Library
Programs main libc libm libX11 libXaw libXext libXm libXmu libXt libdnet stub cbzone 48.10 11.80 7.60 32.14 — 0.36 — ghostview 3.38 23.39 — 20.93 7.53 0.02 0.08 44.68 —
gs 91.88 4.99 0.18 2.93 — 0.02 —
xanim 62.40 29.96 0.06 4.36 0.09 — — 3.13 — xfig 4.95 15.05 0.15 28.58 9.84 — 0.14 41.30 — xkeycaps 6.47 18.45 43.15 3.70 0.01 0.06 28.15 — xmgr 22.95 12.13 0.04 23.24 — 17.05 — 24.60 — xpaint 14.11 11.01 — 25.43 0.77 — 0.02 48.66 —
xpilot 68.64 24.24 0.03 7.09 — —
xpool 53.17 0.26 44.91 1.65 — —
xtex 45.02 23.86 — 23.09 2.95 — 0.03 5.05 —
xv 74.07 25.46 0.01 0.46 —
Avg 41.26 16.72 4.41 17.75 2.07 0.00 1.42 0.03 16.33 0.00
[image:10.612.78.537.447.621.2]groups. The first group did not use the X11 window libraries, while the second group did. Programs that
are part of the SPEC92 benchmark suite are indicated by check marks. These tables show the percentage
of instructions executed by each program in each library. The “main” library indicates the main module of
the program. The dashed entries (—) in the tables mean that the library was linked with the application,
but less than 0.01 percent of the program’s instructions were executed in that library. An empty value for a
given library and program indicates that the program was not linked with that library. For example, theAPS
program shown in Table 2 executes 92.17% of its instructions in the main program, and a small fraction of
its instructions inlibc,libm,libUfor,libforandlibFutil. Although it is linked withlibots,
it spends very little time in that library. By comparison, the blank entries for thealvinnprogram in Table 3
show it is not linked withlibotsorlibcurses.
These results show that for the FORTRAN programs 84% of the program’s execution takes place in the
main program module while 13% of execution takes place inlibm, with the remaining 3% of instructions
being executed inlibUfor,libfor, andlibFutilon average. These libraries contain routines for the
FORTRAN compiler, such as formatted I/O and the implementation for intrinsic functions. Thelibots
library contains runtime support for the DEC GEM compiler, such as field extraction and extended precision
functions.
For the C programs 90% of the program’s execution is in the main module, while most of the remaining
instructions executed are inlibc. Thelibcurseslibrary implements a screen interface for terminals,
and is only used by thescspreadsheet program. For the X11 C programs, only 41% of the instructions
are executed in the main module, while 17% execute inlibc, 18% inlibX11, 16% inlibXt, and 2%
inlibXaw. The libX11 library implements the basic protocol layer for the X11 window system. The
libXtlibrary implements the basic toolkit infrastructure andlibXawimplements a specific collection of
interface components.
Overall, Tables 2, 3, and 4 indicate that the FORTRAN programs spend more of their time in library
routines than C programs that do not use the X11 libraries, and that the X11 programs execute in libraries
more than the other programs. These tables also indicate that the SPEC92 C programs are particularly
unrepresentative in their use of library routines. This is understandable since the SPEC92 benchmark suite
was intended to be highly portable. Although FORTRAN is a highly standardized language, the C language
is less standardized. Thus, “portable” C programs may make little use of various libraries.
From these tables we chose to examinelibc,libX11,libXt,libXaw,libm,libUfor,libfor,
libFutil, andlibX11 in this study. The remaining libraries were not used in enough programs or used
3.2 Cross-Validation Study
In gathering statistics for each library we chose to only include programs in a library’s study if the program
executed more than 1% of its instructions or conditional branches in that library. For example, we only
considerghostview,xfig,xkeycaps, andxtexwhen gathering data forlibXaw.
In gathering branch prediction statistics we conducted a cross-validation study. When measuring the
performance for a particular application and library, we used library profile information from all other
programs excluding the program being measured. We created a weighted (Weight) and normalized (Norm)
average of these profiles. We call these profiles the cross-validation profiles. In the weighted average, the
profile statistics gathered for a given program are weighted by the number of times the program executed that
branch or basic block. In the normalized average, each program was given equal weight when creating the
cross-validation profile. Therefore, when creating the normalized profile, all the profiled branch frequencies
for a given program are divided by the total number of branches executed in that program’s profile before
the frequencies are added into the cross-validation profile. For example, when examining the branching
behavior forxfigin thelibXawlibrary, we created a cross-validation profile usinglibXawprofiles from
ghostview,xkeycaps, andxtex. This cross-validation profile was then used to predict the conditional
branches and obtain the branch coverage forxfig(the program that was excluded from this process). This
provides a fair evaluation of how well the profile for a given library will perform for any given program.
We concentrate on conditional branch prediction miss rates because we feel they are the best indicator for
how well a profile will predict the behavior of a given program.
4
Library Results
We examined the differences in profile branch prediction accuracy and the coverage of procedures, basic
blocks, conditional branches, and conditional branch edges to determine how closely a profile gathered from
one group of applications matches the behavior of another application.
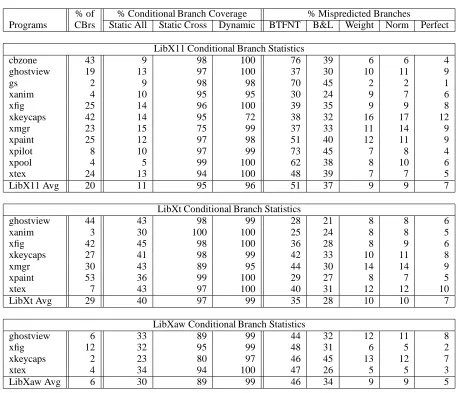
Results and Explanation of Data Presented for C Library: We will present the same statistics for each
library. Table 5 shows the conditional branch statistics for libc. The first column shows the overall
percentage of conditional branches that each program executes in this library. The next three columns show
the coverage achieved by the cross-validation profile. The column labeled “Static-All” represents the percent
of static conditional branch sites inlibc each program executes, “Static-Cross” shows the percentage of
static conditional branch sites executed for a program that were also executed in the cross-validation profile,
and “Dynamic” represents the percentage of dynamic conditional branches executed inlibc that were
also executed in the cross-validation profile. Static-Cross and Dynamic show the average coverage of the
% of % Conditional Branch Coverage % Mispredicted Branches
Programs CBrs Static All Static Cross Dynamic BTFNT B&L Weight Norm Perfect
alvinn 4 4 98 94 44 38 16 12 5
ditroff 7 2 100 100 5 8 20 19 2
ear 16 4 95 90 47 41 17 19 10
eqntott 5 2 99 100 48 54 14 24 4 espresso 5 4 98 100 25 39 14 14 11 perl 29 3 100 100 44 47 32 30 15
sc 10 4 92 73 51 42 8 9 4
vortex 6 5 96 100 25 27 14 20 11 cbzone 20 6 98 100 32 47 22 21 18 ghostview 28 8 99 100 37 26 11 14 8
gs 7 7 99 100 37 35 25 18 13
xanim 35 7 100 100 10 14 13 13 6 xfig 18 8 100 100 26 28 18 16 11 xkeycaps 19 8 99 100 33 31 17 17 13 xmgr 16 10 96 100 29 32 17 17 13 xpaint 13 6 100 100 33 47 13 14 10 xpilot 36 10 93 48 26 35 16 14 10
xtex 25 9 100 100 47 25 12 11 2
xv 37 7 99 100 20 20 19 19 0
[image:13.612.84.529.203.458.2]Libc Avg 18 6 98 95 33 34 17 17 9
Heuristic Heuristic
Name Description
Loop Branch Predict that the edge back to the loop’s head is taken and the edge exiting the loop is not taken.
Loop Exit If a comparison is inside a loop and no successor is a loop head, predict the edge exiting the loop as not taken.
Pointer If a branch compares a pointer against null or compares two pointers, predict the branch on false condition as taken.
Call Predict the successor that contains a call and does not post-dominate the branch as taken.
Opcode If a branch checks an integer for less than zero, less than or equal to zero, or equal to a constant, predict the branch on false condition.
Return Predict the successor that contains a return as not taken.
Store Predict the successor that contains a store instruction and does not post-dominate the branch as not taken.
Loop Header Predict the successor that does not post-dominate and is a loop header or a loop pre-header as taken.
[image:14.612.86.524.119.393.2]Guard If a register is an operand of the branch comparison, the register is used before being defined in a successor block, and the successor block does not post-dominate the branch, predict the successor block as taken.
Table 6: Summary of the Ball/Larus Heuristics
Table 5 are included in the cross-validation profile for thelibclibrary results. As mentioned in the previous
section, only programs that have more than 1% of their instructions or conditional branches executed in a
library are included in the study of that library in Tables 5, 7, and 8.
Table 5 shows that the programs included in thelibcstudy executed 18% of their conditional branches
inlibc. However, only 6% of the static conditional branch sites were executed inlibcby each program.
On average, 98% of these static conditional branch sites were also executed by other programs in the
cross-validation profile. These profiled sites account for 95% of the conditional branches executed by each
program on average in thelibclibrary. Overall, the coverage results show that each program only executed
a small portion of branch sites in each library, and the cross-validation profiles provided profile information
to predict 95% of the branches executed in thelibclibrary.
The last five columns in this table indicate how well the cross-validation profile can predict the outcome
of the conditional branches in libc. The column labeled “BTFNT” represents the conditional branch
miss rates using the “backwards-taken, forwards-not-taken” static branch prediction technique. The next
column, labeled “B&L”, shows the miss rates due to the heuristics as defined by Ball and Larus [1]. We use
the same implementation for the B&L heuristics in this study as was used in the previous ESP study [4].
[image:14.612.84.526.127.393.2]order, and branches not being predicted by a heuristic are predicted using a uniform random distribution.
The pre-determined order is shown in Table 6, going from top to bottom, starting with the Loop-Branch
heuristic ending with the Guard heuristic. This order was found to be one of the most effective orderings
in the Ball and Larus study [1]. The “Weight” column in Table 5 represents the static profile-based miss
rates using the weighted cross-validation profile, and “Norm” represents the miss rates using the normalized
cross-validation profile. The “Perfect” column is the miss rates achieved by using the same input to trace
the program and to measure the branch prediction accuracy. In each case, the misprediction rates shown
are for only the conditional branches that were also executed (covered) in the cross-validation profile. The
average misprediction results forlibcshows that the cross-validation profile achieves a normalized miss
rate of 17% which is only 8% higher than the perfect miss rate of 9%. The average BTFNT miss rate is
33%, and the B&L heuristic miss rate is 34%.
Therefore forear these results apply to 90% of its conditional branches executed in libc, which
accounts for 14% (90% * 16%) of all the conditional branches executed byear. The misprediction results
show that, forear, the cross-validation profile achieves a normalized misprediction rate of 19% which is
9% higher than the perfect miss rate of 10%. The BTFNT miss rate forearis 47%, and the B&L heuristic
miss rate is 41%.
Overall, the table shows that the collection of programs we examined used only a small fraction of
the static conditional branch sites inlibc, and that the weighted and normalized cross-validation profiles
provide accurate branch prediction information for those branches.
Results for X Libraries: Table 7 shows the conditional branch results for the X windows libraries
libX11, libXtandlibXaw. The format for these tables follows that of the table described previously
forlibc. Programs may appear in multiple tables because they use multiple libraries. For example,xtex
useslibc,libX11, libXtandlibXaw, whilexpilot only useslibcandlibX11. In each case,
the “% of CBrs” reflects the percentage of conditional branches that can be attributed to that library. These
results show that the X programs execute considerably more code in libraries than the other C programs,
that the libraries are used similarly between different applications, and the cross-validation profile miss rates
are very close to the Perfect miss rate.
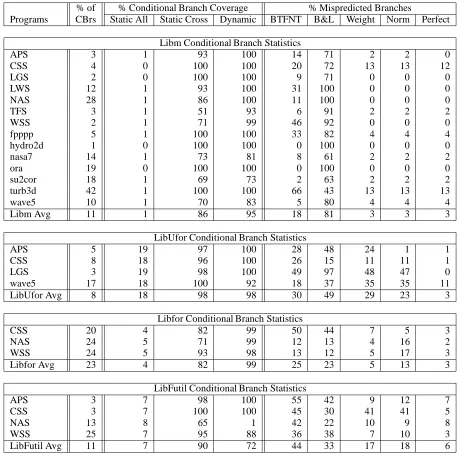
Results for FORTRAN Libraries: Table 8 shows the conditional branch misprediction rates for the
FORTRAN programs that uselibm,libUfor,libfor, andlibFutil. Notice that the cross-validation
profiles forlibmhave an average 3% misprediction rate, which is the same as the average Perfect miss rate.
This implies that performing profile optimizations onlibmwould be highly effective. The other libraries
also have decent miss rates, withlibUfor having the worse accuracy. Notice the high miss rates of 81%
% of % Conditional Branch Coverage % Mispredicted Branches
Programs CBrs Static All Static Cross Dynamic BTFNT B&L Weight Norm Perfect LibX11 Conditional Branch Statistics
cbzone 43 9 98 100 76 39 6 6 4
ghostview 19 13 97 100 37 30 10 11 9
gs 2 9 98 98 70 45 2 2 1
xanim 4 10 95 95 30 24 9 7 6
xfig 25 14 96 100 39 35 9 9 8
xkeycaps 42 14 95 72 38 32 16 17 12
xmgr 23 15 75 99 37 33 11 14 9
xpaint 25 12 97 98 51 40 12 11 9
xpilot 8 10 97 99 73 45 7 8 4
xpool 4 5 99 100 62 38 8 10 6
xtex 24 13 94 100 48 39 7 7 5
LibX11 Avg 20 11 95 96 51 37 9 9 7 LibXt Conditional Branch Statistics
ghostview 44 43 98 99 28 21 8 8 6
xanim 3 30 100 100 25 24 8 8 5
xfig 42 45 98 100 36 28 8 9 6
xkeycaps 27 41 98 99 42 33 10 11 8
xmgr 30 43 89 95 44 30 14 14 9
xpaint 53 36 99 100 29 27 8 7 5
xtex 7 43 97 100 40 31 12 12 10
LibXt Avg 29 40 97 99 35 28 10 10 7 LibXaw Conditional Branch Statistics
ghostview 6 33 89 99 44 32 12 11 8
xfig 12 32 95 99 48 31 6 5 2
xkeycaps 2 23 80 97 46 45 13 12 7
xtex 4 34 94 100 47 26 5 5 3
[image:16.612.77.535.205.598.2]LibXaw Avg 6 30 89 99 46 34 9 9 5
% of % Conditional Branch Coverage % Mispredicted Branches
Programs CBrs Static All Static Cross Dynamic BTFNT B&L Weight Norm Perfect Libm Conditional Branch Statistics
APS 3 1 93 100 14 71 2 2 0
CSS 4 0 100 100 20 72 13 13 12
LGS 2 0 100 100 9 71 0 0 0
LWS 12 1 93 100 31 100 0 0 0
NAS 28 1 86 100 11 100 0 0 0
TFS 3 1 51 93 6 91 2 2 2
WSS 2 1 71 99 46 92 0 0 0
fpppp 5 1 100 100 33 82 4 4 4
hydro2d 1 0 100 100 0 100 0 0 0
nasa7 14 1 73 81 8 61 2 2 2
ora 19 0 100 100 0 100 0 0 0
su2cor 18 1 69 73 2 63 2 2 2
turb3d 42 1 100 100 66 43 13 13 13
wave5 10 1 70 83 5 80 4 4 4
Libm Avg 11 1 86 95 18 81 3 3 3
LibUfor Conditional Branch Statistics
APS 5 19 97 100 28 48 24 1 1
CSS 8 18 96 100 26 15 11 11 1
LGS 3 19 98 100 49 97 48 47 0
wave5 17 18 100 92 18 37 35 35 11 LibUfor Avg 8 18 98 98 30 49 29 23 3
Libfor Conditional Branch Statistics
CSS 20 4 82 99 50 44 7 5 3
NAS 24 5 71 99 12 13 4 16 2
WSS 24 5 93 98 13 12 5 17 3
Libfor Avg 23 4 82 99 25 23 5 13 3 LibFutil Conditional Branch Statistics
APS 3 7 98 100 55 42 9 12 7
CSS 3 7 100 100 45 30 41 41 5
NAS 13 8 65 1 42 22 10 9 8
WSS 25 7 95 88 36 38 7 10 3
[image:17.612.76.534.170.625.2]LibFutil Avg 11 7 90 72 44 33 17 18 6
Table 8: Conditional branch statistics for the FORTRAN programs using thelibm, libUfor, libfor
of 18% and 30% when using static BTFNT prediction. Later, we will provide analysis showing the reasons
for B&L heuristic’s poor performance forlibm.
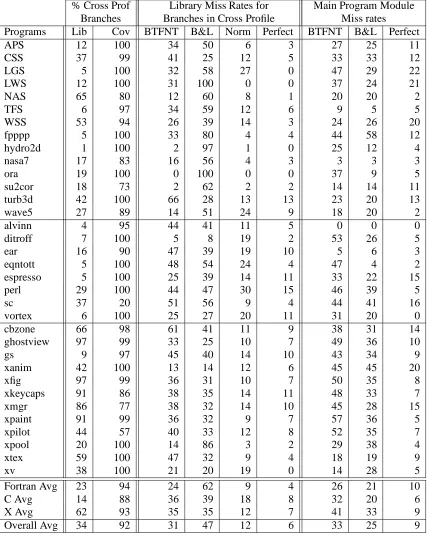
4.1 Combined Library Results
The previous results showed the miss rates for the individual libraries. Now, we present the overall combined
library miss rates for each program and the miss rates achieved by the program’s main module.
The first two columns of Table 9 show the dynamic percentage of all branches that are executed in library
code, followed by the percentage of those branch sites that are recorded in the cross-validation profile. For
example, 65% of the conditional branches executed by NAS were executed in library code, and 80% of
those branches were executed (covered) in a cross-validation profile. Thus, 65%80%, or 52%, of the
total branches executed byNASwere predicted by library profiles from other programs.
The next four columns, under the major heading “Library Miss Rates for Branches in Cross Profile”,
shows the mispredict rates for all the conditional branches in a program that are covered in the
cross-validation profile. We created a normalized cross-cross-validation profile as before. Since we are addressing
multiple libraries, we included profiles from each library that the program used into a combined
cross-validation profile. We only used the programs mentioned in the previous section to form the cross-cross-validation
profile for a specific library. For example, when gathering the statistics foralvinn, which useslibcand
libm, we combined the profiles forlibc for all the programs shown in Table 5, leaving outalvinnas
before. Then, forlibm, we combined all the profiles for the 14 programs listed in Table 8 underlibm.
These two combined cross-validation profiles were then used to predict library branches for alvinn.
We repeated this process creating a combined cross-validation profile for each program, and we used the
“normalized” cross-validation profiles when reporting miss rates.
The results in columns 3 through 6 in Table 9 show the library misprediction rates for only branches
in the cross-validation profile. These miss rates apply to 34%92%, or 31% of the conditional branches
executed on average for the programs we examined. Overall, the low misprediction rates indicate that
applying profiled-directed optimizations to library routines would be useful, reducing the average branch
misprediction rate for conditional branches executed in libraries to 12%. This mispredict rate is comparable
to the results Fisher and Freundenberger observed when using different runs of a program to predict the
outcome of the same program [8]. They found for their C/Integer benchmarks that using different profiles
gave them a prediction accuracy between 75% to 95% of “perfect” branch prediction. In Table 9 the “C Avg”
results show that, 82%=92%, or 89% of the Perfect branch prediction accuracy is achieved for conditional
branches using profiles from different applications.
The last three columns in Table 9 show the miss rates for each program’s “Main Program Module”
% Cross Prof Library Miss Rates for Main Program Module
Branches Branches in Cross Profile Miss rates
Programs Lib Cov BTFNT B&L Norm Perfect BTFNT B&L Perfect
APS 12 100 34 50 6 3 27 25 11
CSS 37 99 41 25 12 5 33 33 12
LGS 5 100 32 58 27 0 47 29 22
LWS 12 100 31 100 0 0 37 24 21
NAS 65 80 12 60 8 1 20 20 2
TFS 6 97 34 59 12 6 9 5 5
WSS 53 94 26 39 14 3 24 26 20
fpppp 5 100 33 80 4 4 44 58 12
hydro2d 1 100 2 97 1 0 25 12 4
nasa7 17 83 16 56 4 3 3 3 3
ora 19 100 0 100 0 0 37 9 5
su2cor 18 73 2 62 2 2 14 14 11
turb3d 42 100 66 28 13 13 23 20 13
wave5 27 89 14 51 24 9 18 20 2
alvinn 4 95 44 41 11 5 0 0 0
ditroff 7 100 5 8 19 2 53 26 5
ear 16 90 47 39 19 10 5 6 3
eqntott 5 100 48 54 24 4 47 4 2
espresso 5 100 25 39 14 11 33 22 15
perl 29 100 44 47 30 15 46 39 5
sc 37 20 51 56 9 4 44 41 16
vortex 6 100 25 27 20 11 31 20 0
cbzone 66 98 61 41 11 9 38 31 14
ghostview 97 99 33 25 10 7 49 36 10
gs 9 97 45 40 14 10 43 34 9
xanim 42 100 13 14 12 6 45 45 20
xfig 97 99 36 31 10 7 50 35 8
xkeycaps 91 86 38 35 14 11 48 33 7
xmgr 86 77 38 32 14 10 45 28 15
xpaint 91 99 36 32 9 7 57 36 5
xpilot 44 57 40 33 12 8 52 35 7
xpool 20 100 14 86 3 2 29 38 4
xtex 59 100 47 32 9 4 18 19 9
xv 38 100 21 20 19 0 14 28 5
Fortran Avg 23 94 24 62 9 4 26 21 10
C Avg 14 88 36 39 18 8 32 20 6
X Avg 62 93 35 35 12 7 41 33 9
[image:19.612.94.521.120.655.2]Overall Avg 34 92 31 47 12 6 33 25 9
module, we mean all non Unix library code. On average, the programs in Table 9 execute 34% of their
conditional branches in library code and 66% of their branches in the main program module. Overall, the
low misprediction rate for the normalized cross-validation profile indicates that applying profiled-directed
optimizations to library routines would be useful, reducing the average static branch miss rate for conditional
branches executed in libraries to 12%. The results also show that on average the B&L heuristics have better
prediction than BTFNT for the main program module, but worse performance than BTFNT for library code.
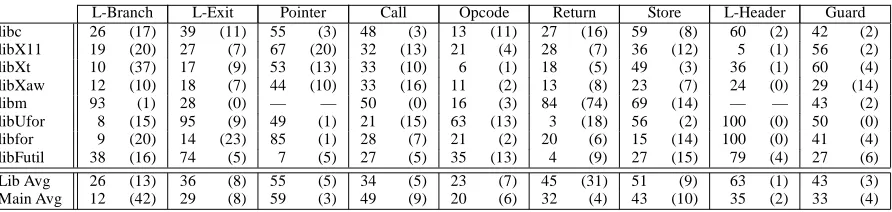
4.2 Analysis of Heuristic-based Library Performance
The reasons for B&L heuristic’s poor performance forlibmis shown in Tables 10 and 11. These two tables
contain average branch statistics for each of the libraries previously examined. The row labeled “Library
Avg” shows the average statistics for the library results in Table 9, and “Main Avg” is the average statistics
for the main program module results also shown in Table 9.
Table 10 gives a breakdown of the number of conditional branches executed that were not-taken and
taken, in terms of where the branch’s target instruction is laid out in the code in comparison to the branch’s
location. We call a branch a Backward branch if it has a negative branch displacement. A Forward branch
is a branch with a positive branch displacement. This table, in effect, shows the performance breakdown for
BTFNT prediction. The BTFNT miss rate is the sum of the percentage of Forward branches that are taken
and the percentage of Backward branches that are not-taken. In general, the library routines execute very
few Backward branches, only 14%, compared to 42% Backward branches in the main program module.
Table 11 gives the average breakdown of the B&L heuristics for each library. The heuristics are
described in Table 6, and were applied to the branches in the pre-determined order shown in going from
left to right in Table 11, with the Loop-Branch heuristic being the first heuristic applied. For each heuristic
shown in Table 11 there are two numbers. The left number shows the heuristic’s mispredict rate and the
right number, shown in parentheses, represents the percentage of branches executed in the library that
used the corresponding heuristic for branch prediction. For example, the programs usinglibc used the
Return heuristic for 16% of the executed branches on average with a mispredict rate of 27%. The remaining
percentage of branches executed, not shown in Table 11, were predicted using a uniform random distribution.
These results show why poor performance is seen forlibmwhen using the B&L heuristics. The results
show thatlibmhas 74% of its branches predicted using the Return heuristic with a mispredict rate of 84%,
and thatlibmhas 82% of its branches executed as Forward branches that are not-taken. This means a large
number of conditional branches executed inlibm were not-taken, and they executed a control flow path
unconditionally to a return instruction. Because of the high miss rate for the Return heuristic forlibmand
because library code typically executes many return instructions, one might be tempted to specialize the
Forward Branching CBrs Backward Branching CBrs %Not-Taken %Taken %Not-Taken %Taken
libc 53 29 4 14
libX11 32 48 3 17
libXt 31 32 3 34
libXaw 45 45 1 9
libm 82 17 1 0
libUfor 57 28 2 13
libfor 55 22 3 20
libFutil 42 39 5 14
Library Avg 58 28 3 11
[image:21.612.157.459.194.340.2]Main Avg 30 28 5 37
Table 10: Breakdown of not-taken and taken executed branches in terms of the conditional branch instruc-tion’s branching direction. Average results are shown for each of the libraries previously studied, and for the overall Library average and Main program average. Note, that taking the average of the individual library results will not equal the Library average, since the same program can be included in several of the individual library results and the Library average only includes each program once.
L-Branch L-Exit Pointer Call Opcode Return Store L-Header Guard libc 26 (17) 39 (11) 55 (3) 48 (3) 13 (11) 27 (16) 59 (8) 60 (2) 42 (2) libX11 19 (20) 27 (7) 67 (20) 32 (13) 21 (4) 28 (7) 36 (12) 5 (1) 56 (2) libXt 10 (37) 17 (9) 53 (13) 33 (10) 6 (1) 18 (5) 49 (3) 36 (1) 60 (4) libXaw 12 (10) 18 (7) 44 (10) 33 (16) 11 (2) 13 (8) 23 (7) 24 (0) 29 (14) libm 93 (1) 28 (0) — — 50 (0) 16 (3) 84 (74) 69 (14) — — 43 (2) libUfor 8 (15) 95 (9) 49 (1) 21 (15) 63 (13) 3 (18) 56 (2) 100 (0) 50 (0) libfor 9 (20) 14 (23) 85 (1) 28 (7) 21 (2) 20 (6) 15 (14) 100 (0) 41 (4) libFutil 38 (16) 74 (5) 7 (5) 27 (5) 35 (13) 4 (9) 27 (15) 79 (4) 27 (6) Lib Avg 26 (13) 36 (8) 55 (5) 34 (5) 23 (7) 45 (31) 51 (9) 63 (1) 43 (3) Main Avg 12 (42) 29 (8) 59 (3) 49 (9) 20 (6) 32 (4) 43 (10) 35 (2) 33 (4)
[image:21.612.87.533.437.543.2]work well forlibm, but not for any of the other libraries. The other libraries also use the Return heuristic
a fair amount of time, and they have an average mispredict rate of only 16% for the Return heuristic’s
current definition. This situation emphasizes how hard it is to make general heuristics that perform well in
all situations.
4.3 Results for Using a Pre-Optimized Library
We now turn to the issue of overall program branch prediction performance, and we consider how the
performance of static branch prediction will affect programmers who use shared and non-shared libraries.
We consider two scenarios that apply this information. Consider two programmers using a system with a
“whole program” optimizer. In this system both programmers use the pre-optimized library results shown
in columns 3 through 6 in Table 9 when linking their application.
Assume that the first programmer cannot or will not profile their program for further optimization, but
the second programmer does. Therefore the first programmer, the non-profiling programmer, must rely
on heuristics to improve the program’s main module performance. In this case, we assume the compiler
uses the B&L heuristics for the main program module. The second programmer, the profiling programmer,
profiles the main program but not the library routines. This scenario would arise when shared libraries
are used. In both of these cases the same pre-optimized libraries are used when linking the application.
The misprediction rates for both of these programmers are shown in the first 8 columns in Table 12, where
“BTFNT” uses BTFNT branch prediction and “B&L” uses the Ball and Larus heuristics for all library
branches. “Norm” uses the normalized cross-validation profile for the library branches covered in the
profile, and B&L heuristics for branches not covered in the cross-validation profile to pre-optimize the
libraries. “Perfect” shows the results of using perfect profile branch prediction for only the branches in the
cross-validation profile, and B&L heuristics for library branches not in the cross-validation profile. Perfect
is an unlikely scenario, and is used to only show a lower bound on the miss rate achievable from using a
normalized cross-validation profile. In summary, the only performance difference between the non-profiling
programmer and the profiling programmer comes from the main program module’s miss rates because both
programmers use the same pre-optimized libraries.
The major column in Table 12 labeled “Miss Rates for Non-Profiling Programmer” contains the four
sub-columns indicating how the libraries were pre-optimized as described above, and the branch mispredict
rates achieved with that method. In this case, the B&L heuristics are used to predict the programs main
module’s branches. A non-profiling programmer writing thecbzoneapplication would achieve an overall
50% mispredict rate using a library pre-optimized with BTFNT, a 37% miss rate when using B&L heuristics,
an 18% mispredict rate using a library pre-optimized with the normalized cross-validation profile, and a
Miss Rates for “Non-Profiling” Miss Rates for “Profiling”
Programmer Using B&L Programmer Using Perfect Overall
Programs BTFNT B&L Norm Perfect BTFNT B&L Norm Perfect Perfect
APS 27 28 23 23 14 16 11 10 10
CSS 36 30 25 23 22 17 12 9 9
LGS 29 30 29 27 22 24 22 21 21
LWS 25 33 21 21 22 30 18 18 18
NAS 16 44 17 13 9 38 10 7 2
TFS 7 9 6 5 7 8 5 5 5
WSS 27 33 21 15 24 30 18 13 11
fpppp 56 59 55 55 13 16 12 12 12
hydro2d 12 13 12 12 4 6 4 4 4
nasa7 5 11 4 4 5 11 3 3 3
ora 7 26 7 7 4 22 4 4 4
su2cor 12 21 13 13 10 19 11 11 10
turb3d 39 24 18 18 35 19 13 13 13
wave5 19 27 21 17 6 14 8 4 4
alvinn 2 2 1 1 2 2 1 1 0
ditroff 25 25 26 25 5 5 6 5 5
ear 13 12 9 7 10 9 6 5 4
eqntott 6 6 5 4 5 5 3 2 2
espresso 22 23 21 21 16 16 15 15 15
perl 40 41 36 32 16 17 12 8 8
sc 40 35 32 31 24 19 16 15 11
vortex 20 20 20 19 2 2 2 1 1
cbzone 50 37 18 16 45 32 12 11 10
ghostview 33 26 11 8 33 25 11 8 7
gs 35 35 32 32 12 12 10 9 9
xanim 32 32 31 29 17 17 17 14 14
xfig 36 31 11 8 36 30 10 7 7
xkeycaps 37 35 18 16 34 32 16 13 10
xmgr 37 31 20 17 35 30 18 15 10
xpaint 36 33 12 10 33 30 9 7 7
xpilot 39 32 26 25 23 16 10 10 9
xpool 33 48 31 31 6 20 4 3 3
xtex 35 26 13 10 31 23 9 6 6
xv 25 25 25 18 11 11 10 3 3
Fortran Avg 23 28 19 18 14 19 11 10 9
C Avg 21 20 19 17 10 9 8 6 6
X Avg 36 33 21 18 26 23 11 9 8
[image:23.612.85.527.104.647.2]Overall Avg 27 28 20 18 17 18 10 9 8
The column labeled “Miss Rates for Profiling Programmer” has columns analogous to the case for the
non-profiling programmer. In this case the programmer profiles their own program but not the libraries. For
thecbzone application, BTFNT achieves a 45% mispredict rate, B&L a 32% miss rate, the normalized
cross-validation profile results in a 12% mispredict rate, and a 11% miss rate is achieved using Perfect
profile prediction.
The final column, “Overall-Perfect”, in Table 12 gives the mispredict rate seen by profiling the whole
program, including all library branches, using the same input to profile the program and to report the branch
prediction miss rates.
The average results in Table 12 show, when using a library pre-optimized with a normalized
cross-validation profile, that a non-profiling programmer can achieve a miss rate only 2% higher than the Perfect
miss rate of 18%. The profile programmer achieves a miss rate which is only 1% higher than the Perfect 9%
miss rate. In comparing the profile programmer using the normalized pre-optimized library to the
Overall-Perfect prediction accuracy, the pre-optimized library mispredict rate is only 2% higher. The Overall-Perfect and
Overall-Perfect prediction miss rates provide a lower bound for the miss rate for this type of profile-based
branch prediction. These results are very encouraging showing that almost the same prediction accuracy
can be achieved using a profiled pre-optimized library with no cost to the programmer, as if the programmer
took the time to profile and customize the library and recompile it for each specific application.
4.4 Coverage Statistics
To get an overall picture on how these libraries were used, we examined the frequency and coverage of
procedure invocations, basic blocks, conditional branches and conditional branch edges executed in each
library. We used all the programs we measured and combined their profiles to obtain these statistics.
Table 13 shows the number of static procedures, basic blocks, conditional branches and conditional
branch edges in each of the libraries we measured. For example, the version oflibcwe used contained
1;848 procedures, 34;194 basic blocks and 12;153 conditional branches. Table 13 also shows the coverage
for each component for all the programs measured. For example, 14% of the procedures inlibc were
executed by our program suite, resulting in 11% of the basic blocks and 16% of the conditional branch
sites being executed. The columns labeled “CBrs Edges” indicate the number of conditional branch
“edges” executed. For example, 16% of the conditional branches inlibc were executed, but only 11%
of the conditional branch edges were executed. The last column of Table 13 represents the percentage
of conditional branches in that library where both edges were executed. For example, only 37% of the
conditional branches inlibcexecuted both edges, indicating that many branches guard conditions that did
Procedures Basic Blocks Conditional Brs CBrs Edges % CBrs Libraries Static %Cov Static %Cov Static %Cov Static %Cov Both Edges libc 1848 14 34194 11 12153 16 24306 11 37 libX11 1330 31 31648 21 11456 27 22912 18 30 libXt 879 42 14452 49 5090 60 10180 44 46 libXaw 636 39 8466 46 2565 54 5130 39 43 libm 501 7 23955 2 4620 5 9240 3 39 libUfor 136 21 3461 16 1248 21 2496 12 11 libfor 195 11 15049 6 6324 8 12648 5 20 libFutil 115 13 6827 12 3491 16 6982 10 32
Table 13: Coverage statistics for each library. This is the coverage of all the combined profiles. Static represents the static number of procedures, basic blocks, conditional branches, and edges in each library. %Cov represents the percentage of these static procedures, basic blocks, conditional branches, and edges executed in the profiles. % CBrs Both Edges shows the percentage of conditional branch sites executed that have both its fall-through and taken edge executed.
% Procedures % Basic Blocks % Cond Brs % Cond Br Edges Static Static Dyn- Static Static Dyn- Static Static Dyn- Static Static Dyn-Libraries All Cross amic All Cross amic All Cross amic All Cross amic libc 6 97 98 4 97 95 6 98 95 4 97 95 libX11 13 94 96 9 94 96 11 95 96 7 94 96 libXt 28 96 99 33 96 99 40 97 99 28 96 99 libXaw 26 90 99 28 89 98 30 89 99 22 85 98 libm 2 93 98 1 87 96 1 86 95 1 83 95 libUfor 18 97 96 14 97 96 18 98 98 10 97 94 libfor 9 89 100 4 82 98 4 82 99 3 81 99 libFutil 9 94 75 7 89 72 7 90 72 5 88 72
Table 14: Average cross-validation coverage statistics for procedures, basic blocks, conditional branches and conditional branch edges.
Table 14 represents the average coverage statistics for each of the libraries using the cross-validation
statistics from the previous section. The results shown for each library give the average cross-validation
results for procedures, basic blocks, conditional branches, and conditional branch edges. The results shown
in Table 14 for the percentage of conditional branches, are identical to the average conditional branch
coverage statistics given for each library in Tables 5 through 8. For the percent of procedures in Table 14,
Static-All represents the average percentage of static procedures that are executed in the cross-validation
profile for each program using the library. Static-Cross represents the percentage of those static procedures
that were also executed in the cross-validation profile, and Dynamic represents the dynamic percentage of
procedures executed on average that were also executed in the cross-validation profile.
In summary, these coverage statistics indicate that the collection of programs we examined use only a
[image:25.612.80.539.334.463.2]programs in the cross-validation profiles. Furthermore, the programs use the libraries in a similar fashion,
indicated by the conditional branch coverage and the branch miss rates shown earlier.
5
Implications for Branch Prediction and Profile-based Optimizations
What does all of this information show us? First, realize that the metric we are using is indicative of
common behavior in programs, and indicates that a range of optimizations may be applied. Certainly,
dynamic branch prediction methods result in smaller mispredict rates, but statically predictable execution
can be used for a number of optimizations. Pettis and Hansen [12] and Hwu and Chang [10] both examined
profile optimizations to improve instruction locality. They found both basic block reordering algorithms and
procedure layout algorithms effective at reducing the instruction cache miss rate. In a similar study [3], we
showed that profile-based basic block reordering (Branch Alignment) improved dynamic branch prediction
and eliminated misfetch penalties. Furthermore, Young and Smith [17] have examined static correlated
branch prediction techniques that rely on correlated profile information.
The data presented inx4 illustrates that only a small fraction of branches in any library is used across a
number of programs. Thus, optimizations using profile information to layout basic blocks and procedures
in shared and non-shared libraries should improve the performance of the instruction cache, TLB, virtual
memory and physical memory. Plus, branch prediction techniques that rely on statically classifying branches
and predicting their behavior at compile time can be applied to shared libraries possibly resulting in higher
branch prediction accuracies.
We feel that Table 12 best summarizes the benefits of applying trace scheduling or other profile-directed
optimizations to libraries. The table shows that even if programmers do not profile their own programs,
the overall branch miss rate can be decreased by 7% with very little effort using a profiled pre-optimized
library. The improvement is largest for programs that spend more time in libraries. For example, more than
90% of the conditional branches executed byghostview, xfig andxpaint are captured in profiles
from other programs. These programs show a tremendous improvement in the branch misprediction rate.
Other programs benefit little from profiled libraries, unless the program itself is profiled. This usually occurs
because those programs spend little time in library routines. If programmers profile their programs, but
must use shared libraries, the results of Table 12 indicate that using a profiled pre-optimized shared library
results in performance close to perfect profile prediction accuracy.
Beside the obvious implications for improvements in shared libraries, the fact that library routines can
be accurately predicted by profiles from different applications implies that static branch prediction methods,
such as those of Ball and Larus [1], our own method [4] and related methods [14, 16], can be improved.
Our results indicate several ways to improve the Ball and Larus heuristics for library code, although these
BTFNT B&L ESP Norm Perfect
ESP Study 28.4 22.5 17.6 7.5
[image:27.612.178.437.118.161.2]This Study 24.8 24.2 17.2 7.3
Table 15: Overall miss rates for the 17 programs common between this study and the ESP study. The same inputs were used in both studies for each program.
branches in the program. This points to using a more general technique for heuristic program-based branch
prediction, such as ESP.
Table 15 shows the average results for the ESP study and this study for the 17 programs that are common
between both studies. “BTFNT” represents the miss rate when all branches are predicted using BTFNT,
“B&L” shows the miss rates when the Ball and Larus heuristics are used to predict all conditional branches,
and “ESP” shows the average Evidence-based Static Prediction miss rate [4]. “Norm” shows the miss rate
when the normalized cross-validation profile is used to predict branches in the library, and all non-profiled
branches and the branches in the main program module use B&L heuristic prediction. Therefore, the results
shown for “Norm” are the same as the Non-Profile Programmer results in Table 12, column 3. Finally,
“Perfect” shows the miss rate if perfect profile prediction is used for the whole program.
The differences in the BTFNT, B&L, and Perfect miss rates between these two studies comes from
recompiling the programs for this study in order to use shared libraries, with a newer version of DEC OSF.
The results show that ESP is able to reduce the mispredict rate to 17.6%. Using the normalized
cross-validation profile for predicting library branches and B&L heuristics for the rest of the program’s branches,
a similar miss rate of 17.2% is achieved. This implies that using a profiled pre-optimized library combined
with B&L heuristic prediction can achieve branch miss rates similar to ESP. However, the performance of
ESP may be improved by using profiles to pre-optimize libraries as in this study, and concentrating ESP
features on capturing program-based heuristics for optimizing the program’s main module. This is a topic
of future research.
6
Conclusions
To our knowledge, this work is the first study on common behavior between applications in libraries.
Our results show that only a small portion of each library is used, and that these libraries are used in a
similar fashion between applications. The greatest potential for improved performance is seen for programs
that spend considerable time in libraries, particularly interactive or graphics applications that are more
representative of modern applications. This is only natural, since a rich graphical user interface typically
All results in this study were stated in terms of branch misprediction rates. We felt this would indicate
the likelihood that programs had similar behavior, and would allow comparison to earlier branch prediction
studies. Our results indicate that it would be beneficial to apply profile-directed optimizations to libraries,
in effect providing a pre-optimized library.
Acknowledgments
We would like to thank Alan Eustace and Amitabh Srivastava for providing ATOM, which greatly simplified
our work, and James Larus, David Wall, and the anonymous reviewers for providing useful comments. Brad
Calder was supported by a DEC-WRL summer internship, and an ARPA Fellowship in High Performance
Computing administered by the Institute for Advanced Computer Studies, University of Maryland. This
work was funded in part by NSF grant No. ASC-9217394, ARPA contract ARMY DABT63-94-C-0029 and
a generous equipment and software grant from Digital Equipment Corporation.
References
[1] Thomas Ball and James R. Larus. Branch prediction for free. In Proceedings of the SIGPLAN’93
Conference on Programming Language Design and Implementation, pages 300–313, June 1993.
[2] M. Berry. The Perfect Club Benchmarks: Effective performance evaluation of supercomputers. The
International Journal of Supercomputer Applications, 3(3):5–40, Fall 1989.
[3] Brad Calder and Dirk Grunwald. Reducing branch costs via branch alignment. In Six International
Conference on Architectural Support for Programming Languages and Operating Systems, pages
242–251. ACM, 1994.
[4] Brad Calder, Dirk Grunwald, Donald Lindsay, James Martin, Michael Mozer, and Benjamin Zorn. Corpus-based static branch prediction. In Proceedings of the ACM SIGPLAN Conference on
Program-ming Language Design and Implementation, pages 79–92. ACM, June 1995.
[5] P. P. Chang and W. W. Hwu. Profile-guided automatic inline expansion for C programs. Software
Practice and Experience, 22(5):349–376, 1992.
[6] P. P. Chang, S. A. Mahlke, and W. W. Hwu. Using profile information to assist classic compiler code optimizations. Software Practice and Experience, 21(12):1301–1321, 1991.
[7] Pohua P. Chang, Daniel M. Lavery, Scott A. Mahlke, William Y. Chen, and Wen mei W. Hwu. The importance of prepass code scheduling for superscalar and superpipelined processors. IEEE
Transactions on Computers, 44(3):353–370, 1995.
[8] J. A. Fisher and S. M. Freudenberger. Predicting conditional branch directions from previous runs of a program. In Proceedings of the Fifth International Conference on Architectural Support for
Programming Languages and Operating Systems (ASPLOS-V), pages 85–95, Boston, Mass., October
[9] Richard Hank, Scott Mahlke, Roger Bringmann, John Gyllenhaal, and Wen mei Hwu. Superblock formation using static program analysis. In 26th International Symposium on Microarchitecture, pages 247–256. IEEE, 1993.
[10] Wen-mei W. Hwu and Pohua P. Chang. Achieving high instruction cache performance with an optimizing compiler. In 16th Annual International Symposium on Computer Architecture, pages 242–251. ACM, 1989.
[11] P.Geoffrey Lowney, Sefan M. Freudenberger, Thomas J. Karzes, W.D. Lichtenstein, Robert P. Nix, John S. O’Donnell, and John C. Ruttenberg. The multiflow trace scheduling compiler. Journal of
Supercomputing, 7:51–142, 1993.
[12] Karl Pettis and Robert C. Hansen. Profile guided code positioning. In Proceedings of the ACM
SIGPLAN ’90 Conference on Programming Language Design and Implementation, pages 16–27.
ACM, ACM, June 1990.
[13] Amitabh Srivastava and Alan Eustace. ATOM: A system for building customized program analy-sis tools. In Proceedings of the SIGPLAN’94 Conference on Programming Language Design and
Implementation, pages 196–205. ACM, 1994.
[14] Tim A. Wagner, Vance Maverick, Susan Graham, and Michael Harrison. Accurate static estimators for program optimization. In Proceedings of the SIGPLAN’94 Conference on Programming Language
Design and Implementation, pages 85–96, Orlando, Florida, June 1994. ACM.
[15] David W. Wall. Predicting program behavior using real or estimated profiles. In Proceedings of the
ACM SIGPLAN ’91 Conference on Programming Language Design and Implementation, pages 59–70,
Toronto, Ontario, Canada, June 1991.
[16] Youfeng Wu and James R. Larus. Static branch frequency and program profile analysis. In 27th
International Symposium on Microarchitecture, pages 1–11, San Jose, Ca, November 1994. IEEE.
[17] Cliff Young and Michael D. Smith. Improving the accuracy of static branch prediction using branch correlation. In Six International Conference on Architectural Support for Programming Languages
WRL Research Reports
‘‘Titan System Manual.’’ Michael J. K. Nielsen.
WRL Research Report 86/1, September 1986. ‘‘Global Register Allocation at Link Time.’’ David
W. Wall. WRL Research Report 86/3, October
1986.
‘‘Optimal Finned Heat Sinks.’’ William R. Hamburgen. WRL Research Report 86/4, October 1986.
‘‘The Mahler Experience: Using an Intermediate Language as the Machine Description.’’ David
W. Wall and Michael L. Powell. WRL Research Report 87/1, August 1987.
‘‘The Packet Filter: An Efficient Mechanism for User-level Network Code.’’ Jeffrey C. Mogul,
Richard F. Rashid, Michael J. Accetta. WRL
Research Report 87/2, November 1987.
‘‘Fragmentation Considered Harmful.’’ Christopher
A. Kent, Jeffrey C. Mogul. WRL Research Report 87/3, December 1987.
‘‘Cache Coherence in Distributed Systems.’’
Christopher A. Kent. WRL Research Report 87/4, December 1987.
‘‘Register Windows vs. Register Allocation.’’ David
W. Wall. WRL Research Report 87/5, December
1987.
‘‘Editing Graphical Objects Using Procedural Representations.’’ Paul J. Asente. WRL Research Report 87/6, November 1987.
‘‘The USENET Cookbook: an Experiment in Electronic Publication.’’ Brian K. Reid. WRL Research Report 87/7, December 1987.
‘‘MultiTitan: Four Architecture Papers.’’ Norman
P. Jouppi, Jeremy Dion, David Boggs, Michael J. K. Nielsen. WRL Research Report 87/8, April
1988.
‘‘Fast Printed Circuit Board Routing.’’ Jeremy Dion. WRL Research Report 88/1, March 1988.
‘‘Compacting Garbage Collection with Ambiguous Roots.’’ Joel F. Bartlett. WRL Research Report 88/2, February 1988.
‘‘The Experimental Literature of The Internet: An Annotated Bibliography.’’ Jeffrey C. Mogul.
WRL Research Report 88/3, August 1988. ‘‘Measured Capacity of an Ethernet: Myths and
Reality.’’ David R. Boggs, Jeffrey C. Mogul,
Christopher A. Kent. WRL Research Report 88/4, September 1988.
‘‘Visa Protocols for Controlling Inter-Organizational Datagram Flow: Extended Description.’’
Deborah Estrin, Jeffrey C. Mogul, Gene Tsudik, Kamaljit Anand. WRL Research Report 88/5, December 1988.
‘‘SCHEME->C A Portable Scheme-to-C Compiler.’’
Joel F. Bartlett. WRL Research Report 89/1, January 1989.
‘‘Optimal Group Distribution in Carry-Skip Ad-ders.’’ Silvio Turrini. WRL Research Report 89/2, February 1989.
‘‘Precise Robotic Paste Dot Dispensing.’’ William
R. Hamburgen. WRL Research Report 89/3, February 1989.
‘‘Simple and Flexible Datagram Access Controls for Unix-based Gateways.’’ Jeffrey C. Mogul.
WRL Research Report 89/4, March 1989.
‘‘Spritely NFS: Implementation and Performance of Cache-Consistency Protocols.’’ V. Srinivasan and Jeffrey C. Mogul. WRL Research Report
89/5, May 1989.
‘‘Available Instruction-Level Parallelism for Super-scalar and Superpipelined Machines.’’ Norman
P. Jouppi and David W. Wall. WRL Research
Report 89/7, July 1989.
‘‘A Unified Vector/Scalar Floating-Point Architec-ture.’’ Norman P. Jouppi, Jonathan Bertoni,