ORIGINAL RESEARCH
ADULT BRAIN
Thalamic Iron Differentiates Primary-Progressive and
Relapsing-Remitting Multiple Sclerosis
XA. Burgetova,X P. Dusek,XM. Vaneckova,XD. Horakova,X C. Langkammer,XJ. Krasensky,XL. Sobisek,XP. Matras, XM. Masek, andXZ. Seidl
ABSTRACT
BACKGROUND AND PURPOSE: Potential differences between primary progressive and relapsing remitting multiple sclerosis are the subject of ongoing controversial discussions. The aim of this work was to determine whether and how primary-progressive and relapsing-remitting multiple sclerosis subtypes differ regarding conventional MR imaging parameters, cerebral iron deposits, and their association with clinical status.
MATERIALS AND METHODS:We analyzed 24 patients with primary-progressive MS, 80 with relapsing-remitting MS, and 20 healthy controls with 1.5T MR imaging for assessment of the conventional quantitative parameters: T2 lesion load, T1 lesion load, brain parenchymal fraction, and corpus callosum volume. Quantitative susceptibility mapping was performed to estimate iron concentration in the deep gray matter.
RESULTS:Decreased susceptibility within the thalamus in relapsing-remitting MS compared with primary-progressive MS was the only significant MR imaging difference between these MS subtypes. In the relapsing-remitting MS subgroup, the Expanded Disability Status Scale score was positively associated with conventional parameters reflecting white matter lesions and brain atrophy and with iron in the putamen and caudate nucleus. A positive association with putaminal iron and the Expanded Disability Status Scale score was found in primary-progressive MS.
CONCLUSIONS: Susceptibility in the thalamus might provide additional support for the differentiation between primary-progressive and relapsing-remitting MS. That the Expanded Disability Status Scale score was associated with conventional MR imaging parameters and iron concentrations in several deep gray matter regions in relapsing-remitting MS, while only a weak association with putaminal iron was observed in primary-progressive MS suggests different driving forces of disability in these MS subtypes.
ABBREVIATIONS:BPF⫽brain parenchymal fraction; CCV⫽corpus callosum volume; CN⫽caudate nucleus; DGM⫽deep gray matter; EDSS⫽Expanded Disability Status Scale; GP⫽globus pallidus; HC⫽healthy controls; Put⫽putamen; QS⫽quantitative susceptibility; QSM⫽quantitative susceptibility mapping; PPMS⫽primary-progressive multiple sclerosis; RRMS⫽relapsing-remitting multiple sclerosis; RREM⫽relapsing-remitting EDSS-matched group; T1LL⫽T1 lesion load;
T2LL⫽T2 lesion load
P
athologic cerebral iron accumulation in multiple sclerosis is a consistent finding in MR imaging and neuropathologicstud-ies. Abnormal iron deposits were detected particularly in the deep gray matter (DGM)—that is, in the putamen, caudate nucleus (CN), and globus pallidus (GP) with iron-sensitive MR imaging techniques such as R2* relaxometry, magnetic field correlation imaging, phase imaging, and quantitative susceptibility mapping (QSM).1-8Neuropathologic studies in MS confirmed increased
iron content in both glial cells and neurons in DGM associated with degenerative changes,9while overall iron loss was observed
in normal-appearing white matter.10An increase in iron
concen-tration appears to be an early phenomenon, with the highest amounts of accumulation occurring during the transitions from clinically isolated syndrome to definite MS.11
Received August 25, 2016; accepted after revision January 26, 2017.
From the Departments of Radiology (A.B., M.V., J.K., P.M., M.M., Z.S.) and Neurology (P.D., D.H.), Center of Clinical Neuroscience, First Faculty of Medicine, Charles Uni-versity and General UniUni-versity Hospital in Prague, Prague, Czech Republic; Institute of Neuroradiology (P.D.), University Medicine Go¨ttingen, Go¨ttingen, Germany; Department of Neurology (C.L.), Medical University of Graz, Graz, Austria; and De-partment of Statistics and Probability (L.S.), University of Economics, Prague, Czech Republic.
This study was supported by the grants RVO VFN64165, 15-25602A Czech Ministry of Health, and GA CR 16-03322S. L.S. was supported by the Faculty of Informatics and Statistics, University of Economics, Prague.
Please address correspondence to Andrea Burgetova, MD, Department of Radiology, First Faculty of Medicine, Charles University and General University Hospital in Prague, Katerinska 30, 128 08 Prague 2, Czech Republic; e-mail: [email protected]
Indicates open access to non-subscribers at www.ajnr.org
Indicates article with supplemental on-line tables.
Indicates article with supplemental on-line photos.
Currently, little information is available on the differences in iron content in various MS subtypes. Primary-progressive MS (PPMS) is a subtype characterized by a steady progression with-out relapses and worse response to immunosuppressant drugs. It has been postulated that underlying mechanisms and measures of disability progression in PPMS may be different from those in relapsing-remitting MS (RRMS). In particular, inflammation may be less prominent compared with neurodegeneration in the PPMS subtype. However, neuroimaging studies supporting this theory are lacking. It remains unclear whether PPMS and RRMS subtypes differ in iron accumulation in the DGM. Differences in demographic and clinical data cause difficulties in the compari-son of these 2 subtypes. PPMS affects older age groups than RRMS, with a peak incidence in the fifth and sixth decades; the male-to-female ratio is typically 1:1 compared with 1:3 reported in most RRMS trials. Additionally, the Expanded Disability Status Scale (EDSS) score is higher in patients with PPMS than in those with RRMS, with the same disease duration indicating faster dis-ease progression in PPMS.12
The primary goal of this study was to compare iron content and conventional MR imaging parameters such as T2 lesion load (T2LL), T1 lesion load (T1LL), brain parenchymal fraction (BPF), and corpus callosum volume (CCV) in RRMS and PPMS. We were particularly interested in whether these MS subtypes differ in iron concentration and whether iron accumulation has a different impact on disability in PPMS compared with RRMS. From several MR imaging– based techniques enabling the assessment of iron concentration in the brain,13we chose quantitative susceptibility
mapping (QSM). Postmortem validation studies have demon-strated that QSM in the DGM is tightly correlated with iron con-centration.14QSM has been shown to correlate with R2 and R2*
relaxometry, but compared with these techniques, it does not re-quire multiecho data, has a higher dynamic range, and might be more sensitive to smaller tissue-susceptibility changes.15-18
The secondary goal was to investigate the correlation between quantitative MR imaging parameters and clinical disability mea-sured by the EDSS in both MS subtypes.
MATERIALS AND METHODS
Research Subjects
Twenty-four patients with PPMS, 20 age- and sex-matched healthy controls (HC), and 303 patients with RRMS were inves-tigated. Patients with RRMS and PPMS were diagnosed according to the clinical classification of Lublin et al.19Of the total 28
pa-tients with PPMS from the data base of our MS center, 4 papa-tients were excluded due to contraindications to MR imaging, refusal to participate in this study, moving away, and incomplete set of data, respectively. Patients with RRMS who had routine MR imaging examinations from September 2013 to September 2015 were asked to participate in this study; 303 patients were investigated. From the whole sample of 303 patients with RRMS, 2 groups have been identified by distributional matching to the PPMS group by using the MatchIt Library (Version 2.4 –21),20as implemented in
the R Statistical and Computing Software (http://www.r-projec-t.org/). The first RRMS group consisting of 80 patients was ob-tained by matching RRMS to PPMS according to age and sex. The second RRMS group was obtained by an independent procedure
of matching RRMS to PPMS according to age, sex, and EDSS score. This additional EDSS matching, performed to control for higher disease severity in the PPMS group, yielded a group of 40 patients, referred to as RREDSS-Matched(RREM); RRMS and RREM groups are partially overlapping with 29 patients included in both groups. Seventy-nine percent of patients from the RRMS group, 75% from the RREMgroup, and 29% from the PPMS group were on a long-term MS-specific treatment (On-line Table 1). Written informed consent was obtained from all patients, and the research was approved by the local medical ethics committee at First Fac-ulty of Medicine, Charles University and General University Hos-pital in Prague, Czech Republic.
MR Imaging Acquisition and Image Processing
The examinations were performed by using a 1.5T MR imaging system (Gyroscan NT; Philips Healthcare, Best, the Netherlands); a standard quadratic head coil was used. The protocol included FLAIR (150 axial sections, TR⫽1000 ms, TE⫽140 ms, TI⫽ 2600 ms, spatial resolution⫽1⫻1⫻1 mm3, scan duration⫽10 minutes 16 seconds), T1-weighted imaging (fast-field echo/3D, 150 axial sections, TR⫽25 ms, TE⫽5.01 ms, spatial resolution⫽ 1⫻1⫻1 mm3, scan duration⫽12 minutes 48 seconds), and susceptibility-weighted imaging (fast-field echo/3D, 100 axial sec-tions, TR⫽48.1 ms, TE⫽33.2 ms, spatial resolution⫽0.8⫻ 0.8⫻2.0 mm3, scan duration⫽6 minutes 30 seconds) pulse sequences.
Automated volumetric image analysis was performed with the in-house-developed ScanView software (http://www.scanview.cz/) as described previously.21-23In brief, after standard image
pro-cessing, image signal intensity was normalized (peak⫽10,000, WM⫽5000 artificial units) and the volume of T2 lesions (T2LL) was measured in homogenized and filtered FLAIR images as the area exceeding 140% of the WM intensity and the size of 11 voxels. Next, T2 hyperintensities were transformed to the T1-weighted image and the volume of hypointensities (T1LL) was calculated as the area with signal below 70% of the WM. In addition, the num-ber of thalamic lesions was counted by a single rater on FLAIR images. BPF (volume of the brain parenchyma divided by the volume of the brain parenchyma and CSF space) and CCV were measured on the T1-weighted image. For CCV measurement, transversal sections were reconstructed to the sagittal plane. After smoothing and edge-enhancing, we applied filters and the area of the corpus callosum was outlined automatically on 7 sections, including the midsagittal section and 3 adjacent sections to the left and to the right. The resulting areas bounded by the curve were then recorded in all 7 sagittal reconstructions, and average value was calculated. The corpus callosum volume was calculated as mean area multiplied by the total thickness of 7 sections.
The reproducibility of T1LL, T2LL, BPF, and CCV measure-ments was evaluated by using MR imaging data of 164 patients with MS who were examined every 8 weeks throughout 1 year. Interclass correlation coefficients of 2 measurements performed within 8 weeks were 0.9983 for T1/T2LL, 0.9920 for BPF, and 0.9985 for CCV. The estimated reproducibility error of the auto-matic WM lesion segmentation algorithm was calculated to be 10% for small lesions (⬍1 cm3) and 2%–3% for larger lesions.
variation method as previously described.24Briefly, the
recon-struction consisted of Laplacian unwrapping, background field removal, and dipole inversion by using the total generalized vari-ation regularizvari-ation in a single integrated step. Susceptibility was measured in the following ROIs: CN, putamen (Put), GP, and thalamus. ROIs were determined by using automated segmenta-tion of the T1-weighted image with FreeSurfer, Version 4.5 (http://surfer.nmr.mgh.harvard.edu/). QSM images were rigidly aligned with the T1-weighted images, and subsequently regional median susceptibilities in parts per billion were measured (Fig. 1). To check the performance of the automatic segmentation al-gorithm, we compared it with manual segmentation, which was considered ground truth. The extent of spatial overlap between the manual and automatic segmentations was evaluated by using comparative DICE scores. The CN, Put, GP, and thalamus out-lines were manually segmented by a single rater in 3 randomly selected healthy subjects by using ITK-SNAP software (www. itksnap.org/).25The CN and Put were segmented on T1-weighted
image; the GP and thalamus were segmented while simultane-ously using coregistered T1-weighted and QSM images. The mean comparative DICE scores (1.0 is perfect alignment) were 0.76 (range, 0.71– 0.80) for the CN, 0.79 (range, 0.79 – 0.80) for the Put, 0.74 (range, 0.68 – 80) for the GP, and 0.79 (range, 0.77– 0.81) for the thalamus.
Because thalamic iron distribution is inhomogeneous, we have additionally performed manual segmentation of the entire tha-lamic outline and pulvinar outline in all subjects with QSM and T1-weighted images. Consequently, susceptibility in parts per bil-lion was measured in the thalamus, pulvinar, and thalamus with-out the pulvinar.
Statistical Analysis
We usedttests or nonparametric Mann-WhitneyUtests with a nonpooled SD to compare between-group differences in mean or median values of demographic, clinical, and MR imaging charac-teristics and median susceptibilities. Age was used as a covariate in the analysis to correct for age-related increases in cerebral iron concentration.26The Benjamini-Hochberg procedure withP⬍
.05 was used to minimize the false discovery rate. The relations between EDSS and MR imaging metrics within each group were investigated by the Spearman correlation coefficient.
Addition-ally, interaction analysis by using the multivariate general linear model was performed to examine whether the association be-tween conventional MR imaging parameters and susceptibility in DGM nuclei differs by MS subtype. Interaction between MR im-aging parameters and EDSS by MS subtype was also tested. Thus, patients were categorized into 1 of 4 classes according to EDSS category and MS subtype (ie, PPMS with EDSSⱕ4, PPMS with EDSS ⬎ 4, RRMS with EDSS ⱕ 4, RRMS with EDSS ⬎ 4). ANOVA and pairedttests were used to compare differences in means of MR imaging parameters among these subgroups. All analyses were performed with the statistical software R (www. r-project.org/); reportedPvalues are 2-tailed.
RESULTS
Clinical and Conventional MR Imaging Parameters: Comparison of RRMS, PPMS, and Controls
MR imaging metrics in RRMS were compared with those in the PPMS and HC groups. The clinical disability (EDSS) distribution of patients with RRMS differs significantly from that in patients with PPMS (P ⬍.001). The PPMS group was, therefore, also compared with the RREMMS subgroup, consisting of 40 patients matched for EDSS scores. Subject demographic and clinical data and comparison of conventional MR imaging parameters among RRMS, PPMS, and HC are listed inTable 1. The PPMS group showed significantly higher T1LL (P⫽.023) relative to the RRMS group, while no significant differences were found between PPMS and RREMMS groups in conventional MR imaging metrics.
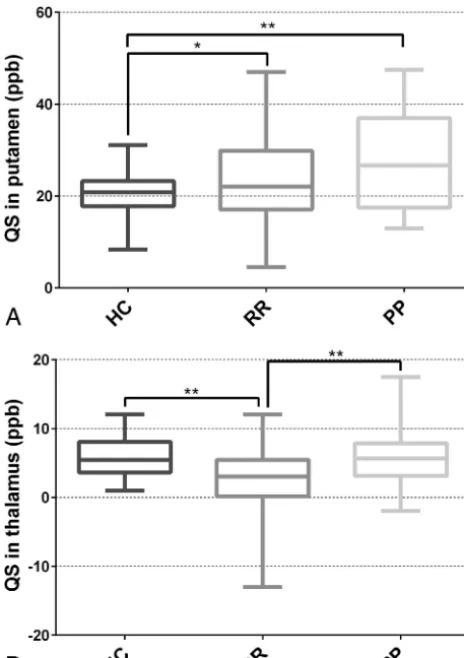
Comparison of Susceptibility among MS Subtypes and HC
[image:3.594.56.531.47.207.2]because a single thalamic lesion was present in only 9 patients with RRMS (11%) and 3 with PPMS (12.5%).
Results from manual segmentation of the entire thalamus con-firmed these findings, showing significantly lower QS values in RRMS compared with PPMS (P⫽.026) and a trend toward lower values in RRMS compared with HC (P⫽.057). When we ana-lyzed thalamic substructures, the difference in QS among RRMS, PPMS, and HC groups was most pronounced in the thalamus without the pulvinar; in this region lower QS values were found in
RRMS compared with HC (P ⫽ .035) and PPMS (P ⫽.035) groups. No significant differences were found in the pulvinar (RRMS versus HC,P⫽.28; RRMS versus PPMS,P⫽.28) (On-line Table 2 and On-(On-line Fig 1).
Correlations of QS Values with Conventional MR Imaging Metrics
In the RRMS group, we identified negative correlations between QS values in the thalamus and T2LL as well as T1LL and a positive correlation with BPF and CCV. In the PPMS group, QS values did not correlate with any conventional MR imaging parameter (Table 3).
Interaction analysis between each combination of dependent (QS in CN, GP, Put, thalamus) and independent (T1LL, T2LL, BPF, CCV) variables in PPMS and RRMS confirmed significant interaction between MS subtypes and the T1LL/T2LL effect on thalamic QS (P⬍.05). In the RRMS group, a strong negative linear relationship between T1LL/T2LL and QS in the thalamus was detected, while no such relationship was observed in the PPMS group (On-line Table 3 and On-line Fig 2).
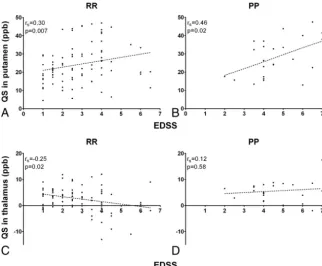
Association between MR Imaging Metrics and Disability (EDSS) in MS Subtypes
In RRMS, the EDSS score was associated with all conventional MR imaging parameters: T1LL, T2LL, BPF, and CCV (Table 4). The strongest association was found for T1LL (Spearman cor-relation coefficient⫽0.458,P⬍.0001). In addition, we iden-tified a positive association between EDSS and QS values in the putamen (Fig 3A) and the CN. A negative association between the EDSS score and thalamic QS values was observed in the RRMS group (Fig 3C). In contrast, no association was found between the EDSS score and conventional MR imaging param-eters in the PPMS group; there was only a positive association between EDSS and putaminal QS values observed in this group (Fig 3B,-D).
[image:4.594.67.531.59.166.2]Interaction analysis comparing patients with EDSSⱕ4 and EDSS⬎4 in each MS subtype confirmed significant differences in mean thalamic susceptibility between RRMS with greater EDSS scores and PPMS regardless of EDSS scores (P⬍.001) (On-line Tables 4 and 5). Statistical differences in T1LL and T2LL were observed only between RRMS with greater EDSS scores and Table 1: Demographic and clinical data and conventional MRI metrics in HC, RRMS, RREM, and PPMS groupsa
HC 20 (8/12)
RRMS 80 (32/48)
RREMMS 40
(16/24)
PPMS 24 (9/15)
PValueb
PPMS vs RRMS (RREM)
HC vs RRMS (RREM)
HC vs PPMS
Age (yr) 48.0 (7.3) 46.9 (7.0) 48.6 (7.0) 47.4 (6.8) .72 (.72) .72 (.72) .72
Disease duration (yr) – 12.4 (10.7) 13.2 (11.0) 7.7 (3.3) .006c(.006)c – –
EDSSd – 2.5 (2.5) 4 (0.6) 4.5 (1.6) ⬍.001c(.173) – –
T1LLd – 1.1 (1.1) 1.4 (1.6) 1.8 (3.3) .023c(.276) – –
T2LLd – 2.1 (4.9) 3.6 (7.2) 2.8 (10.6) .431 (.923) – –
BPF (%) 86.2 (1.5) 84.2 (2.4) 83.8 (2.4) 84.7 (3.0) .490 (.490) ⬍.001 (⬍.001) .08
CCV (cm3) 4.6 (0.6) 4.1 (0.7) 4.0 (0.7) 4.1 (0.8) .690 (.690) .004 (.001) .013
Note:— – indicates not relevant. a
The number of participants and the female/male ratio are reported for each group. Unless otherwise indicated, data are reported as mean (SD). Numbers in parentheses in the headers of columns 2–5 are No. of subjects in groups (F/M).
b
Pair-wise comparison (Pvalue). Differences among HC, PPMS, and RRMS (RREM) groups were tested using attest or Mann-WhitneyUtest with nonpooled SD (Benjamini-Hochberg correction).
c Significant.
dMann-WhitneyUtest with nonpooled SD (Benjamini-Hochberg correction) (median and interquartile range).
[image:4.594.52.284.241.570.2]RRMS with lower EDSS scores (P⫽.004,P⫽.027, respectively) (On-lineTables 4, 6, and 7).
DISCUSSION
Comparing iron concentration in DGM between PPMS and RRMS subtypes, we identified QS values in the thalamus as the only significant difference between age- and sex-matched RRMS and PPMS groups. EDSS was associated with conventional MR imaging parameters, indicating disease severity in the RRMS group. Additionally, the EDSS score was positively associated with iron concentration in the putamen and CN and negatively associated with thalamic iron. No associations between EDSS and conventional MR imaging metrics were found in the PPMS group.
Previous MR imaging studies detected similarities but also several differences between PPMS and RRMS. Lesion morphol-ogy (iron deposition, the presence of the central vein), lesion count, and the proportion of cortical-to-total lesion counts were
similar in PPMS and RRMS groups.27In PPMS, more diffuse
abnormalities in the brain and spinal cord along with smaller caudate volume were apparent compared with RRMS.28 In
PPMS, clinicoradiologic correlation was weak for cerebral T1LL/ T2LL but was stronger between spinal cord symptoms and spinal cord MR imaging parameters.29,30
In MS, increased iron levels seem to be already present in the clinically isolated syndrome group, and further buildup can be observed in the early stage after the transition to RRMS.16,31,32We
confirmed significantly increased iron content in the putamen in both MS subtypes compared with HC, in agreement with previ-ous studies.4,6,7,33-35 While iron concentration was increased
within the basal ganglia in patients with RRMS, the opposite (ie, lower iron concentration) was found in the thalamus. This result is consistent with findings in several previous MR R2* relaxom-etry studies showing lower thalamic iron in MS compared with HC.6,7 On the contrary, other MR imaging studies with R2*,
QSM, magnetic field correlation imaging, or phase imaging showed no significant difference1,36or even higher iron
concen-tration in the thalamus in patients with RRMS.2,8,37,38
The cause of these contradictory findings is not clear. Because the disease duration of the RRMS group included in our study was rather long compared with other studies and thalamic iron con-tent was negatively correlated with EDSS, one can speculate that iron may accumulate in the early MS stage, while its concentration may decrease in the later stage of the disease. However, another study indicated that the loss of thalamic iron in MS has already begun in patients with clinically isolated syndrome with further decrease after the conversion to definite MS.11In normal aging,
total thalamic iron shows a very different pattern from that in all other DGM structures, with an accumulation until the fourth decade, followed by a mild decrease.26A histochemical study has
[image:5.594.53.533.59.126.2]shown that iron distribution in the thalamus is uneven, with the Table 2: Quantitative susceptibility within deep GM structuresa
DGM Structure
QS (ppb) HC RRMS RREMMS PPMS
Pair-wise Comparison (PValue)b
PPMS vs RRMS (RREM) HC vs RRMS (RREM) HC vs PPMS
CN 32.6 (9.5) 35.0 (9.6) 38.3 (10.1) 36.8 (6.8) .390 (.470) .390 (.230) .230
GP 66.7 (8.5) 71.9 (14.0) 72.4 (14.1) 70.8 (13.0) .860 (.860) .170 (.170) .420
Put 20.3 (5.4) 24.3 (10.7) 27.7 (10.3) 28.1 (10.5) .158 (.899) .042c(.003)c .009c
Thal 5.9 (3.3) 2.6 (4.9) 2.0 (5.7) 5.6 (3.9) .007c(.007)c .004c(.004)c .757
Note:—Thal indicates thalamus. a
All values are means (SD).
bPair-wise comparisons (Pvalue) were tested usingttests with nonpooled SD (Benjamini-Hochberg correction). c
[image:5.594.53.533.181.311.2]Significant.
Table 3: Correlations of QS values in DGM with conventional MRI parameters in the RRMS and PPMS groups
DGM Region
T1LL T2LL BPF CCV
rs PValue rs PValue rs PValue rs PValue
RRMS
CN ⫺0.09 .44 ⫺0.07 .56 ⫺0.01 .96 ⫺0.05 .63
GP 0.02 .85 0.07 .53 ⫺0.00 .99 ⫺0.10 .37
Put 0.14 .23 0.12 .30 ⫺0.20 .08 ⫺0.21 .06
Thal ⫺0.36 .001a ⫺0.35 .001a 0.23 .04a 0.25 .02a
PPMS
CN ⫺0.13 .55 ⫺0.16 .46 0.05 .80 0.02 .93
GP 0.07 .75 0.09 .69 ⫺0.03 .86 0.06 .79
Put 0.25 .25 0.36 .09 ⫺0.28 .18 ⫺0.16 .47
Thal ⫺0.04 .85 0.03 .90 0.14 .52 0.11 .60
Note:—rsindicates Spearman correlation coefficient; Thal, thalamus. aSignificant.
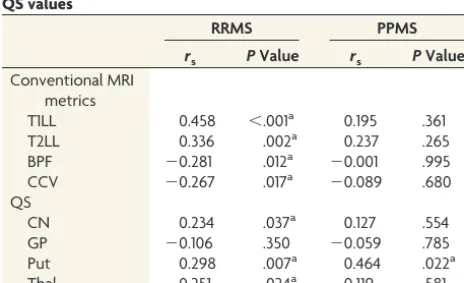
Table 4: Associations of EDSS with conventional MRI metrics and QS values
RRMS PPMS
rs PValue rs PValue
Conventional MRI metrics
T1LL 0.458 ⬍.001a 0.195 .361
T2LL 0.336 .002a 0.237 .265
BPF ⫺0.281 .012a ⫺0.001 .995
CCV ⫺0.267 .017a ⫺0.089 .680
QS
CN 0.234 .037a 0.127 .554
GP ⫺0.106 .350 ⫺0.059 .785
Put 0.298 .007a 0.464 .022a
Thal ⫺0.251 .024a 0.119 .581
Note:—Thal indicates thalamus. a
[image:5.594.53.285.354.495.2]anterior nuclear group, dorsomedial group, and pulvinar having the highest iron reactivity.39It is thus possible that the temporal
pattern of iron concentration change in individual thalamic nu-clei is different. Indeed, a cross-sectional MR imaging study with R2* and QSM showed that iron in the thalamic pulvinar may increase with aging, while there was no age-related change in other thalamic nuclei.40In our study, the difference in thalamic
QS values between RRMS on one hand and PPMS and HC on the other hand was mostly driven by variance in thalamic nuclei be-yond the pulvinar, which is suggestive of diffuse iron loss within the thalamus.
Thalamic QS values in the PPMS group were significantly higher compared with the RRMS group; this finding indicates different regulation of thalamic iron concentration in these MS subtypes. However, the causes and consequences of different tha-lamic iron levels in RRMS and PPMS cannot be clarified from this cross-sectional study design. QS values in the thalamus were neg-atively correlated with T2LL and T1LL and with EDSS in the RRMS groups; this finding suggests an association between de-creasing thalamic iron concentration and inde-creasing WM impair-ment. This association between thalamic susceptibility and EDSS was not observed in the PPMS group. Susceptibility decrease may be due to lower (paramagnetic) iron or higher (diamagnetic) my-elin content.14,41Higher myelin content is not plausible in the
context of MS; thus, our finding of negative thalamic susceptibil-ity values in patients with RRMS and higher EDSS scores is rather consistent with the loss of iron content. Moreover, the T2LL in the thalamus, which could potentially affect susceptibility, was very
low, and the difference in lesion count was insignificant in the RRMS and PPMS groups.
When we investigated the conven-tional MR imaging metrics, T1LL was higher in the PPMS compared with the RRMS group. This T1LL difference could be related to higher clinical sever-ity in the PPMS group, and it was not observed when patients with PPMS and RRMS were matched for EDSS scores. T1 hypointense lesions often represent the final destructive tissue changes, and T1LL may better correlate with disease progression and disability.42Di Perri et
al43have shown that T1LL was similar in
PPMS and RRMS subtypes matched for disease duration. However, the T1LL-to-T2LL ratio, along with clinical dis-ability, was significantly higher in PPMS compared with RRMS. In other studies, on the contrary, the incidence of all brain lesion types has been reported to be reduced and brain atrophy increased in patients with PPMS compared with other MS subtypes, though there is a wide variability.12,29,44-46The low
num-ber of patients with PPMS in our study and in other studies precludes firm conclusions, and further studies with larger PPMS cohorts are needed.
Examining associations between clinical severity and MR imaging parameters in the PPMS group, we only found a positive associa-tion between EDSS and iron concentraassocia-tion in the putamen. The correlation between iron concentration in the putamen and CN and clinical severity is well-established in MS,47,48and it appears
to be invariable regardless of the clinical subtype. Ropele et al4
included 7 patients with PPMS and 7 with secondary-progressive MS, in addition to 83 with RRMS in their cohort. They identified the EDSS score as an independent predictor of iron accumulation in the DGM. However, the results were likely driven by RRMS, while there were a limited number of patients with PPMS and SPMS.4No significant association between conventional MR
im-aging metrics and EDSS has been detected in PPMS, which is consistent with findings in previous studies.43,49In RRMS, there
was a correlation between EDSS and conventional MR imaging parameters, which reflects WM lesions and brain atrophy. The correlation of EDSS with T1LL was stronger than with T2LL. These findings are in the line with previous studies23,42,50-55
showing that T1LL and T2LL provide a useful marker for disease progression and long-term therapeutic effect in RRMS.
To our best knowledge, this is the first study comparing iron concentration in DGM and its correlations with EDSS score be-tween PPMS and RRMS subtypes. However, there are some lim-itations. Our PPMS group was rather small, and no MR imaging data were collected from the spinal cord, which could also con-tribute to the explanation of clinical disability. Cross-sectional FIG 3. The relationship between clinical disability and quantitative susceptibility values in the
[image:6.594.55.378.47.313.2]design provides no information regarding the temporal dynamics of iron accumulation. Future work using a larger PPMS cohort in a longitudinal setting is needed. Likewise, spinal cord pathology, iron deposition within WM, and demyelinating lesions should be the focus of further investigations.
CONCLUSIONS
Our findings support the concept that PPMS is a part of the MS disease spectrum, not a separate entity. When patients with RRMS are matched to those with PPMS for age, sex, and EDSS, these groups do not differ regarding conventional MR imaging metrics. Decreased susceptibility within the thalamus was the only signif-icant MR imaging difference between PPMS and RRMS groups, suggesting different thalamic iron metabolism according to the underlying MS subtype.
On the other hand, there are significant differences in the ex-tent of correlation of MR imaging parameters and clinical severity between PPMS and RRMS subtypes. In RRMS, EDSS is signifi-cantly associated with conventional parameters and, additionally, with iron concentration in the striatum. In contrast, no associa-tion was found in PPMS, except a weak correlaassocia-tion with putami-nal iron. These findings suggest that different driving forces of disability take effect in RRMS and PPMS subtypes.
Disclosures: Andrea Burgetova—RELATED:Grant: RVO VFN64165 (Czech Ministry of Health),Comments: Money went to the institution and a part of it to me*. Petr Dusek—RELATED:Grant: Czech Ministry of Health, 15–25602A. Manuela Vaneckova—RELATED:Grant: Czech Ministries of Health, RVO-VFN64165*; UNRELAT-ED:Consultancy: Biogen Idec, Novartis, Merck Serono, Teva Pharmaceutical Indus-tries;Payment for Lectures Including Service on Speakers Bureaus: Biogen Idec, Novartis, Merck Serono, Teva Pharmaceutical Industries;Travel/Accommodations/ Meeting Expenses Unrelated to Activities Listed: Biogen Idec, Genzyme. Dana Hora-kova—UNRELATED:Consultancy: Biogen Idec, Sanofi-Genzyme;Grants/Grants Pending: grants GA CR 16 – 03322S and PRVOUK P26/LF1/4*;Payment for Lectures Including Service on Speakers Bureaus: Biogen Idec, Novartis, Merck, Bayer Health-Care Pharmaceuticals, Sanofi-Genzyme, and Teva Pharmaceutical Industries. Jan Krasensky—RELATED:Grant:Ministry of Health, RVO-VFN-64165*;UNRELATED: Travel/Accommodations/Meeting Expenses Unrelated to Activities Listed: Biogen Idec, Novartis. Lukas Sobisek—RELATED:Grant: Czech Ministry of Education project PRVOUK-P26/LF1/4;Other: Novartis;UNRELATED:Employment: University of Eco-nomics in Prague,Comments: assistant in Department of Statistics and Informatics. Zdenek Seidl—RELATED:Grant: Ministry of Health, RVO-VFN64165.* *Money paid to the institution.
REFERENCES
1. Raz E, Branson B, Jensen JH, et al.Relationship between iron accu-mulation and white matter injury in multiple sclerosis: a case-con-trol study.J Neurol2015;262:402– 09CrossRef Medline
2. Cobzas D, Sun H, Walsh AJ, et al.Subcortical gray matter segmen-tation and voxel-based analysis using transverse relaxation and quantitative susceptibility mapping with application to multiple sclerosis.J Magn Reson Imaging2015;42:1601–10CrossRef Medline
3. Stankiewicz JM, Neema M, Ceccarelli A.Iron and multiple sclerosis.
Neurobiol Aging2014;35(suppl 2):S51–58CrossRef Medline
4. Ropele S, Kilsdonk ID, Wattjes MP, et al.Determinants of iron ac-cumulation in deep grey matter of multiple sclerosis patients.Mult Scler2014;20:1692–98CrossRef Medline
5. Ropele S, de Graaf W, Khalil M, et al.MRI assessment of iron depo-sition in multiple sclerosis.J Magn Reson Imaging2011;34:13–21
CrossRef Medline
6. Khalil M, Langkammer C, Ropele S, et al.Determinants of brain iron in multiple sclerosis: a quantitative 3T MRI study.Neurology2011; 77:1691–97CrossRef Medline
7. Burgetova A, Seidl Z, Krasensky J, et al.Multiple sclerosis and the accumulation of iron in the basal ganglia: quantitative assessment
of brain iron using MRI t(2) relaxometry.Eur Neurol2010;63: 136 – 43CrossRef Medline
8. Ge Y, Jensen JH, Lu H, et al.Quantitative assessment of iron accu-mulation in the deep gray matter of multiple sclerosis by magnetic field correlation imaging.AJNR Am J Neuroradiol2007;28:1639 – 44
CrossRef Medline
9. Haider L, Simeonidou C, Steinberger G, et al.Multiple sclerosis deep grey matter: the relation between demyelination, neurodegenera-tion, inflammation and iron.J Neurol Neurosurg Psychiatry2014;85: 1386 –95CrossRef Medline
10. Hametner S, Wimmer I, Haider L, et al.Iron and neurodegeneration in the multiple sclerosis brain.Ann Neurol2013;74:848 – 61CrossRef Medline
11. Khalil M, Langkammer C, Pichler A, et al.Dynamics of brain iron levels in multiple sclerosis: a longitudinal 3T MRI study.Neurology 2015;84:2396 – 402CrossRef Medline
12. Antel J, Antel S, Caramanos Z, et al.Primary progressive multiple sclerosis: part of the MS disease spectrum or separate disease entity?
Acta Neuropathol2012;123:627–38CrossRef Medline
13. Dusek P, Dezortova M, Wuerfel J.Imaging of iron.Int Rev Neurobiol 2013;110:195–239CrossRef Medline
14. Langkammer C, Schweser F, Krebs N, et al.Quantitative suscep-tibility mapping (QSM) as a means to measure brain iron? A post mortem validation study.Neuroimage2012;62:1593–99CrossRef Medline
15. Schmalbrock P, Prakash RS, Schirda B, et al.Basal ganglia iron in patients with multiple sclerosis measured with 7T quantitative sus-ceptibility mapping correlates with inhibitory control.AJNR Am J Neuroradiol2016;37:439 – 46CrossRef Medline
16. Al-Radaideh AM, Wharton SJ, Lim SY, et al.Increased iron accumu-lation occurs in the earliest stages of demyelinating disease: an ul-tra-high field susceptibility mapping study in clinically isolated syndrome.Mult Scler2013;19:896 –903CrossRef Medline
17. Wang Y, Liu T.Quantitative susceptibility mapping (QSM): decod-ing MRI data for a tissue magnetic biomarker.Magn Reson Med 2015;73:82–101CrossRef Medline
18. Schweser F, Deistung A, Lehr BW, et al.Differentiation between diamagnetic and paramagnetic cerebral lesions based on mag-netic susceptibility mapping. Med Phys 2010;37:5165–78 CrossRef Medline
19. Lublin FD, Reingold SC, Cohen JA, et al.Defining the clinical course of multiple sclerosis: the 2013 revisions.Neurology2014;83:278 – 86
CrossRef Medline
20. Ho DE, Imai K, King G, et al.MatchIt: nonparametric preprocessing for parametric causal inference.J Stat Soft2011;42:1–28
21. Horakova D, Kalincik T, Dolezal O, et al.Early predictors of non-response to interferon in multiple sclerosis.Acta Neurol Scand2012; 126:390 –97CrossRef Medline
22. Kalincik T, Vaneckova M, Tyblova M, et al.Volumetric MRI markers and predictors of disease activity in early multiple sclerosis: a lon-gitudinal cohort study.PLoS One2012;7:e50101CrossRef Medline
23. Vaneckova M, Kalincik T, Krasensky J, et al. Corpus callosum atrophy: a simple predictor of multiple sclerosis progression— a longitudinal 9-year study. Eur Neurol2012;68:23–27 CrossRef Medline
24. Langkammer C, Bredies K, Poser BA, et al.Fast quantitative suscep-tibility mapping using 3D EPI and total generalized variation. Neu-roimage2015;111:622–30CrossRef Medline
25. Yushkevich PA, Piven J, Hazlett HC, et al.User-guided 3D active contour segmentation of anatomical structures: significantly im-proved efficiency and reliability. Neuroimage 2006;31:1116 –28
CrossRef Medline
26. Hallgren B, Sourander P.The effect of age on the non-haemin iron in the human brain.J Neurochem1958;3:41–51CrossRef Medline
27. Kuchling J, Ramien C, Bozin I, et al.Identical lesion morphology in primary progressive and relapsing-remitting MS: an ultrahigh field MRI study.Mult Scler2014;20:1866 –71CrossRef Medline
corre-lates of cognitive performance differ between relapsing-remitting and primary-progressive multiple sclerosis. PLoS One 2015;10: e0129380CrossRef Medline
29. Galego O, Gouveia A, Batista S, et al.Brain atrophy and physical disability in primary progressive multiple sclerosis: a volumetric study.Neuroradiol J2015;28:354 –58CrossRef Medline
30. Nijeholt GJ, van Walderveen MA, Castelijns JA, et al.Brain and spi-nal cord abnormalities in multiple sclerosis: correlation between MRI parameters, clinical subtypes and symptoms. Brain 1998; 121(pt 4):687–97CrossRef Medline
31. Hagemeier J, Heininen-Brown M, Poloni GU, et al.Iron deposition in multiple sclerosis lesions measured by susceptibility-weighted imaging filtered phase: a case control study.J Magn Reson Imaging 2012;36:73– 83CrossRef Medline
32. Quinn MP, Gati JS, Klassen ML, et al.Increased deep gray matter iron is present in clinically isolated syndromes.Mult Scler Relat Dis-ord2014;3:194 –202CrossRef Medline
33. Hammond KE, Metcalf M, Carvajal L, et al.Quantitative in vivo magnetic resonance imaging of multiple sclerosis at 7 Tesla with sensitivity to iron.Ann Neurol2008;64:707–13CrossRef Medline
34. Khalil M, Enzinger C, Langkammer C, et al.Quantitative assessment of brain iron by R(2)* relaxometry in patients with clinically iso-lated syndrome and relapsing-remitting multiple sclerosis.Mult Scler2009;15:1048 –54CrossRef Medline
35. Zivadinov R, Heininen-Brown M, Schirda CV, et al.Abnormal sub-cortical deep-gray matter susceptibility-weighted imaging filtered phase measurements in patients with multiple sclerosis: a case-con-trol study.Neuroimage2012;59:331–39CrossRef Medline
36. Du S, Sah SK, Zeng C, et al.Iron deposition in the gray matter in patients with relapse-remitting multiple sclerosis: a longitudinal study using three-dimensional (3D)-enhanced T2*-weighted an-giography (ESWAN). Eur J Radiol 2015;84:1325–32 CrossRef Medline
37. Hagemeier J, Yeh EA, Brown MH, et al.Iron content of the pulvinar nucleus of the thalamus is increased in adolescent multiple sclero-sis.Mult Scler2013;19:567–76CrossRef Medline
38. Modica CM, Zivadinov R, Dwyer MG, et al.Iron and volume in the deep gray matter: association with cognitive impairment in multiple sclerosis. AJNR Am J Neuroradiol 2015;36:57– 62
CrossRef Medline
39. Morris CM, Candy JM, Oakley AE, et al.Histochemical distribution of non-haem iron in the human brain.Acta Anat (Basel) 1992;144: 235–57CrossRef Medline
40. Acosta-Cabronero J, Betts MJ, Cardenas-Blanco A, et al.In vivo MRI mapping of brain iron deposition across the adult lifespan.J Neu-rosci2016;36:364 –74CrossRef Medline
41. Fukunaga M, Li TQ, van Gelderen P, et al.Layer-specific variation of iron content in cerebral cortex as a source of MRI contrast.Proc Natl Acad Sci U S A2010;107:3834 –39CrossRef Medline
42. Truyen L, van Waesberghe JH, van Walderveen MA, et al. Accumu-lation of hypointense lesions (“black holes”) on T1 spin-echo MRI correlates with disease progression in multiple sclerosis.Neurology 1996;47:1469 –76CrossRef Medline
43. Di Perri C, Battaglini M, Stromillo ML, et al.Voxel-based assessment of differences in damage and distribution of white matter lesions between patients with primary progressive and relapsing-remitting multiple sclerosis.Arch Neurol2008;65:236 – 43Medline
44. Miller DH, Leary SM.Primary-progressive multiple sclerosis. Lan-cet Neurol2007;6:903–12CrossRef Medline
45. Stevenson VL, Miller DH, Rovaris M, et al.Primary and transitional progressive MS: a clinical and MRI cross-sectional study.Neurology 1999;52:839 – 45CrossRef Medline
46. Thompson AJ, Montalban X, Barkhof F, et al.Diagnostic criteria for primary progressive multiple sclerosis: a position paper.Ann Neu-rol2000;47:831–35Medline
47. Zhang Y, Metz LM, Yong VW, et al.3T deep gray matter T2 hypoin-tensity correlates with disability over time in stable relapsing-re-mitting multiple sclerosis: a 3-year pilot study.J Neurol Sci2010; 297:76 – 81CrossRef Medline
48. Tjoa CW, Benedict RH, Weinstock-Guttman B, et al.MRI T2 hypoin-tensity of the dentate nucleus is related to ambulatory impairment in multiple sclerosis.J Neurol Sci2005;234:17–24CrossRef Medline
49. Ruggieri S, Petracca M, Miller A, et al.Association of deep gray mat-ter damage with cortical and spinal cord degeneration in primary progressive multiple sclerosis. JAMA Neurol 2015;72:1466 –74
CrossRef Medline
50. Bergsland N, Horakova D, Dwyer MG, et al.Subcortical and cortical gray matter atrophy in a large sample of patients with clinically isolated syndrome and early relapsing-remitting multiple sclerosis.
AJNR Am J Neuroradiol2012;33:1573–78CrossRef Medline
51. Bermel RA, Bakshi R.The measurement and clinical relevance of brain atrophy in multiple sclerosis.Lancet Neurol2006;5:158 –70
CrossRef Medline
52. Bodini B, Battaglini M, De Stefano N, et al.T2 lesion location really matters: a 10-year follow-up study in primary progressive multiple sclerosis. J Neurol Neurosurg Psychiatry 2011;82:72–77 CrossRef Medline
53. Ciccarelli O, Brex PA, Thompson AJ, et al.Disability and lesion load in MS: a reassessment with MS functional composite score and 3D fast FLAIR.J Neurol2002;249:18 –24CrossRef Medline
54. Kearney H, Rocca MA, Valsasina P, et al.Magnetic resonance imag-ing correlates of physical disability in relapse onset multiple sclero-sis of long disease duration.Mult Scler 2014;20:72– 80CrossRef Medline
55. Zivadinov R, Stosic M, Cox JL, et al.The place of conventional MRI and newly emerging MRI techniques in monitoring different as-pects of treatment outcome. J Neurol 2008;255(suppl 1):61–74