RESEARCH ARTICLE LIVER CIRRHOSIS, IMAGING VALUES
*
Dr. Marwa Khalid Taha Al_Ameen
Radiologist Specialist
ARTICLE INFO ABSTRACT
Early diagnosis of liver cirrhosis is important. Ultrasound
diagnosis of liver cirrhosis. However, its invasiveness and sampling bias limit the applicability of the method. Basic imaging for the diagnosis of liv
enabling early detection of morphological changes of the liver by ultrasonography (US), computed tomography, and magnetic resonance imaging (MRI). They are also accurate diagnostic methods for advanced
compensate for this difficulty, including texture analysis to more closely identify hepatic parenchyma, elastography
studies to determine the blood flow volume, transit time, and velocity. Amongst these methods, elastography using US and MRI was found to be slightly easier, faster, and able to provide a accurate diagnosis. Early diagnosis of liver cirrhosis using MRI or US elastography is therefore a realistic alternative, but further research is still
Copyright © 2019Dr. Marwa Khalid Taha Al_Ameen
unrestricted use, distribution, and reproduction in any medium,
INTRODUCTION
Liver cirrhosis is the end stage of chronic liver disease. It is caused by diffuse fibrosis and regenerating nodules that result from recurrent necrosis of liver cell and degeneration. It is recognized as an irreversible form of parenchymal fibrosis. Liver cirrhosis reduces hepatic function and results in multiple complications induced by nodular regeneration and portal hypertension, including ascites, variceal bleeding, renal failure due to hepatorenal syndrome, hepatic encephalopathy, and spontaneous bacterial peritonitis. In addition, the incidence of hepatocellular carcinoma is sharply increased. Recently, early liver cirrhosis was shown to be improved by regression of collagen tissue (Massarrat et al., 2004). Regression is usually associated with the improvement of clinical status, but can vary in the degree of improvement, depending on the reversibility of liver damage. Extensive scarring with parenchymal destruction is unlikely to regress. Therefore, early diagnosis of liver cirrhosis and quantification of the proportion of fibrosis in the liver are very important in the management of chronic liver disease. Prognosis and management of chronic liver diseases hinge strongly on the amount and progression of liver
(Ghany et al., 2009; Castera, 2011). there are a variety of causes of liver cirrhosis, with alcohol consumption, viruses, and fatty liver disease making up the majority of factors.
*Corresponding author: Dr. Marwa Khalid Taha Al_Ameen
Radiologist Specialist, Institute of Radiology, Mosul, Iraq
ISSN: 0975-833X
Article History:
Received 07th October, 2018
Received in revised form 29th November, 2018 Accepted 09th December, 2018
Published online 31st January, 2019
Citation: Dr. Marwa Khalid Taha Al_Ameen. 2019. “Research article liver Key Words:
Liver Fibrosis, Liver Cirrhosis, Portal Venous Hypertention, Liver Nodules, HCC., Elastography
RESEARCH ARTICLE
RESEARCH ARTICLE LIVER CIRRHOSIS, IMAGING VALUES
Dr. Marwa Khalid Taha Al_Ameen
Radiologist Specialist, Institute of Radiology, Mosul, Iraq
ABSTRACT
Early diagnosis of liver cirrhosis is important. Ultrasound-guided liver biopsy is the gold standard for diagnosis of liver cirrhosis. However, its invasiveness and sampling bias limit the applicability of the method. Basic imaging for the diagnosis of liver cirrhosis has developed over the last few decades, enabling early detection of morphological changes of the liver by ultrasonography (US), computed tomography, and magnetic resonance imaging (MRI). They are also accurate diagnostic methods for advanced liver cirrhosis, for which early diagnosis is difficult. There are a number of
compensate for this difficulty, including texture analysis to more closely identify
hepatic parenchyma, elastography to measure the stiffness and elasticity of the liver, and perfusion studies to determine the blood flow volume, transit time, and velocity. Amongst these methods, elastography using US and MRI was found to be slightly easier, faster, and able to provide a accurate diagnosis. Early diagnosis of liver cirrhosis using MRI or US elastography is therefore a realistic alternative, but further research is still needed.
Dr. Marwa Khalid Taha Al_Ameen. This is an open access article distributed under the Creative Commons medium, provided the original work is properly cited.
Liver cirrhosis is the end stage of chronic liver disease. It is caused by diffuse fibrosis and regenerating nodules that result from recurrent necrosis of liver cell and degeneration. It is recognized as an irreversible form of parenchymal fibrosis. cirrhosis reduces hepatic function and results in multiple complications induced by nodular regeneration and portal hypertension, including ascites, variceal bleeding, renal failure due to hepatorenal syndrome, hepatic encephalopathy, and erial peritonitis. In addition, the incidence of hepatocellular carcinoma is sharply increased. Recently, early liver cirrhosis was shown to be improved by regression of . Regression is usually provement of clinical status, but can vary in the degree of improvement, depending on the reversibility of liver damage. Extensive scarring with parenchymal destruction is unlikely to regress. Therefore, early diagnosis of liver n of the proportion of fibrosis in the liver are very important in the management of chronic liver disease. Prognosis and management of chronic liver diseases hinge strongly on the amount and progression of liver fibrosis . there are a variety of causes of liver cirrhosis, with alcohol consumption, viruses, and fatty liver disease making up the majority of factors.
Dr. Marwa Khalid Taha Al_Ameen,
Mosul, Iraq.
These various etiologies induce chronic inflammation. Normal lobular architecture of the liver parenchyma is replaced by a parenchymal nodule surrounded by the fibrous tissue. Portal central septa, connecting the portal vein and central vei develop. As the inflammation persists, various form of fibrosis develops. The gross morphologic appearance of a cirrhotic liver is categorized by the size of the parenchymal nodules: micronodular, macronodular, or mixed. Micronodular cirrhosis is characterized by regenerative nodules of relatively uniform and small size. This pattern is seen in chronic alcoholic, hepatitis C, and biliary cirrhosis. In macronodular cirrhosis, the parenchymal nodules are larger, and more variable in size. Chronic hepatitis B is the most common
cirrhosis (Ishak et al., 1995)
Classification
Morphological cassification (Friedman
Micronodular cirrhosis:
nodules up to 3mm m diameter associated with septa of approximately equal width (up to 2
Macronodular: Characterized
many greater than 3mm and some as large as 3cm or more associated with irregular septa of varying (often broad).
Mixed: Both small and large nodule are
International Journal of Current Research
Vol. 11, Issue, 01, pp.780-786, January, 2019
DOI: https://doi.org/10.24941/ijcr.34096.01.2019
Research article liver cirrhosis, imaging values”, International Journal of Current Research
RESEARCH ARTICLE LIVER CIRRHOSIS, IMAGING VALUES
guided liver biopsy is the gold standard for diagnosis of liver cirrhosis. However, its invasiveness and sampling bias limit the applicability of the er cirrhosis has developed over the last few decades, enabling early detection of morphological changes of the liver by ultrasonography (US), computed tomography, and magnetic resonance imaging (MRI). They are also accurate diagnostic methods for liver cirrhosis, for which early diagnosis is difficult. There are a number of ways to compensate for this difficulty, including texture analysis to more closely identify the homogeneity of to measure the stiffness and elasticity of the liver, and perfusion studies to determine the blood flow volume, transit time, and velocity. Amongst these methods, elastography using US and MRI was found to be slightly easier, faster, and able to provide an accurate diagnosis. Early diagnosis of liver cirrhosis using MRI or US elastography is therefore a
Commons Attribution License, which permits
These various etiologies induce chronic inflammation. Normal lobular architecture of the liver parenchyma is replaced by a parenchymal nodule surrounded by the fibrous tissue. Portal-central septa, connecting the portal vein and Portal-central vein,
inflammation persists, various form of fibrosis develops. The gross morphologic appearance of a cirrhotic liver is categorized by the size of the parenchymal nodules: micronodular, macronodular, or mixed. Micronodular cirrhosis terized by regenerative nodules of relatively uniform and small size. This pattern is seen in chronic alcoholic, hepatitis C, and biliary cirrhosis. In macronodular cirrhosis, the parenchymal nodules are larger, and more variable in size. B is the most common cause of macronodular
Friedman et al., 1987)
Micronodular cirrhosis: Has approximately equal sized nodules up to 3mm m diameter associated with septa of approximately equal width (up to 2 mm).
Characterized by variably sized nodules many greater than 3mm and some as large as 3cm or more associated with irregular septa of varying width
small and large nodule are present.
INTERNATIONAL JOURNAL OF CURRENT RESEARCH
Aetiological classification (Sherlock, 1987)
Viral hepatitis. Type B; C
Alcohol
Metabolic e.g haemochromatosis, wilson s disease and, anti-trypsin deficiency, diabetes mellitus Type 17 glycogenosis, galactosaemia.
prolonged cholestasis : intra and extra-hepatic.
Hepatic venous out flow obstruction e.g veno-occlusive disease.
Disturbed immunity.
Toxin and theraputic agent e.g methotrexate.
Intestinal bypass.
Indian childhood cirrhosis.
On the other hand, liver cirrhosis is classified according to the main location of fibrosis occurrence. A portal-based pattern usually results from hepatitis B and C, autoimmune hepatitis, Wilson’s disease, primary biliary cirrhosis, primary sclerosing cholangitis, recurrent pyogenic cholangitis, and hemochromatosis. Conversely, a centrizonal fibrosis pattern results from alcoholic and nonalcoholic steatohepatitis or chronic venous outflow obstruction.
There are differences in the grading and scoring of fibrosis by microscopic pathology according to the cirrhosis pattern. The METAVIR score (F0: no fibrosis, F1: portal fibrosis without bridging fibrosis, F2: portal fibrosis with few bridging fibrosis, F3: bridging fibrosis with architectural distortion, F4: cirrhosis) and the Ishak score (grades four categories of activity/necrosis, 0-4 or 0-6) are commonly used systems for grading or staging. The METAVIR score is simple, reproducible, and clinically validated, while the Ishak score is generally considered to be unnecessarily complex but preferred in many clinical trials.
Ultrasonic examination of Liver Cirrhosis: A diagnosis of cirrhosis made with ultrasound is based on hepatic and extrahepatic sign. Extrahepatric sign (Such as splenomegaly, ascitis, or sign of portal hypertension) are a consequence of cirrhosis but these sign are common to other disease. Liver cirrhosis is characterized by changes in liver volume distribution, surface nodularity, accentuation of the fissure, heterogeneity, bright and coarsening of the hepatic architecture, cirrhotic nodules including regenerative and dysplastic nodules, and signs of portal hypertension.
Studies showed an overall sensitivity to chronic liver disease of 65%- 95%, with a positive predictive value of 98%(8-10).The most indicative finding of liver cirrhosis was nodular surface, which was moe sensitive on the undersurface of the liver than the superior surface (86% vs 53%) Figure 1. It was also more sensitive in a high frequency probe (Colli et al., 2003; Viganò et al., 2005; Soresi et al., 2014). Although any single US feature had limited sensitivity or specificity in detecting cirrhosis, improvements could be achieved by combining two or three parameters.
Hepatic sign
Hepatomegaly
This sign did not correlate well with cirrhosis, it is present in similar percentage of the cirrhotic and non-cirrhotic patients (Di Lelio, 1989). In the earlier stages Liver size either enlarged or normal.
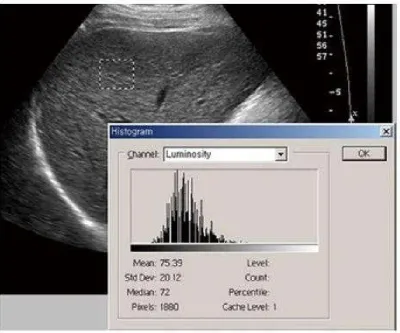
A small shrunken liver is seen only in advanced cases of cirrhosis (Friedman, 1987). It is found that Liver measuring 13.0 cm or less in the mid hepatic line regarded as normal, and those measuring 15.5 cm or greater are enlarged (Gosink, 1988). The parenchyma of the normal liver demonstrates a homogenous moderately echogenic pattern equal to or slightly less echogenic than the pancreas and more echogenic than normal renal cortical tissue.The increased parenchymal echogenicity in cirrhosis can be explained by collagen and or fat deposition. An initial study performed a simple quantification of parenchymal echogenicity and compared the standard deviation between chronic liver disease and normal liver (Figure (Figure2) (Hartman, 1993; Lee, 2006).
Increased ultrasonic attenuation: The coarseness of hepatic parenchyma decreased beam penetration, while the attenuation of echogenicity according to depth increased proportionally to fibrosis. Methods that were more delicate were also introduced. Measurement of differences in echogenicity between neighboring pixels can be pathologically correlated to chronic liver disease (Li et al., 2006).
C- Bright liver echo pattern: It has been recognized for some years that in cirrhosis high amplitude echoes may be returned from the liver giving rise to a bright liver echo pattern. In study (67) patients with proven cirrhosis who had liver biopsy and an ultrasound examination within three months of one anther. In 43 patients cirrhosis was suggested by recognition of a bright liver echo pattern. In 23 patients the Liver echo pattern was normal these results are recorded in table 1
In the first group of 43 patients. About 50% of the patients had micronodular cirrhosis, 10% macronodular cirrhosis, 30% showed evidence of fatty change, 15% evidence of piece meal necrosis. In the 2nd group of 23 patients with cirrhosis, the liver echo pattern was considered within normal limits. In this group 66% of patient had a macronodular cirrhosis, 50% of patients showing evidence of piece meal necrosis, only 15% showed a micronodular cirrhosis and 15% some fatty changes. These findings are compared with the findings in the first group in Table II. We have shown that ultrasound will indicate the presence of cirrhosis in 65% of an unselected series, by the recognition of a characteristic bright liver echo pattern. In cases of micronodular cirrhosis, Ultrosound is likely to detect about 80% of patients, and in macronodular cirrhosis only 20% of patients. Both fibrous tissue and fatty tissue can give rise to high amplitude echoes and so give a bright liver picture. The reason that this does not occur in all cases of cirrhosis remains unresolved (Dewbury, 1979).
Surface Nodularity: The normal appearance of the liver surface is seen as a hyperechoic straight line not more than 1mm thick and without sign of irregularity. In cirrhosis, Surface irregularities are seen due to nodular regeneration, the size of nodules can be measured and cirrhosis classified as micronodular or macronodular according to the size of the nodules (smaller than or larger than 3 mm respectively. The hyperechoic line of the liver surface is interupted like a dotted line dotted line sign) this is mainly seen with micronodular cirrhosis (Di Lelio, 1989) Characteristic findings of liver cirrhosis in ultrasound are nodular Liver surface, round edge, and hypoechoic nodules in liver parenchyma which represent regenerative nodules of cirrhotic liver.
Detection of hypoechoic nodule more than 10mm is important in the early diagnosis of hepatocellular carcinoma (Matsutani, 1994).
Caudate to Right Lobe Ratio - Using The Main Portal Vein C/RL (MPV):Compared to normal liver the right lobe contribute much less and the caudate lobe relatively more to the total transvers diameter of the level of the main portal vein. In addition, the porta hapatis (the transverse fissure of the liver) appears widened in many cases of cirrhosis (Harbin, 1980).
* C/RL (MPV):
Caudate: Distance from the lateral margin of the main portal vein to the outside of caudate.
Right Hobe: distance from Rt lateral margin to the lateral edge of main portal vein.
Ratio: Caudate measurement divided by right lobe measurement (Mittelstaedt, 1989)
If the C/RL ratio is greater than 0.65, cirrhosis can be diagnosed with 96% confidence, if the ratio is greater than 0.73 cirrhosis can be diagnosed with 99% confidence, and if less than 0.6 cirrhosis is unlikely (Harbin, 1980)
Increased fasting gall bladder volume: Mean fasting gall bladder volume is significantly higher in cirrhotic patients than in patients with non cirrhotic liver disease. There is no relationship between gall bladder volume and clinical and biological test parameters except for decrease prothrombin time (Rector, 1986).
Ultrasonic Signs of Portal Hypertension: Real- time ultrasound has made it possible to evaluate the portal vein rapidly, reliably and non invasively. It is possible to identify portal hypertension befor it has clinically manifested (Mittelstaedt et al., 1989).
Enlargment of the portal vein and its tributaries: It has been asserted that a portal vein diameter larger than 13 mm in diameter is characteristic of portal hypertension (normal portol vein diameter have been reported in the range of 0.64 - 1.21 cm). Portal vein diameter being Larger in patient with demonstrable porto systemic collateral vessels than in those without these vessels (Friedman, 1987; Rector, 1986).
Attenuation of the normal inspiratory increase in vein size :
Normally inspiratory diminution or arrest of splanchnic flow occurs as a result of diaphragmatic compression by the liver and the splanchnic veins enlarge. These phenomenon is reduced or absent altogether in patients with chronic liver disease, and it is found to be more pronounced in the splenic and superior mesenteric veins than in the portal vein (Rector, 1986).
Gall bladder wall thickening (Congestive cholecystopathy):
Wall thickness 4mm or greater is considered abnormal. It is found that portal hypertension is the dominant factor causing gall bladder wall thickening in cirthosis and ultrasound demonstration of gall bladder wall thickening in chronic liver disease should suggest the presence of portal hypertension (Saverymuttu, 1990).
Thickened stomach (congestive gastropathy) : It occurs with portal hypertension and is associated with vascular changes
including dilatation and tortuosity of the submucous veins. Transabdominal US measurements of the stomach were made to determine whether these changes resulted in increased thickness of the stomach in patient with established cirrhosis and portal hypertension. Mean thickness of the antrum and body was 22.15mm and 22.2 mm respectively in patients with portal hypertension. In the control group measurements of the antrum and body were 13.8 mm and 14.05 mm respectively. A thickened stomach may indicate the presence of portal hypertension (Saverymuttu, 1990).
In cirrhosis, Doppler waves of the hepatic vein show spectral broadening and hepatic vein narrowing. Phasic oscillations in hepatic venous flow are dampened. Normal phasicity of the hepatic vein represents a pressure change in the right atrium through the cardiac cycle. However, phasicity of the hepatic vein is reduced in liver cirrhosis, a result of decreased hepatic compliance and venous segments narrowed by adjacent regenerative nodules (Sharma, 2010). The portal vein is initially dilated over 1.4 cm in diameter, but the emergence of the bypass collateral vessels changes hepatofugal blood flow and decreases the portal vein diameter to less than 1 cm. The hepatic artery has a high resistive index, but the development of a large arteriovenous shunt or arterioportal shunt leads to lower resistance (Kok et al., 1999; Yin et al., 2001; Bernatik et al., 2002). US elastography is now widely recognized as a reliable method to assess liver fibrosis. The principle of elastography is the shearing of the examined tissue, which induces a smaller strain in hard tissues than in soft ones. There are several commercial types of US elastography currently in use: transient elastography (TE), acoustic radiation force impulse imaging (ARFI), Supersonic shear wave imaging (SSI), and real-time tissue elastography. TE is performed with the Fibroscan™ (Echosens, Paris, France) which comprises of an ultrasound transducer probe located on the axis of a vibrator. The vibrator makes a vibration, which leads to an elastic shear wave propagating to the liver. The shear wave velocity (expressed in kiloPascals-kPa) is directly related to the stiffness of the tissue (Sandrin et al., 2003). At present, TE is the most widely used method for the liver fibrosis assessment. TE has been validated in various chronic liver diseases including chronic hepatitis B and C, nonalcoholic fatty liver disease (Friedrich-Rust, 2008; Sporea et al., 2010; Riggio et al., 2010; Chon et al., 2012). However, it has several limitations; the rate of unreliable measurements is reached up to 20% and the rate of reliable measurements decreased in obese patients and it cannot be performed in patients with ascites (Castéra et al., 2010).
The boundary between fibrosis and normal parenchyma was more ambiguous in a contrast-enhanced scan (Figure (Figure3). Therefore, it is difficult to perform texture analysis using CT. Considering the fact that the CT contrast agent is an extracellular space contrast agent, texture analysis is a method of measuring the decrease of the extracellular space fraction. When liver cirrhosis progress is enforced experimentally, there is a high correlation with the fibrosis grade, though this has not been proven clinically (Kudo et al., 2008). Image of liver cirrhosis caused by chronic hepatitis B. Contrast enhanced computed tomography portal phase image shows the liver with irregular surface and heterogeneous enhancement of
[image:4.595.73.535.61.244.2] [image:4.595.103.504.282.615.2]parenchyma with reticular pattern suggesting confluent fibrosis. The image shows decreased diameter of portal vein (arrow) due to large collateral vessels (arrow head) and also shows large amount of ascites. A caudate lobe to right lobe size ratio has been proposed as an accurate objective means of diagnosing cirrhosis on either ultrasound and CT (Harbin, 1980). The increase in size of the caudate lobe relative to the right lobe is due to both enlargement of the caudate and fibrotic shrinkage of the right lobe. The enlarged caudate can cause constriction of the inferior vena cava which may be contributory to the development of ascites and hepatorenal syndrom, the hepatic artery and portal veins supplying the
Figure 1. Transaxial scan. A: Transaxial epigastric scan shows the left lobe of the liver with surface irregularity (arrows), and coarse parenchyma echotexture; B: Subcostal transaxial scan shows the inferior margin of right hepatic lobe with irregular surface (arrows)
Figure 2. The region of interest of texture analysis is positioned in the right lobe of the liver, with an intercostals scan performed with gray scale ultrasonography. Chronic liver disease patient shows heterogeneous parenchymal echogenecity
with high standard deviation value (Area: 1880 pixels, Mean: 75.39, SD: 20.12)
Figure 3. Image of liver cirrhosis caused by chronic hepatitis B. Contrast enhanced computed tomography portal phase image shows the liver with irregular surface and heterogeneous enhancement of parenchyma with reticular pattern suggesting confluent fibrosis. The image shows
decreased diameter of portal vein (arrow) due to large collateral vessels (arrow head) and also shows large amount of ascites
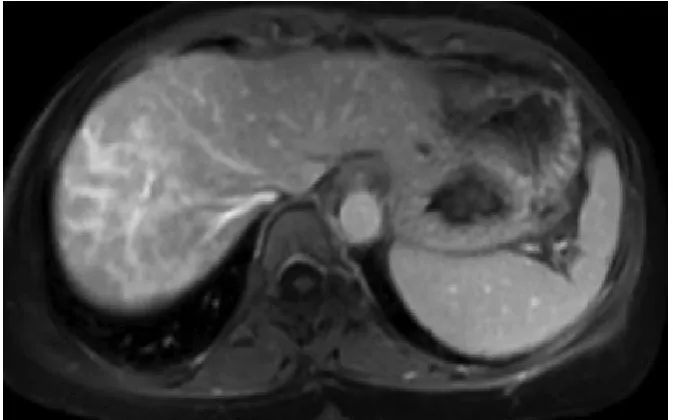
Figure 4. Images show progressive geographic enhancement radiating from the hepatic hilum to the liver capsule, consistent with confluent fibrosis
Table 1. Ultrasound in the diagnosis of cirrhosis
1- Bright echo pattern 43 patients (65%)
2- Normal echo pattem 23 patients (35%)
3- Other echo pattern l patient
[image:5.595.128.465.357.567.2]Total 67 Patients
Table 2. Comparison of pathological findings
Selected features Patients with bright Pattern exhibiting each feature % (Group 1-43 Patients)
Patients with normal Pattern exhibiting each feature,%(Group 2-23 Patients)
micronodular cirrhosis 50 15
macronodular cirrhosis 10 66
Piece meal necrosis 15 50
[image:5.595.99.492.724.785.2]caudat lobe have a shorter intrahepatic course than those supplying the right lobe and therefore undergo less distortion by cirrhosis, explaining the relative preservation and even hypertrophy of the caudate lobe in cirrhosis. Caudate lobe enlargement is absent early in cirrhosis and roughly parallels the degree of cirrhosis thereafter (Harbin, 1980). Additional features seen on CT in cirrhosis are ascites splenomegaly and evidence of portosystemic collateral circulation..CT during arterial portography is the most reliable imaging modality for the differentiation of small liver cancer from adenomatous hyperplastic nodule. In this modality, AHNS are not visualized because of the existence of portal blood flow in the lesion in distinct contrast to small liver cancers which are shown as areas of low attenuation due to their lack of portal flow (Matsui, 1989). CT in Portal Hypertension: The collateral circulation in portal hypertension can be evaluated by CT Portal and / or splenic vein enlargement is easily detected, periportal collaterals are depicted as numerous worm - like enhancing veins, traversing the porta hepatis. Esophageal and / or gastric varices can be suggested on CT when marked contrast enhancement is seen in the thickened wall of the appropriate viscus. It is appropriate to consider the possibility of portal hypertension when CT of the thorax incidentally shows marked enhancement of the esophageal wall (Ishikawa, 1980). Porto systemic collaterals are tortuous, tubular or rounded soft tissue attenuation masses on unenhanced scans, and scans after bolus injection of contrast often necessary to confirm their vascular nature. Azygos, hemiazygos, and para esophageal collaterals can mimic mediastinal masses, and retroperitoneal varices can mimic adenopathy or renal / adrenal masses (Ishikawa, 1980). Perfusion CT had several limitations. It suffered from the classic CT limitations: radiation, the use of iodinated contrast agents and limited scan coverage range
(Ronot et al., 2010). However, new technological developments have reduced the scanning time and increased the detector size, enabling a reduction in the dose of radiation and expanding the scanning range.
MRI Of Liver Cirrhosis: MRI has several advantages over other imaging techniques, including high-resolution images with excellent contrast against other soft tissue lesions and a number of different techniques facilitating the diagnostic evaluation of organ morphology, physiology, and function. As it is dependent on the detection of alterations in hepatic morphology, conventional MRI is limited to the diagnosis of earlier stages of liver fibrosis and is not suitable for disease staging(38). Normally the hepatic parenchyma has moderate intensity with gray back ground, against this gray back ground, normal vessels (hepatic and portal vein)are depicted as low intensity structures because of their flowing blood. Tl is dependent on field strength, it has been reported from 155-397 ms.T2 of the liver is relatively independent of field strength and has been reported from 40-96 ms (Friedman, 1987).
Enhancement Characteristics: Benign Enhancement Characteristics. In the setting of cirrhosis, fibrosis is typically demonstrated as progressive enhancement that peaks during the late venous/equilibrium phases. There is typically minimal or no enhancement during arterial or early venous phase imaging. Fibrosis may present as enhancing septa and bridges, or demonstrate a more confluent pattern. Confluent fibrosis is more common in alcohol-related cirrhosis as compared to viral liver disease. It appears as wedge-shaped, geographic areas of enhancement with straight or concave borders that radiate from the portal hilum to the liver surface, often resulting in
retraction of the adjacent hepatic capsule figure 4 (Faria et al., 2009).
Nodules and Malignant Finding: Regarding imaging characteristics, regenerating nodules are typically isointense compared to adjacent liver parenchyma on unenhanced T1- weighted MR images(39) Occasionally, however, they can be hyperintense on T1 sequences. On T2-weighted imag- ing, the nodules are often hypointense secondary to iron deposition. After the administration of extracellular contrast agents, regenerative nodules usually enhance to the same degree or slightly less compared to adjacent liver parenchyma (Choi, 2014). Dysplastic nodules are iso- to hyperintense on T1 and iso- to hypointense on T2 sequences. The increased T1 signal intensity results from fat or copper deposition or tumoral bleeding. This T1 hyperintensity can be seen in either dysplastic nodules or HCC. Rarely, dysplastic nodules are hyperintense on T2 sequences, also making it difficult to distinguish them from HCC, which also generally demonstrates increased T2 signal. Most dysplastic nodules have relatively normal arterial supply; therefore, they are isointense to the liver parenchyma in the late arterial phase (Choi, 2014)
Occasionally, a high-grade dysplastic nodule can show hyperenhancement in the arterial phase, as would be seen with HCC. However, dysplastic nodules usually do not demonstrate the typical washout pattern or have a capsule, as is seen in HCC. Magnetic resonance elastography (MRE) is an emerging technique that noninvasively quantifies liver stiffness by analyzing the propagation of mechanical waves through liver tissue. It is based on the concept that the stiffness of the hepatic parenchyma is increased as fibrosis advances. One study showed that MRE has a high sensitivity and specificity in detecting liver fibrosis, with a predicted sensitivity and specificity of 91% and 97% for liver fibrosis ≥ stage F2, respectively; 92% and 95% for liver fibrosis ≥ stage F3, respectively; and 95% and 87% for liver fibrosis ≥ stage F4, respectively (Wang et al., 2011). MRE can be easily added to standard abdominal MRI protocols, promising value added in staging liver cirrhosis.
REFERENCES
18-Harbin WP, Robert NJ. 1980. Diagnosis of Cirrhosis based on regional changes in hepatic morphology. radiology. 135, 273- 282.
Bernatik T., Strobel D., Hahn EG., Becker D. 2002. Doppler measurements: a surrogate marker of liver fibrosis? Eur J
Gastroenterol Hepatol., 14:383–387.
Castera L. 2011. Invasive and non-invasive methods for the assessment of fibrosis and disease progression in chronic liver disease. Best Pract Res Clin Gastroenterol., 25:291– 303.
Castéra L., Foucher J., Bernard PH., Carvalho F., Allaix D., Merrouche W., Couzigou P., de Lédinghen V. 2010. Pitfalls of liver stiffness measurement: a 5-year prospective study of 13,369 examinations. Hepatology., 51:828–835. Choi JY., Lee JM., Sirlin CB. 2014. CT and MR imaging
diagnosis and staging of hepatocellular carcinoma: part I. development, growth and spread: key pathologic and imaging aspects. Radiology., 272(3):635-654.
Chon YE., Choi EH., Song KJ., Park JY., Kim do Y., Han KH., Chon CY., Ahn SH., Kim SU. 2012. Performance of transient elastography for the staging of liver fibrosis in
patients with chronic hepatitis B: a meta-analysis. PLoS One.7:e44930.
Colli A., Fraquelli M., Andreoletti M., Marino B., Zuccoli E., Conte D. 2003. Severe liver fibrosis or cirrhosis: accuracy of US for detection--analysis of 300 cases. Radiology.,
227:89–94.
Dewbury KC., Clark B. 1979. The accuracy of Ultrasound in the detection of cirrhosis of the liver. BJR. Vol 25, 945- 948.
Di Lelio A., Cestari C. Cirrhosis Diagnosis with sonographic study of the liver Surface. Radiology. 172, 389- 392, 1989. Faria SC., Ganesan K., Mwangi I., Shiehmorteza M.,
Viamonte B., Mazhar S., Peterson M., Kono Y., Santillan C., Casola G. et al., 2009. MR imaging of liver fibrosis: Current state of the art. RSNA. 29:1615–1635.
Friedman AC. Cirrhosis, 1987. Other Diffuse disease, Portal Hypertension. radiology of the liver, Biliary tract, Pancrease and spleen. 69-88.
Friedrich-Rust M., Ong MF., Martens S., Sarrazin C., Bojunga J., Zeuzem S., Herrmann E. 2008. Performance of transient elastography for the staging of liver fibrosis: A meta-analysis. Gastroenterology. 134:960–974.
Ghany MG., Strader DB., Thomas DL., Seeff LB. 2009. Diagnosis, management, and treatment of hepatitis C: an update. Hepatology.49:1335–1374.
Gosink BB., Leymaster CE. Ultrasonic determination of hepatomegaly JCU.9, 37-41, 198
Hanna RF., Aguirre DA., Kased N., et al. 2008. Cirrhosis-associated hepatocellular nodules: correlation of histopathologic and MR imaging features. Radio
Graphics., 28(3):747-769
Hartman PC., Oosterveld BJ., Thijssen JM., Rosenbusch GJ., van den Berg J. 1993. Detection and differentiation of diffuse liver disease by quantitative echography. A retrospective assessment. Invest Radiol., 28:1–6.
Ishak K., Baptista A., Bianchi L., Callea F., De Groote J., Gudat F., Denk H., Desmet V., Korb G., MacSween RN. 1995. Histological grading and staging of chronic hepatitis.
J Hepatol., 22:696–699
Ishikawa T. Tsukune Y. 1980. Venous abnormalities in portal Hypertension demnustrated by CT. AJR. 134, 271-276. Kok T., van der Jagt EJ., Haagsma EB., Bijleveld CM., Jansen
PL., Boeve WJ. 1999. The value of Doppler ultrasound in cirrhosis and portal hypertension. Scand J Gastroenterol Suppl., 230:82–88.
Kudo M., Zheng RQ., Kim SR., Okabe Y., Osaki Y., Iijima H., Itani T., Kasugai H., Kanematsu M., Ito K. et al., 2008. Diagnostic accuracy of imaging for liver cirrhosis compared to histologically proven liver cirrhosis. A multicenter collaborative study. Intervirology. 51 Suppl 1:17–26.
Layer G., Zuna I., Lorenz A., Zerban H., Haberkorn U., Bannasch P., van Kaick G., Räth U. 1991. Computerized ultrasound B-scan texture analysis of experimental diffuse parenchymal liver disease: correlation with histopathology and tissue composition. J Clin Ultrasound., 19:193–201. Lee CH., Choi JW., Kim KA., Seo TS., Lee JM., Park CM.
2006. Usefulness of standard deviation on the histogram of ultrasound as a quantitative value for hepatic parenchymal echo texture; preliminary study. Ultrasound Med Biol.,
32:1817–1826.
Li R., Hua X., Guo Y., Zhang P., Guo A. 2006. Neighborhood-pixels algorithm combined with Sono-CT in the diagnosis of cirrhosis: an experimental study. Ultrasound Med Biol.,
32:1515–1520.
Massarrat S., Fallahazad V., Kamalian N. 2004. Clinical, biochemical and imaging-verified regression of hepatitis B- induced cirrhosis. Liver Int., 24:105–109.
Matsui O. et al., 1989. Adenomatous hyperplastic nodules in the cirrhotic liver. Radiology. 173, 123- 126.
Matsutani S, Fukuzawa T, et al. Ultrasonography in diagnosis of liver cirrhosis. Nippon- Rinsho. 52, 56-62, 1994. Mittelstaedt CA. 1986. Cirrhosis, Abdominal Ultrasound. 4 th
printing, 17-20 1989. 20- Rector WG. Compra J. Utility and limitation of splanchnic venous ultrasonography in diagnosis of portal hypertension. JCU. 14, 689-96.
Riggio S., Mamone F., Mandraffino G., Maimone S., Alibrandi A., Manti L., Saitta C., Tripodi PF., Sardo M.A., Squadrito G. et al., 2010. Assessment of liver stiffness in subjects affected by familial combined hyperlipidaemia with hepatic steatosis. Eur J Clin Invest., 40:722–728. Ronot M., Asselah T., Paradis V., Michoux N., Dorvillius M.,
Baron G., Marcellin P., Van Beers BE., Vilgrain V. 2010. Liver fibrosis in chronic hepatitis C virus infection: differentiating minimal from intermediate fibrosis with perfusion CT. Radiology., 256:135–142.
Sandrin L., Fourquet B., Hasquenoph JM., Yon S., Fournier C., Mal F., Christidis C., Ziol M., Poulet B., Kazemi F., et al
2003. Transient elastography: a new noninvasive method for assessment of hepatic fibrosis. Ultrasound Med Biol.,
29:1705–1713.
Saverymuttu SH. et al., 1990. Thickened Stomach: an Ultra sound sign of portal Hypertension. Clini - Radiol. Jan, 41, 17-18.
Saverymuttu SH. et al., Gall bladder wall Thickening in chronic liver disease: a sign of portal hypertension. BJR. 63, 922-5, 1990.
Sharma KC.S., Chataut D.SP. 2010. Hepatic vein waveforms in liver cirrhosis re-evaluated. Hepatol Int., 5:581–585. Sherlock DS. 1987. Hepatic Cirrhosis. Disease of the liver and
biliary System. 7th ed. 334-344.
Soresi M., Giannitrapani L., Cervello M., Licata A., Montalto G. 2014. Non invasive tools for the diagnosis of liver cirrhosis. World J Gastroenterol., 20:18131–18150. (PMC free article
Sporea I., Sirli R., Deleanu A., Tudora A., Popescu A., Curescu M., Bota S. 2010. Liver stiffness measurements in patients with HBV vs HCV chronic hepatitis: a comparative study. World J Gastroenterol., 16:4832–4837. Varenika V., Fu Y., Maher JJ., Gao D., Kakar S., Cabarrus
MC., Yeh BM. 2013. Hepatic fibrosis: evaluation with semiquantitative contrast-enhanced CT. Radiology.,
266:151–158.
Viganò M., Visentin S., Aghemo A., Rumi MG., Ronchi G. 2005. US features of liver surface nodularity as a predictor of severe fibrosis in chronic hepatitis C. Radiology., 234:641; author reply 641.
Wang Y., Ganger DR., Levitsky J., Sternick LA., McCarthy RJ., Chen ZE., Fasanati CW., Bolster B., Shah S., Zuehlsdorff S. et al. 2011. Assessment of chronic hepatitis and fibrosis: comparison of MR elastography and diffusion- weighted imaging. AJR Am J Roentgenol.,
196:553–561.
Yin XY., Lu MD., Huang JF., Xie XY., Liang LJ. 2001. Color Doppler velocity profile assessment of portal hemodynamics in cirrhotic patients with portal hypertension: correlation with esophageal variceal bleeding. J Clin Ultrasound. 29:7–13.