Astronomy & Astrophysicsmanuscript no. HD142 c ESO 2016 June 23, 2016
An M-dwarf star in the transition disk of Herbig HD 142527
Physical parameters and orbital elements
S. Lacour
1,2, B. Biller
3, A. Cheetham
4, A. Greenbaum
5, T. Pearce
6, S. Marino
6, P. Tuthill
7, L. Pueyo
8, E. E. Mamajek
9,
J. H. Girard
10, A. Sivaramakrishnan
8, M. Bonnefoy
11, I. Bara
ff
e
9,12, G. Chauvin
11, J. Olofsson
13,14,15, A. Juhasz
6,
M. Benisty
11, J.-U. Pott
13, A. Sicilia-Aguilar
16, T. Henning
13, A. Cardwell
17, S. Goodsell
18,19, J. R. Graham
20,
P. Hibon
10,17, P. Ingraham
21, Q. Konopacky
22, B. Macintosh
23, R. Oppenheimer
24, M. Perrin
8, F. Rantakyr¨o
17,
N. Sadakuni
25, and S. Thomas
21(Affiliations can be found after the references)
Received September 15, 1996; accepted March 16, 1997
ABSTRACT
Aims. HD 142527A is one of the most studied Herbig Ae/Be stars with a transitional disk, as it has the largest imaged gap in any protoplanetary
disk: the gas is cleared from 30 to 90 AU. The HD 142527 system is also unique in that it has a stellar companion with a small mass compared to the mass of the primary star. This factor of≈20 in mass ratio between the two objects makes this binary system different from any other YSO. The HD142527 system could therefore provide a valuable test bed for understanding the impact of a lower mass companion on disk structure. This low-mass stellar object may be responsible for both the gap and dust trapping observed by ALMA at longer distances.
Methods. We observed this system with the NACO and GPI instruments using the aperture masking technique. Aperture masking is ideal for
providing high dynamic range even at very small angular separations. We present the spectral energy distribution (SED) for HD 142527A and B. Brightness of the companion is now known from theRband up to theM0
band. We also followed the orbital motion of HD 142527B over a period of more than two years.
Results. The SED of the companion is compatible with aT =3000±100 K object in addition to a 1700 K blackbody environment (likely a
circum-secondary disk). From evolution models, we find that it is compatible with an object of mass 0.13±0.03M, radius 0.90±0.15R,
and age 1.0+1.0
−0.75Myr. This age is significantly younger than the age previously estimated for HD 142527A. Computations to constrain the orbital
parameters found a semimajor axis of 140+120
−70 mas, an eccentricity of 0.5±0.2, an inclination of 125±15 degrees, and a position angle of the right
ascending node of−5±40 degrees. Inclination and position angle of the ascending node are in agreement with an orbit coplanar with the inner disk, not coplanar with the outer disk. Despite its high eccentricity, it is unlikely that HD 142527B is responsible for truncating the inner edge of the outer disk.
Key words.protoplanetary disks, planet-disk interactions, binaries: visual, stars: Herbig
1. Introduction
During the process of planet formation and disk dissipation, pri-mordial disks begin in an optically thick state with significant emission at infrared wavelengths. As the disks clear out, they pass through an intermediate transitional stage marked by a drop in near- or mid-infrared (IR) emission that indicates the pres-ence of an annular disk gap. These gaps can form through sev-eral mechanisms, such as photoevaporation, truncation due to a binary companion, or the presence of a forming planet. This last pathway has led to transitional disks being the subject of close study, as they may provide valuable insights into the planet for-mation process.
HD 142527A, a young stellar object (YSO), is one of the most studied Herbig Ae/Be stars with a transitional disk. With dust and some gases cleared from 30 to 90 AU, it has the largest imaged gap in any protoplanetary disk. According to Mendigut´ıa et al. (2014), the age, distance, and mass for this star are 5 ±1.5 Myr, 140±20 pc and 2.0 ±0.3M, respec-tively. Biller et al. (2012) discovered a low-mass stellar com-panion (∼0.2 M) at≈12 AU from the star within the gap. This companion was confirmed in theRband by Close et al. (2014). Eccentric orbit or not, it may have played a vital role in carving the large gap in this system.
HD 142527A is also notable for its diversity of disk struc-ture. Recent imaging with the Atacama Large Millimeter Array (ALMA) of the outer disk (Casassus et al. 2013, 2015b) re-veals large asymmetrical structures composed of millimeter-size grains (similar to the rare horseshoe structure also seen around the young Herbig star WLY 2-48 by van der Marel et al. 2013). These structures are thought to be signposts of density varia-tions possibly caused by planetary formation (Williams & Cieza 2011). Scattering of the stellar light in the near-infrared also re-veals structures at the surface of the outer disk (Avenhaus et al. 2014).
The HD 142527 system provides a valuable test bed for un-derstanding the impact of a lower mass companion on disk struc-ture. As opposed to other young stellar binaries, which generally have nearly equal masses, the HD 142527 system has a more ex-treme mass ratio (a factor of∼20). Thus, we can study in situ the effects of this companion, which may be responsible for both the gap and dust trapping observed further out in this disk. However, initial constraints on the mass and other properties of the com-panion are still vague and at its present apparent separation it does not appear to be responsible for clearing the large disk gap. Many studies have invoked the possibility of forming giant plan-ets on wide orbits exterior to the companion, making HD 142527
Visibilities (Amplitude)
|V| = 0.85 |V| = 0.9 |V| = 0.95 |V| = 1
−5 0 5
−5 0 5
0.84 0.88 0.92 0.96 1.00
Visibilities (Phases)
−1 deg −0.5 deg 0.5 deg 1 deg
−5 0 5
−5 0 5
−1.84 −0.92 0.00 0.92 1.84
Fig. 1. SAM K band dataset. The phase and amplitude in the Fourier domain are represented by the size and color of the open circles. The units are normalized visibility for the amplitudes (left panel) and degrees for the phases (right panel). The color continuum below the data point are obtained by fitting Zernike polynomials to the data. The diagonal stripes observed on the phases are typical of a binary system.
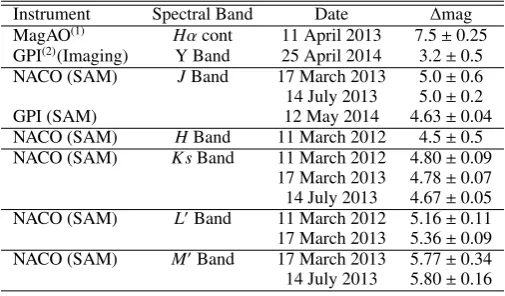
Table 1.Observations and contrast ratio
Instrument Spectral Band Date ∆mag MagAO(1) Hαcont 11 April 2013 7.5±0.25
GPI(2)(Imaging) Y Band 25 April 2014 3.2±0.5
NACO (SAM) JBand 17 March 2013 5.0±0.6
14 July 2013 5.0±0.2
GPI (SAM) 12 May 2014 4.63±0.04
NACO (SAM) HBand 11 March 2012 4.5±0.5
NACO (SAM) K sBand 11 March 2012 4.80±0.09
17 March 2013 4.78±0.07
14 July 2013 4.67±0.05
NACO (SAM) L0
Band 11 March 2012 5.16±0.11
17 March 2013 5.36±0.09
NACO (SAM) M0
Band 17 March 2013 5.77±0.34
14 July 2013 5.80±0.16
References. (1) Close et al. (2014); (2) Rodigas et al. (2014)
an exciting target for direct imaging observations. Constraining the mass and orbital parameters of the low-mass companion is vital to determining the origin of the observed disk gap.
We have been conducting ongoing orbital monitoring to con-strain the companion properties. This paper reports multiple aperture masking observations of HD142527B. The interfero-metric nature of the technique permits precise measurements of the contrast ratio and separation, even though the companion lies at the diffraction limit of the telescope. In Section 2, we present the new sparse aperture masking (SAM) observations. In Section 3, we review the basic parameters of HD142527A. In Section 4, we report and discuss the SED of the companion from visible to mid-infrared (5µm) light. In Section 5, we present the orbital parameters of the companion. In Section 6, we discuss the results.
2. Observations and data reduction
2.1. Principle
Nonredundant aperture masking (NRM), also called sparse aper-ture masking (SAM) allows a single aperaper-ture telescope to be used as a Fizeau interferometer. This is accomplished by di-viding the aperture of the telescope into multiple subapertures
Fig. 2.SAM K band image reconstruction generated using the MIRA reconstruction software (Thi´ebaut 2008).
using a mask in the pupil plane of the telescope, then allowing light from the subapertures to interfere. The point spread func-tion (PSF) is thus transformed into a pattern made of multiple fringes. Measuring the amplitude and phase of these fringes al-lows us to retrieve information to the diffraction limit of the tele-scope and beyond. The use of closure phases with SAM also en-ables high contrast capability, as closure phases are an estimator robust to atmospheric and optical aberrations (Knox 1976).
2.2. Datasets and image reconstruction
We observed HD142527 with two instruments: NACO at the VLT, and the Gemini Planet Imager (GPI) on the Gemini South telescope. Both instruments are equipped with NRM masks. We used a 7-hole on NACO (Tuthill et al. 2010) and the 10-hole on GPI (Greenbaum et al. 2014).
New NACO data were obtained in March 2013 and July 2013. All NACO data were reduced with the SAMP pipeline (Lacour et al. 2011). The two calibrators HD 142695 and HD 144350 were interleaved with the observations. We reana-lyzed the March 2012 NACO data from Biller et al. (2012) to re-move HD 142384 as a calibrator, which turned out to be a close binary system (Le Bouquin 2014). The new reduction also bene-fits from recent updates to the SAMP pipeline to include a post-processing atmospheric dispersion corrector.
(sepa-ration, position angle, and contrast ratio), with the contrast ratio assumed to be constant across the wavelength channels.
To illustrate the typical data produced by NRM, the Ks band data obtained in July 2013 are presented in Fig 1. Theu-v fre-quency domain is limited by the diameter of the 8-meter tele-scope. The amplitudes (visibilities) are normalized by the con-trast observed on the calibrators. The right panel shows the phase derived from the closure phase. The closure phase to phase re-lation was established by singular value decomposition of the closure phase-to-phase matrix. Missing phase parameters (pis-ton, tip, tilt, etc...) are set to zero.
We used closure phases and amplitudes to reconstruct a high resolution deconvolved image with the MIRA software (Thi´ebaut 2008). The resulting high resolution deconvolved im-age is shown for the July 2013 Ks band dataset in Fig. 2. We per-formed the image synthesis using a nonparametric least-squares modeling technique over the amplitudes and closure phases, and adding a regularization term called “xsmooth” (`2−`1
smooth-ness constraint). A point-source model image was used as seed for the image reconstruction. We found that the companion de-tection is robust to different regularization methods.
2.3. Companion fitting
Parameters describing the companion were extracted through model fitting to the closure phase data only, discarding the vis-ibilities. At each epoch of observation, a single position was si-multaneously fitted to all spectral bands to better constrain the flux ratio at long wavelengths. The model fitted to the closure phase is the following:
CP(u,v, λ) = arg1+ρ
λexp(2iπ(α·u)/λ) +arg1+ρ
λexp(2iπ(α·v)/λ) +arg1+ρ
λexp(−2iπα·(u+v)/λ), (1) whereλis the wavelength, and (u,v) the two baseline-vectors that compose the closure phase triangle. The free parameters of the fit are: i) the separation vectorα and ii) ρλ, the flux of the secondary with respect to the primary. The separationαis wavelength independent, but the flux of the secondary depends on the filter bandpass (from J band to M0 band). This proce-dure helps mitigate the problem of limited angular resolution at longer wavelengths.
The best solution forαis achieved by taking the minimum value of the 2Dχ2map. The map is obtained by regression over
the free parametersρλ. The map is then normalized to a reduced
χ2 of one, and the three sigma errors are determined from the
area below which the reducedχ2is less than 10. An example of such a map is given in the central panel of Fig 1 in Biller et al. (2012).
Finally, we determined the flux ratio for each filter,ρλ, adopt-ing the position (includadopt-ing its error) obtained at each epoch. The flux ratios between the central star (including the unresolved part of the inner disk) and the companion are presented in Table 1. Unless stated otherwise, errors mentioned in this paper are 1 sigma.
3. HD142527A
3.1. Distance, age, and mass
[image:3.595.310.573.76.163.2]We adopt a distance of 140±20 pc based on the arguments made by Mendigut´ıa et al. (2014), namely that the star is near the
Table 2.Visible and near-infrared fluxes of HD142527B
Band ∆mag HD142527A HD142527B HD142527B [Jy] [mJy] [Abs. Mag.]
Rcont 7.5±0.25(1) 1.8±0.2(3) 1.8±0.3 9.3±0.3
J 4.63±0.04 3.8±0.1(2) 53±2 5.13±0.05
H 4.5±0.5 4.6±0.1(2) 74±32 4.6±0.5
KS 4.72±0.04 5.6±0.1(2) 72±3 4.1±0.1
L0 5.26±0.08 7.4±0.3(2) 58±5 3.4±0.1
M0 5.79±0.16 6.7±0.3(2) 32±5 3.5±0.2
References. (1) Close et al. (2014) (2) Verhoeffet al. (2011) (3) from SED using Castelli & Kurucz (2004) stellar models
Notes. Absolute magnitudes are obtained assuming a distance of 140pc and dereddened from anAV=0.6 dust absorption.
Lupus IV cloud, and shares the proper motion and radial ve-locity of neighboring Sco-Cen stars (e.g., Preibisch & Mamajek 2008). The proper motion of the star (µα =-17.2 mas/yr,µδ = -18.0 mas/yr ; van Leeuwen 2007) is similar to that of overall proper motion of stars associated with the Lupus clouds (µα = -16.0 mas/yr,µδ=-21.7 mas/yr ; Galli et al. 2013). The star is likely to be co-distant with either the Lupus clouds (Galli et al. 2013) or Upper Cen-Lup subgroup of Sco-Cen (∼142 pc de Zeeuw et al. 1999), which surrounds the Lupus clouds.
Mendigut´ıa et al. (2014) used an X-Shooter spectrum to con-strain the temperature and the Yi et al. (2001) tracks to estimate the age and mass of HD142527A. These do provide a dense grid of tracks for masses of∼ 2M. However evolution mod-els can be prone to systematic error in age and mass, especially for young stars. Therefore, we run the star parameters through different isochrone pre-main-sequence track models. When we adopt theTeff =6550±100Kand luminosityL=16.3±4.5L from Mendigut´ıa et al. (2014), we get the following age & mass pairs:
D’Antona & Mazzitelli (1997) tracks:
– log(age/yr)=6.69+0.07-0.15 (1σ)+0.13-0.39 (2σ) – age(Myr)=4.9+0.8-1.4 (1σ)+1.8-2.9 (2σ) – Mass(M)=2.08+0.24-0.13 (1σ)+0.72-0.25 (2σ)
Siess et al. (2000) tracks:
– log(age/yr)=6.80+0.11-0.12 (1σ)+0.21-0.25(2σ) – age(Myr)=6.3+1.7-1.5 (1σ)+3.9-2.7(2σ)
– Mass(M)=2.01+0.21-0.18 (1σ)+0.48-0.33 (2σ) Yonsei-Yale (Yi et al. 2003) tracks:
– log(age/yr)=6.70+0.11-0.13 (1σ)+0.24-0.27 (2σ) – age(Myr)=5.0+1.5-1.3 (1σ)+3.7-2.3 (2σ)
– Mass(M)=2.07+0.21-0.18 (2σ)+0.46-0.37 (2σ) . We adopt a mass of 2.05M, with a statistical and observa-tional error of±0.2M. We add a systematic error of±0.04M from the tracks, assuming these three sets of tracks are sampling our ignorance in composition in physics. However, we conclude that the values given by Mendigut´ıa et al. (2014) are a good ap-proximation: a mass of 2.0±0.3Mand an age of 5.0±1.5 Myr.
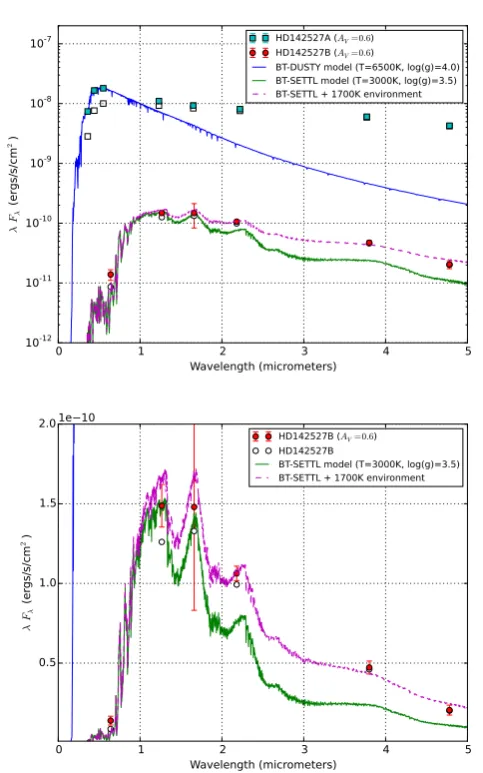
3.2. Spectral energy distribution
0 1 2 3 4 5 Wavelength (micrometers)
10-12 10-11 10-10 10-9 10-8 10-7
λ
Fλ
(e
rgs/
s/c
m
2)
HD142527A (AV=0.6) HD142527B (AV=0.6)
BT-DUSTY model (T=6500K, log(g)=4.0) BT-SETTL model (T=3000K, log(g)=3.5) BT-SETTL + 1700K environment
0 1 2 3 4 5
Wavelength (micrometers) 0.5
1.0 1.5 2.0
λ
Fλ
(e
rgs/
s/c
m
2)
1e(10
HD142527B (AV=0.6) HD142527B
[image:4.595.307.565.58.391.2]BT-SETTL model (T=3000K, log(g)=3.5) BT-SETTL + 1700K environment
Fig. 3.Spectral energy distribution of HD142527 A & B. The empty symbols are uncorrected for reddening. The filled sym-bols include correction for a dust opacity of visible absorption magnitudeAV = 0.6. Blue and green curves are stellar models
of both stars from Allard et al. (2012).
by Weingartner & Draine (2001) (RV=3.1). Following Verhoeff
et al. (2011), we used a visible extinctionAV =0.6 mag, which
includes the extinction by the interstellar medium and by the cir-cumstellar material. This is in rough agreement with the excess color estimated by Malfait et al. (1998) and Mendigut´ıa et al. (2014) ofE(B−V)=0.33 and 0.25 mag, respectively .
We obtain the blue spectral curve presented in Fig. 3 by adjusting a synthetic model of stellar atmosphere to the HD142527A dereddened fluxes. We used a Allard et al. (2012) DUSTY model of temperature 6500 K and density log(g)=4.0. The main objective was to determine the R band continuum emission of HD142527A. The result is within the error bar of using a temperature model of 6550 K and log(g) of 3.75 as de-rived by Mendigut´ıa et al. (2014). TheRband continuum flux is reported in Table 2.
2000
4
2500
3000
3500
4000
4500
5000
6
8
10
12
14
R
m
ag
0.5 Myr
1.0 Myr
2.0 Myr
3.0 Myr
4.0 Myr
5.0 Myr
40 Mjup
100 Mjup
200 Mjup
300 Mjup
500 Mjup
800 Mjup
2000
2500
3000
3500
4000
4500
5000
Temperature (K)
2
4
6
8
10
J
m
[image:4.595.46.288.63.450.2]ag
Fig. 4.Isocontours of masses and ages as a function of temper-ature and absolute magnitude, according to evolutionary models from Baraffe et al. (2015). The central asterisk correspond to HD142527B. HD14252A, with an effective temperature on the order of 6500 K, lies outside the plot and outside the temperature range of the model.
4. Physical parameters of HD142527B
4.1. Spectral energy distribution
We fit the SED of HD142527B with a combination of stellar emission and dust emission from the circumsecondary disk. The dust emission is approximated by a blackbody of temperature 1700 K, which is close to the sublimation limit of dust parti-cles. We used the BT-SETTL models computed by Allard et al. (2012)1to fit the stellar component of the SED. The parameters of this model are a temperature of 3000 K and a surface gravity oflog(g)=3.5.
We find that the dust component modeled as a 1700 K black-body emission primarily fits the longer wavelengths in the SED, while the J and R band emission is emitted almost exclusively (>90%) from the stellar surface. Thus, we can derive the tem-perature of the stellar surface from the J-R color of the object.
The absolute magnitudes are reported in the right column of Table 2. These values are computed using a distance of 140 pc and dereddened using the algorithm determined by (Cardelli et al. 1989). In the following study, we adopt aJband absolute magnitude of 5.23±0.1 mag. The absolute magnitude includes an additional 0.1 mag, corresponding to≈ 10%, to remove
Table 3.HD 142527 B orbital observations
Instrument Date Sep (mas) PA (deg) NACO (SAM) 11 March 2012 89.7±2.6 133.1±1.9
NACO (SAM) 17 March 2013 82.0±2.1 126.3±1.6
MagAO(1) 11 April 2013 86.3±1.9 126.6±1.4
NACO (SAM) 14 July 2013 82.5±1.1 123.8±1.2
MagAO(2) April 2014 79.7±5.6 119.5±8.7
GPI (Direct)(2) 25 April 2014 88.2±10.1 123.0±9.2
GPI (NRM) 12 May 2014 77.2±0.6 116.6±0.5
References. (1) Close et al. (2014); (2) Rodigas et al. (2014)
cumstellar emission. Dust emission is assumed to be negligible in theRband.
Hence, we obtain (R−J)HD142527B =4.17±0.3 mag, where
the error is dominated by theRband contrast ratio uncertainties. According to the catalog of stellar surface colors from Allard et al. (2012), we derive an effective temperature ofTHD142527B =
3000±100 K, assuming log(g)=3.5.
4.2. Estimation of mass, age, and radius
The ratio between the radius of HD142527A and HD142527B can be estimated from the relative magnitude and effective tem-peratures of the stars. It isRHD142527A/RHD142527B =2.8±0.2 if
we assume an effective temperature of 6500 K for the primary and 3000 K for the secondary.
The mass, age, and absolute radius can be obtained from the absolute magnitudes, however, it requires prior knowledge of the evolution process of the star. Thus, we used the stan-dard evolutionary model from Baraffe et al. (2015). This model does not assume any accretion during the evolution of the sys-tem. We plotted in Fig. 4 the isochrome and isomass of the star as a function of the temperature andR andJ absolute magni-tudes. According to these models, a suitable set of parameters areMHD142527B =0.13±0.03M,RHD142527B =0.90±0.15R and an age of 1.0+1.0
−0.75Myr. All errors are 1 sigma.
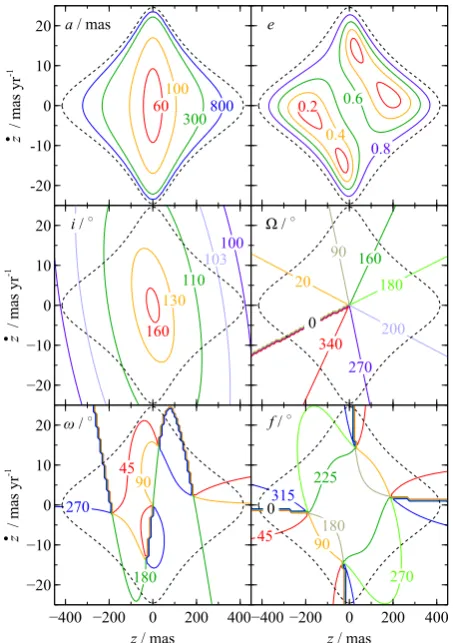
5. Orbital elements of HD142527B
5.1. Small arc analysis
Known separations and position angles of HD142527B with re-spect to HD142527A are presented in Table 3. This includes all SAM observations, plus two MagAO observations (Close et al. 2014; Rodigas et al. 2014) and one GPI polarimetric observation (Rodigas et al. 2014). We included the two MagAO observations in our analysis, but did not include the GPI polarimetric obser-vation (obtained through direct imaging). This GPI obserobser-vation is far offthe other measurements, possibly because of scattered emissions that biased the determination of the barycenter.
This dataset covers two years of observations, but only a small arc of the orbit is observed, corresponding to 15 degrees in position angle. The first approximation is therefore to con-sider that our knowledge is limited to a position and a veloc-ity vector, projected on the plane of the sky. Thus, the posi-tion and velocity orthogonal to the plane of the sky remain unknown and prevent us from fully characterizing this orbit. However, we can still place constraints on some of the orbital parameters. From our data listed in Table 3, we computed a vec-tor position (x,y) = (68.0±0.7,−47) mas and a vector speed ( ˙x,y˙) =(2.0±0.9,13.4±0.9) mas/yr. The position in right as-cension is labeled xandyfor the declination. Theyvalue was
800 300 100
60
a / mas
z
/
m
as
y
r
-1
-20 -10 0 10 20
0.8 0.6
0.4
0.2
e
100
103
110 130
160
i / ○
z
/
m
as
y
r
-1
−20 −10 0 10 20
340
0
270
200
180 160 90
20 Ω / ○
270
180 90
45
ω / ○
z
/
m
as
y
r
-1
−20 −10 0 10 20
z / mas
−400 −200 0 200 400
45
0315
270 225
180 90 f / ○
z / mas
[image:5.595.53.287.76.162.2]−400 −200 0 200 400
Fig. 5.Orbital elements of the system for differentzand ˙zvalues. The contours are obtained by assuming a total system mass of MAB=2.2Mand a distance to the system ofd=140 pc.
arbitrarily fixed to−47 mas to force the determination of the true anomaly at this declination (the choice of this fixed parameter does not affect the orbital elements). Finally, we definedµas a scaled mass parameter that characterizes the acceleration at any given angular separation,
µ=GM/d3=4π2 M
M
! d pc
!−3
arcsec3/year2, (2)
whereGis the gravitational constant. We used M =2.2Mas the total mass of the binary system andd =140 pc for the dis-tance of the binary system. Hence, for the HD142527AB system
µ=3.2×10⁻⁵arcsec3/year2. (3)
The assumption that the companion is gravitationally bound to the main stellar object (eccentricity below or equal to 1) al-lows us to delimit a parameter space for thezand ˙zcomponents. This (z,z˙) parameter space is illustrated in Fig. 5 with dashed lines. The contours represent the six different parameters of the orbit. They correspond to the semimajor axisain mas, the eccen-tricitye, the inclination irelative to the sky plane, the position angle of the ascending node, the argument of the periapsis, and the true anomaly at which the companion reachesy=−47 mas. All elements are derived following the methodology described by Pearce et al. (2015).
0.0
0.2
0.4
0.6
0.8
Eccentricity
100
120
140
160
180
Inclination
0
80
160
240
Periastron
200 400 600 800
Semi-Axis [mas]
50
0
50
Ascending Node
0.0 0.2 0.4 0.6 0.8
Eccentricity
100 120 140 160 180
Inclination
0
80 160 240
Periastron
50
0
50
[image:6.595.67.535.48.422.2]Ascending Node
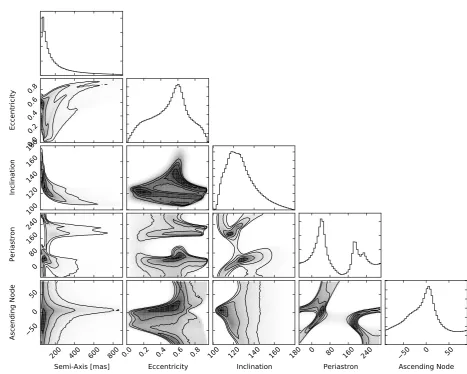
Fig. 7.MCMC simulation for the parameters of the orbit of HD142527B. We assumedµ = 3.2×10⁻⁵arcsec3/year2. All angles are in degrees. Ascending node is calculated for a range of values between -90 and 90 degrees. For comparison, the inner disk as simulated by Casassus et al. (2015a) as a position angle (PA) for the ascending node of -3 degrees, and an inclination with respect to the plane of the sky of 43 degrees (equivalent to 137 degrees following the convention that a clockwise system has an inclination between 90 and 180 degrees).
5.2. Full determination of the orbital parameters
We also investigate possible orbits using an MCMC analysis as an alternative to the small arc technique presented in the previous section. Such an alternative technique has already been used for small arc dataset (e.g., on Fomalhaut by Kalas et al. 2013). This method also has the advantage to better benefit from individual observational errors over multiple observations.
We used the MCMC python library emcee (Foreman-Mackey et al. 2013). We computed the walkers for the vari-ables (x,z,x˙,y˙,z˙) and converted them to a probability distribu-tion funcdistribu-tion for the orbital parameters. Any corresponding or-bital element with an eccentricity above 1 was given a probabil-ity of zero. Within this boundary condition, thezand ˙zare given uniform prior distributions. The position angle of the ascending node was forced to lie between -90 and 90 degrees. The relation between (x,y,z,x˙,y˙,˙z) and the orbital parameters are given in Appendix B of Pearce et al. (2015).
The results from the MCMC simulation are presented in Fig. 7. Unfortunately, the small range of position angles cov-ered by our dataset does not strongly constrain the orbital ele-ments. Within 1 sigma probability (68% of the results), they are the following: a semimajor axisa=140+−12070 mas, an eccentricity
e = 0.5±0.2, an inclination ofi = 125±15 degrees, and an angular position of the right ascending node of−5±40 degrees. The angle of the periastron is the least constrained parameter. Two distinct families of orbits emerged from this simulation: one with a periastron around 40 degrees and the other at a periastron around 200 degrees. These two families of orbits are presented in Fig. 6. In this figure, all the gray curves have equal probabilities. The blue and red curves correspond to a maximum of probabil-ity. The first family, shown with the blue curve, corresponds to a trajectory where the companion has just passed the periastron. The second family, shown with the red curve, corresponds to a trajectory where the companion is going to pass the periastron.
6. Discussion
6.1. Summary
500 400 300 200 100 0
100
RA (mas) 200
100 0 100 200
Dec (mas)
60 65 70 75 80
70 65 60 55 50 45 40 35 30
May 2014
[image:7.595.338.533.57.246.2]March 2012
Fig. 6.Likely orbits for HD142527B from MCMC simulation. The red and blue curves correspond to maximum likelihood parameters. The gray curves indicate possible solutions from the MCMC computations. The SAM observation indicate black squares. The green lozenge corresponds to a MagAO observa-tion reported by Rodigas et al. (2014).
was mostly unaffected by the circumsecondary emission (to the 10% level).
If we assume that the NIR emission is caused by a circum-secondary environment, we can focus on the shorter wavelength observations (R andJband observations) to determine the pa-rameters of the star. The result is that HD142527B is a fairly standard young low-mass star that matches standard evolution mechanisms. However, at least according to the Baraffe et al. (2015) models, this last statement is only valid if we assume an age of 1.0+−10..075Myr.
6.2. Age of the system
If we increase the age of the system to 5 Myr (according to Mendigut´ıa et al. 2014), then the colors of the companion start to disagree with its absolute magnitudes. To reconcile a more ad-vanced age with our observations, we would have to increase the apparent magnitude (make the star fainter). For the magnitudes to agree in the HR diagrams of Fig. 4 with an age of 5±1.5 Myr, we would have to add 1.0 and 1.5 mag to theRandJband mag-nitudes, respectively. That would put the target at 70 pc, which is not compatible with the distance estimated in Section 3.1. Dust absorption would only decrease the absolute magnitude, giving an opposite effect.
Although previous episodes of intense accretion can change the structure and thus the position of a young object in a magnitude-temperature diagram, it seems difficult to invoke ac-cretion effects to get an age of 5 Myr, instead of 1 Myr, for the observed luminosity of the low-mass companion. As discussed in Baraffe et al. (2009, 2012), cold accretion would have the op-posite effect. The only, very unlikely possibility, would be for the low-mass star to have had a previous episode of intense hot accretion that would increase its luminosity and radius. The ob-ject would thus look younger than its nonaccreting counterpart. This accretion episode, however, should be recent. Otherwise, the object would have time to contract back to a size compatible with the models.
Disk edge
Allowed orbits
A
po
ce
nt
er
d
is
ta
nc
e
/ A
U
0 20 40 60 80 100
Inclination relative to outer disk / ○
0 20 40 60 80 100 120
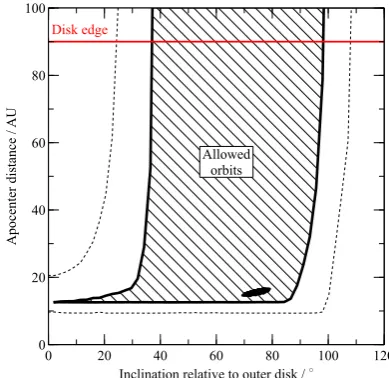
Fig. 8. Possible apocenter distance of the companion vs. its inclination relative to the outer disk plane. The shaded region shows allowed orbits and the dashed lines indicate the 1σ er-rors on this region. The thick red line is the inner edge of the outer disk, showing that the companion cannot have an apocen-ter close to this edge and simultaneously orbit in the same plane as the disk. The black area in the lower right of the allowed re-gion shows orbits lying within 5 degrees of the inner disk plane.
The age estimations of HD142527 A&B rely on evolutionary models that have their own intrinsic source of errors. It has been shown that these uncertainties can be well above a few million years (Soderblom et al. 2014). Especially, it has been shown that the ages of intermediate-mass stars tend to disagree with the ages of the T Tauri stars in same clusters (Hartmann 2003).
This system thus seems to confirm the existence of a dis-agreement between ages derived from low-mass star models and those from intermediate-mass star models. Since the source of uncertainties in the physics and modeling of these two families of objects is different, more efforts and more of those systems are needed to determine whether the remaining uncertainties are inherent to the former or the latter models (or to both)
6.3. Interaction with the circumprimary and circumbinary disks
The orbital elements of the binary system are not in agreement with the orientation and inclination of the outer disk, but they are in agreement with the parameters of the inner disk derived by Marino et al. (2015) and Casassus et al. (2015a): an inclination of 140 degrees with respect to the sky plane (70 degrees with respect to the outer disk) and a PA of the ascending node at -3 degrees. It is therefore likely that the kinematics of the inner disk are linked to the kinematics of HD142527B.
[image:7.595.47.295.64.254.2]2015). The figure shows that for the apocenter distance of the companion to be comparable to the inner edge of the outer disk, its inclination to the outer disk plane must be greater than∼30◦. Furthermore if we assume that the companion lies in the plane of the inner disk (as suggested above) then its apocenter is only around 15 AU, and it is misaligned to the outer disk by∼ 70◦. Hence the companion cannot simultaneously lie in the outer disk plane and have an apocenter comparable to the inner edge of the outer disk, so it is unlikely that the companion is responsible for truncating the outer disk.
Acknowledgements. SL acknowledges fruitful discussions with S. Casassus about the existence of HD142527B and the inner disk of HD142527A. This research made use of Astropy, a community-developed core Python pack-age for Astronomy (Astropy Collaboration et al. 2013). This work was sup-ported by the French National Agency for Research (ANR-13-JS05-0005) and the European Research Council (ERC-STG-639248). AG and AS ac-knowledge support from NSF Graduate Research Fellowship grant no. DGE-1232825 and NASA grant NNX11AF74G. JO acknowledges support from the Millennium Nucleus RC130007 (Chilean Ministry of Economy). IB acknowl-edges the European Research Council through grant ERC-AdG No. 320478-TOFU. Based on observations collected at the European Southern Observatory (ESO) during runs 088.C-0691(A), 090.C-0649(A), 091.C-0572(A), and 094.C-0608(A). Also based on observations obtained at the Gemini Observatory (pro-grams GS-2014A-SV-406 and GS-ENG-GPI-COM), which is operated by the Association of Universities for Research in Astronomy, Inc., under a coopera-tive agreement with the NSF on behalf of the Gemini partnership: the National Science Foundation (United States), the National Research Council (Canada), CONICYT (Chile), the Australian Research Council (Australia), Minist´erio da Ciˆencia, Tecnologia e Inovac¸˜ao (Brazil) and Ministerio de Ciencia, Tecnolog´ıa e Innovaci´on Productiva (Argentina).
References
Allard, F., Homeier, D., & Freytag, B. 2012, Philosophical Transactions of the Royal Society of London Series A, 370, 2765
Astropy Collaboration, Robitaille, T. P., Tollerud, E. J., et al. 2013, A&A, 558, A33
Avenhaus, H., Quanz, S. P., Schmid, H. M., et al. 2014, ApJ, 781, 87 Baraffe, I., Chabrier, G., & Gallardo, J. 2009, ApJ, 702, L27
Baraffe, I., Homeier, D., Allard, F., & Chabrier, G. 2015, A&A, 577, A42 Baraffe, I., Vorobyov, E., & Chabrier, G. 2012, ApJ, 756, 118
Biller, B., Lacour, S., Juh´asz, A., et al. 2012, ApJ, 753, L38 Cardelli, J. A., Clayton, G. C., & Mathis, J. S. 1989, ApJ, 345, 245 Casassus, S., Marino, S., Perez, S., et al. 2015a, ArXiv e-prints Casassus, S., van der Plas, G., M, S. P., et al. 2013, Nature, 493, 191 Casassus, S., Wright, C., Marino, S., et al. 2015b, ArXiv e-prints Castelli, F. & Kurucz, R. L. 2004, ArXiv Astrophysics e-prints Close, L. M., Follette, K. B., Males, J. R., et al. 2014, ApJ, 781, L30 D’Antona, F. & Mazzitelli, I. 1997, Mem. Soc. Astron. Italiana, 68, 807 de Zeeuw, P. T., Hoogerwerf, R., de Bruijne, J. H. J., Brown, A. G. A., & Blaauw,
A. 1999, AJ, 117, 354
Foreman-Mackey, D., Hogg, D. W., Lang, D., & Goodman, J. 2013, PASP, 125, 306
Galli, P. A. B., Bertout, C., Teixeira, R., & Ducourant, C. 2013, A&A, 558, A77 Greenbaum, A. Z., Cheetham, A., Sivaramakrishnan, A., et al. 2014, in Society of Photo-Optical Instrumentation Engineers (SPIE) Conference Series, Vol. 9147, Society of Photo-Optical Instrumentation Engineers (SPIE) Conference Series, 7
Hartmann, L. 2003, ApJ, 585, 398
Kalas, P., Graham, J. R., Fitzgerald, M. P., & Clampin, M. 2013, ApJ, 775, 56 Knox, K. T. 1976, Journal of the Optical Society of America (1917-1983), 66,
1236
Lacour, S., Tuthill, P., Amico, P., et al. 2011, A&A, 532, A72 Le Bouquin, J.-B. 2014, ArXiv e-prints
Malfait, K., Bogaert, E., & Waelkens, C. 1998, A&A, 331, 211 Marino, S., Perez, S., & Casassus, S. 2015, ApJ, 798, L44
Mendigut´ıa, I., Fairlamb, J., Montesinos, B., et al. 2014, ApJ, 790, 21 Pearce, T. D., Wyatt, M. C., & Kennedy, G. M. 2015, MNRAS, 448, 3679 Perez, S., Casassus, S., M´enard, F., et al. 2015, ApJ, 798, 85
Perrin, M. D., Maire, J., Ingraham, P., et al. 2014, in Society of Photo-Optical Instrumentation Engineers (SPIE) Conference Series, Vol. 9147, Society of Photo-Optical Instrumentation Engineers (SPIE) Conference Series, 3 Preibisch, T. & Mamajek, E. 2008, The Nearest OB Association:
Scorpius-Centaurus (Sco OB2) (ASP Monograph Publications), 235
Rodigas, T. J., Follette, K. B., Weinberger, A., Close, L., & Hines, D. C. 2014, ApJ, 791, L37
Siess, L., Dufour, E., & Forestini, M. 2000, A&A, 358, 593
Soderblom, D. R., Hillenbrand, L. A., Jeffries, R. D., Mamajek, E. E., & Naylor, T. 2014, Protostars and Planets VI, 219
Thi´ebaut, E. 2008, in Society of Photo-Optical Instrumentation Engineers (SPIE) Conference Series, Vol. 7013, Society of Photo-Optical Instrumentation Engineers (SPIE) Conference Series, 1
Tuthill, P., Lacour, S., Amico, P., et al. 2010, in Society of Photo-Optical Instrumentation Engineers (SPIE) Conference Series, Vol. 7735, Society of Photo-Optical Instrumentation Engineers (SPIE) Conference Series, 1 van der Marel, N., van Dishoeck, E. F., Bruderer, S., et al. 2013, Science, 340,
1199
van Leeuwen, F. 2007, A&A, 474, 653
Verhoeff, A. P., Min, M., Pantin, E., et al. 2011, A&A, 528, A91 Weingartner, J. C. & Draine, B. T. 2001, ApJ, 548, 296 Williams, J. P. & Cieza, L. A. 2011, ARA&A, 49, 67
Wolff, S. G., Perrin, M. D., Maire, J., et al. 2014, in Society of Photo-Optical Instrumentation Engineers (SPIE) Conference Series, Vol. 9147, Society of Photo-Optical Instrumentation Engineers (SPIE) Conference Series, 7 Yi, S., Demarque, P., Kim, Y.-C., et al. 2001, ApJS, 136, 417
Yi, S. K., Kim, Y.-C., & Demarque, P. 2003, ApJS, 144, 259
1 LESIA / Observatoire de Paris, PSL, CNRS, UPMC, Universit´e
Paris Diderot, 5 place Jules Janssen, F-92195 Meudon, France
2 Cavendish Laboratory, University of Cambridge, JJ Thomson
Avenue, Cambridge CB3 0HE, UK
3 Institute for Astronomy, University of Edinburgh, Blackford Hill
View, Edinburgh EH9 3HJ, UK
4 Observatoire de Gen`eve, Universit´e de Gen`eve, 51 chemin des
Maillettes, 1290, Versoix, Switzerland
5 Johns Hopkins University Department of Physics and Astronomy,
address: 3400 N. Charles St., Baltimore, MD 21218
6 Institute of Astronomy, University of Cambridge, Madingley Road,
Cambridge, CB3 0HA, UK
7 Sydney Institute for Astronomy, School of Physics, University of
Sydney, NSW 2006, Australia
8 Space Telescope Science Institute, 3700 San Martin Drive,
Baltimore MD 21218
9 Astrophysics Group, School of Physics, University of Exeter, Exeter
EX4 4QL, UK
10 European Southern Observatory, Alonso de Cordova 3107, Casilla
19001, Santiago, Chile
11 Univ. Grenoble Alpes, CNRS, IPAG / UMR 5274, F-38000
Grenoble,
12 Ecole Normale Sup´erieure, Lyon, CRAL (UMR CNRS 5574),´
Universit´e de Lyon 1, 69007 Lyon, France
13 Max Planck Institut f¨ur Astronomie, K¨onigstuhl 17, D-69117
Heidelberg, Germany
14 Instituto de F´ısica y Astronom´ıa, Universidad de Valpara´ıso, Av.
Gran Breta˜na 1111, Playa Ancha, Valpara´ıso, Chile
15 ICM nucleus on protoplanetary disks, Universidad de Valpara´ıso,
Av. Gran Breta˜na 1111, Valpara´ıso, Chile
16 School of Physics and Astronomy, University of St Andrews, North
Haugh, KY16 6SS, St Andrews, UK
17 Gemini Observatory, Casilla 603, La Serena, Chile
18 Gemini Observatory, 670 North A’ohoku Place, Hilo, HI 96720,
USA
19 Durham University, Stockton Road, Durham, DH1 3LE, UK 20 Astronomy Department, University of California, Berkeley CA
94720, USA
21 Large Synoptic Survey Telescope, 950N Cherry Av, Tucson AZ
85719, USA
22 Center for Astrophysics and Space Science, University of California
San Diego, La Jolla, CA, 92093, USA
23 Kavli Institute for Particle Astrophysics and Cosmology, Stanford
University, Stanford, CA 94305, USA
24 Department of Astrophysics, American Museum of Natural History,
New York, NY 10024, USA
25 NASA/Armstrong Flight Research Center, 2825 East Avenue P,