www.wjpr.net Vol 4, Issue 07, 2015.
763
FORMULATION AND EVALUATION OF LIQUISOLID COMPACT OF
EPROSARTAN MESYLATE
Shinkar Dattatraya Manohar1*, Ghule Arpan Ramakrishna2, Saudagar Ravindra Bhanudas2
1
Department of Pharmaceutics, KCT’S RGS College of Pharmacy, Anjaneri,
Nashik.422213.Maharashtra, India.
2
Department of Pharmaceutical Chemistry, KCT’S RGS College of Pharmacy, Anjaneri,
Nashik.422213.Maharashtra, India.
ABSTRACT
Liquisolid technique is a new approach for delivery of drugs through
oral cavity. This technique is suitable for poorly or water insoluble
drugs and also for immediate or sustained release formulations. The
technique is based upon the admixture of drug loaded solutions or
liquid drug with appropriate carrier and coating materials to convert
into acceptably flowing and compressible powder. Addition of
additives improves the technique. The selection of non-toxic
hydrophilic solvent, carrier, coating excipients and its ratios are
independent of the individual chemical entities. Indirectly its leads to
enhancement of Bioavaibility. Liquisolid tablet of drug EPM were
prepared by using PEG-400, as non volatile liquid vehicle and Avicel
PH 102, Aerosil 200 as carrier and coating materials, CCS as
superdisintigrant respectively.EPM is BCS class 2 drugs which is
having poor water solubility and Bioavaibility (13%), so it is suitable for Liquisolid
technique. Also EPM is having daily dose 400-800mg which is high to give at once so to
reduce the dose we prepared the sustained release tablet which reduce the dose and also give
the sustained drug release.FTIR and DSC studies reveals that there was no possible
interaction between drug and tablet excipients. All the formulation was evaluated for
disintegration time, hardness and friability time, in-vitro dissolution study.
KEYWORD: Eprosartan mesylate (EPM), Liquisolid, PEG 400, Aerosil 200, Avicel 102.
Volume 4, Issue 7, 763-782. Research Article ISSN 2277– 7105
Article Received on 30 April 2015,
Revised on 20 May 2015, Accepted on 07 June 2015
*Correspondence for Author Shinkar Dattatraya Manohar Department of pharmaceutics, KCT’S
RGS College of
pharmacy, Anjaneri,
Nashik.422213.Maharasht
www.wjpr.net Vol 4, Issue 07, 2015.
764 INTRODUCTION
The simplest and easiest way of administering drugs is oral drug delivery.[1] Because of the greater stability, smaller bulk, accurate dosage and easy production, solid oral dosages forms
offers many advantages over other types of oral dosage forms. Therefore, most of the new
chemical entities (NCE) under development these days are intended to be used as a solid
dosage form originating an effective and reproducible in vivo plasma concentration profile
after oral administration[2] In fact, most NCEs are poorly aqueous soluble drugs, hence not well-absorbed after oral administration[3] which can detract from the drug’s inherent
efficacy[4] Moreover, most promising NCEs, instead of their high permeability, are usually only absorbed in the upper small intestine, absorption being reduced significantly after the
ileum, showing, therefore, that there is a small absorption window[5] Consequently, the incomplete release of these drugs in the gastrointestinal area will show low bioavailability
problems[5] Therefore, one of the major current challenges of the pharmaceutical industry is related to tactics that improve the aqueous solubility of drugs. Drug release is a crucial and
rate limiting step for oral bioavailability, particularly for drugs with low solubility and high
permeability i.e. BCS class II drugs. By improving the drug release profile of BCS class II
drugs, it is possible to enhance their bioavailability and reduce side effects[4] Liquisolid technique is one of the most promising strategies to improve drug release of poorly soluble
drugs. Liquisolid technique (LST) can be defined as the technique in which the non volatile
solvent can be used to dissolve solid drug in it which help to enhance the solubility of poorly
water soluble drugs.
Liquisolid Technique[1]
Many techniques are being employed for the solubility enhancement of poorly soluble drugs
to resolve the bioavailability issue due to inadequate dissolution rate. Various approaches
make use of hydrophilic polymers as solubility enhancers acting through a variety of
mechanisms such as amorphization, co-solvency, and micelle formation or inclusion
complexes. These techniques impart many advantageous effects in the formulation
development. But usually these approaches show lack of stability and decreasing success rate
over a period of storage. One of the remarkable demerits of solid dispersions, glass solutions,
eutectic mixtures and inclusion complexes is formation of sticky and hygroscopic mass
www.wjpr.net Vol 4, Issue 07, 2015.
765 The Liquisolid technology emerged as a new drug delivery system distinguished by its
characteristics and ability to deliver variety of drugs. Liquisolid drug delivery system has
gained attention of pharmaceutical researchers due to its contribution in the solubility
enhancement as well as dissolution retarding approaches depending on the need and design of
the formulation. With the Liquisolid technology as described and patented by Spireas[3,4] a liquid may be transformed into a free flowing, readily compressible and apparently dry
powder by simple physical blending with selected excipients. Three major components in the
formulation of Liquisolid compacts are liquid medication, carrier and coat material. Other
excipients such as use of disintegrant or release retarding polymers for modification of
release profile are used as per the objective and need of the formulation.The first component
i.e. liquid medication can either be a liquid drug, a drug suspension or a drug solution in
suitable non-volatile liquid vehicles. Inert, preferably water-miscible organic solvent systems
with high boiling point such as propylene glycol, liquid polyethylene glycols or glycerin are
best suitable as „liquid vehicle‟. The Solubilization of the drug in a non-volatile solvent
keeps the drug in uniformly and molecularly dispersed form. This creates opportunity to
enhance the drug release. The liquid medication is incorporated into the second component of
the system i.e. the porous carrier material. Once the carrier is saturated with liquid, a liquid
layer is formed on the particle surface which is instantly adsorbed by the third component i.e.
coat materials. Thus, an apparently dry, free flowing and compressible powder is obtained.
Usually, microcrystalline cellulose is used as carrier material[1,2] The third component i.e. coat material avoids the re-aggregation of the Liquisolid particles and imparts higher flow
characteristics. The coating also assists the dry-looking character of the system. Many times,
amorphous silicon dioxide (colloidal silica) is used as coating material. The concept of
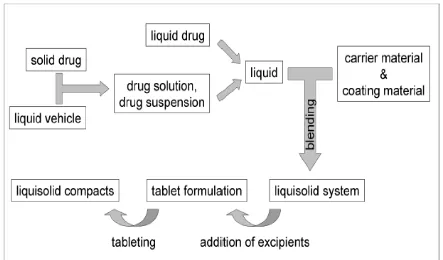
Liquisolid technology is depicted in Fig.1.Liquisolid formulation containing a drug solution
or drug suspension of poorly soluble drugs in a solubilizing vehicle shows enhanced drug
release due to increased surface area of drug available for release, increased aqueous
solubility of the drug by co-solvency and improved wettability of the drug particles[4,5] Accordingly, this improved drug release may result in a higher drug absorption in the
www.wjpr.net Vol 4, Issue 07, 2015.
766 Fig.1: Concept of Liquisolid formulation
MATERIALS AND METHOD[4,5,6]
COMPONENTS OF LIQUISOLID SYSTEM
The major formulation components of Liquisolid compacts are
1. Carrier Material
The carrier material should possess porous surface and closely matted fibers in the interior.
Carriers are involved in the sorption process of liquid medication which improves the
effective surface area for dissolution. These also assist the compression. Carriers due to
relatively large, preferably porous particles, possess a sufficient adsorption property and
matted fibers in interior contribute in absorption of liquid medication. e.g. various grades of
cellulose, starch, lactose, sorbitol etc.
2. Coating Material
Coating material forms a uniform film around the particles of carrier. Thus they prevent the
aggregation of particles as well as reduce the inter-particulate friction. This phenomenon
improves the flowability as well as gives the Liquisolid a dry-looking appearance by covering
the wet carrier particles and by absorbing any excess liquid. Coat materials are usually very
fine (10 nm to 5,000 nm in 149 diameter) and highly adsorptive coating particles e.g.
www.wjpr.net Vol 4, Issue 07, 2015.
767 3. Non-Volatile Solvent
The solvent selected should possess ability to dissolve adequate amount of the drug
candidate. Inert, preferably water-miscible and not highly viscous organic solvent systems
having high boiling point e.g. propylene glycol, liquid polyethylene glycols, polysorbate,
glycerin, N, N-dimethylacetamide; fixed oils etc. are the suitable vehicles.
4. Disintegrant
The use of disintegrant, its type and concentration in the formulation will be mainly based on
the objective of the investigation. For solubility enhancement studies, incorporation of
super-disintegrant is encouraged. Most commonly used super-disintegrant is sodium starch glycolate
(Explotab13, Pumogel etc.). While for matrix type of systems intended for sustained release,
disintegration is not required.[4]
METHOD OF PREPARATION OF LIQUISOLID SYSTEM
As shown in figure 1, a liquid drug can be converted into a dry-looking Liquisolid system
without being further chemically modified. If Liquisolid system of a solid water-insoluble
drug is to be formulated, it should be initially dissolved or suspended in a suitable
non-volatile solvent system to produce a drug solution or drug suspension of desired
concentration.
Next, a certain amount of the prepared drug solution or suspension or a liquid drug itself is
incorporated into a specific quantity of carrier material which should be preferably of a
porous nature and possessing sufficient absorption properties. The resulting wet mixture is
then converted into a dry-looking, non adherent, free-flowing and readily compressible
powder by the simple addition and mixing of a calculated amount of coating material.
Excipients possessing fine and highly adsorptive particles are suitable for this step.
Before compression or encapsulation, various adjutants like lubricants and disintegrant
(immediate release) or binders (sustained release) may be added to final Liquisolid system to
www.wjpr.net Vol 4, Issue 07, 2015.
[image:6.595.79.522.76.336.2]768 Fig. 2: General Method of Preparation of Liquisolid Systems
Solubility study
To select the best non volatile solvent for suspending of Eprosartan mesylate in liquid
medication, solubility study of Eprosartan mesylate were carried out in five different non
volatile solvent i.e. PEG 200,PEG 400,glycerin,polysorbate 80 and propylene glycol.
Saturated solution of Eprosartan mesylate were prepared by adding drug in excess amount to
the vehicle and shaking on shaker for 48 hr at 25 0 c under constant vibration. After this period the solution were filtered ,diluted with distilled water (at least 1000 times)and
analysed by UV spectrophotometer at a wavelength of 234 nm.Three determination were
carried out for each sample to calculate the solubility of Eprosartan mesylate.
In-vitro drug release studies
In-vitro dissolution studies for the prepared Liquisolid matrix tablets were conducted for a
period of 12 h using a six station (1) USP XXII type II apparatus (Lab India Disso 2000
system, India) at 37 0C and 50 rpm speed. The dissolution studies were carried out in triplicate for 2 h in pH 1.2 medium (900 ml) and then the media was replaced to pH 7.4 at 37
0
C for 12 h. Samples were collected at specific time intervals and assayed by a UV
spectrophotometer (Elico, Model SL-150, Mumbai, India) at a wavelength of 269 nm. The
experiments were repeated thrice and the results were taken as an average of three test
www.wjpr.net Vol 4, Issue 07, 2015.
769 with the help of appropriate calibration curves constructed from reference standards. During
the drug release studies, the formulations were observed for physical integrity at different
time intervals.[17-20]
Preparation of Liquisolid based Matrix tablet
Calculated quantities of Eprosartan mesylate and PEG 400 were accurately weighed in a 20
ml glass beaker and then heated to 80 0 C resulting in hot medication. then incorpoted the calculated quantities of carrier(Q) and coating material(q).Mixing process is carried out in
three step s as described by Spireas et al.Firstly, the system was blended at an approximately
mixing rate of one rotation per second for approximately 15-20 min,in order to evenly
distribute liquid medication in the powder. Then secondly, the liquid/powder admixture were
evenly spread as a uniform layer on the surface of a morter and left standing approximately
for 5 min to allow the drug solution to be absorbed inside powder particles. In the third step,
the powder was scraped off the mortar surface using an aluminum spatula. Then carrier and
coating material was added in formulation. After that HPMC and Crosspovidone was added
in required amount as per formulation. This provided the final formulations that was
compressed into tablets, which gives the Liquisolid based matrix tablets, by compressing
using an 12 mm diameter single punch tablet compression machine.[12-14]
Physical tests for the prepared matrix tablets
Ten tablets from each formulation were taken for measurement of diameter and crown
thickness with vernier calipers and an average of ten determinations was carried out.
Hardness of the Liquisolid matrix tablets was evaluated by using hardness tester (Pfizer) and
mass determination was performed for twenty tablets from each batch and average values
were calculated. Friability of the Liquisolid matrix tablets was determined by first weighing
10 tablets after dedusting and placing in a friability tester
(Rochefriabilator,Pharmalabs,Ahmedabad, India),which was rotated for 4 min at 25 rpm.
After dedusting, the total remaining weight of the tablets was recorded and the percent
Friability was calculated. The drug content of the prepared tablets of each batch was
determined in triplicate.[9]
Characterization of release data
The description of dissolution profiles has been attempted using different release models. The
data were evaluated according to the following equations.
www.wjpr.net Vol 4, Issue 07, 2015.
770 First order: ln Mt ¼ ln M0 þ K1t
Higuchi model: Mt ¼ KH
Kerseymere Peppas model: Mt=M0 ¼ Kktn
where Mt is the amount of drug dissolved in time t, M0 the initial amount of drug, K1 is the
first order release constant, K0 the zero order release constant, KH the Higuchi rate constant,
Kk the release constant and n is the diffusion release exponent indicative of the operating
release mechanism. The correlation coefficient (r2) was used as an indicator of the best
fitting, for each of the models considered.[7,8]
FT-IR spectroscopy
The prepared Liquisolid compacts were subjected to FT-IR analysis by the following method,
an approximately minimum quantity (less than 4 mg) of sample was thoroughly blended with
adequate quantity of IR grade KBr (less than 100 mg) in mortar. The mix was then made into
KBr pellets by hydraulic compression (Perkin Elmer). Then the samples were analyzed
between wave numbers 4000 and 400 cm-1.
X – Ray powder diffraction
X-ray diffractometry of drug, excipients and formulation were performed using Siemens
Diffractometer. The cross section of sample was exposed to X ray radiation with wavelength
of 1.5605 A. The rate of the scanning was 0.6 0 /min at the range of 5-20 2Ø.samples, ground into powder with an agate morter and pestle were measured on a low background quartz plate
in aluminium holder.
Differential scanning calorimetry
Thermogram of the samples (Eprosartan mesylate, excipients and liquisolid formulation)
were recorded on a DSC 60 (shimadzu Japan).samples (3-5 mg ,accurately weight to 0.1mg )
were placed in aluminium pans and the lids were crimped investigated under nitrogen gas at
scanning rate of 10 0 c / min covering a temperature range of 30-300 0 c.The instrument was calibrated with an indium standard.
Stability studies
Stability studies were conducted on F4 formulation made of PEG 400 to assess their stability
with respect to their physical appearance, drug content and drug release characteristics after
www.wjpr.net Vol 4, Issue 07, 2015.
771 Statistical analysis
In-vitro release data of EPM from the Liquisolid matrix tablets (F4) and the matrix tablet
formulations were subjected to the one-way analysis of variance (ANOVA) at different time
intervals of drug release upto 12 hr.
RESULTS AND DISCUSSION
It is suggested here that Liquisolid technique has the potential to be optimized for the
reduction of drug dissolution rate and thereby production of sustained release systems. The
objective of the present work is to prepare Liquisolid based formulations of Eprosartan
Mesylate (EPM), an antihypertensive drug which has biological half life of 5-9 h and PKa
values 4.32 and 8.95, with good gastrointestinal absorption, which makes it an ideal
candidate for sustained drug delivery. The Liquisolid matrix tablets of EPM were prepared
by using release retarding polymer HPMC along with PEG 400, carrier (MCC) and coating
materials (Aerosil) in the matrix Core. In order to prepare SR tablets of EPM, direct
compression technique was applied.
Determination of solubility
The solubility of Eprosartan mesylate in non volatile solvent glycerin, PEG 400, PG and
polysorbate 80 was determined .The solubility of EPM was 0.0321mg/ml,0.0896 mg/ml,
0.0697 mg/ml and 0.0215 mg/ml respectively. The data indicates that EPM has lowest
solubility in polysorbate 80 and having highest solubility in PEG 400 .since the aim of this
study was to enhanced the dissolution rate of EPM,hence PEG 400 was exploited as a
non-volatile solvent in preparation of liquisolid compact.
Preparation of liquisolid based matrix tablets
To obtain a retardation property for liquisolid matrices, on the release of EPM, a binary
mixture of carrier and coating materials Avicel 102 as the carrier and Aerosil 200 as coating
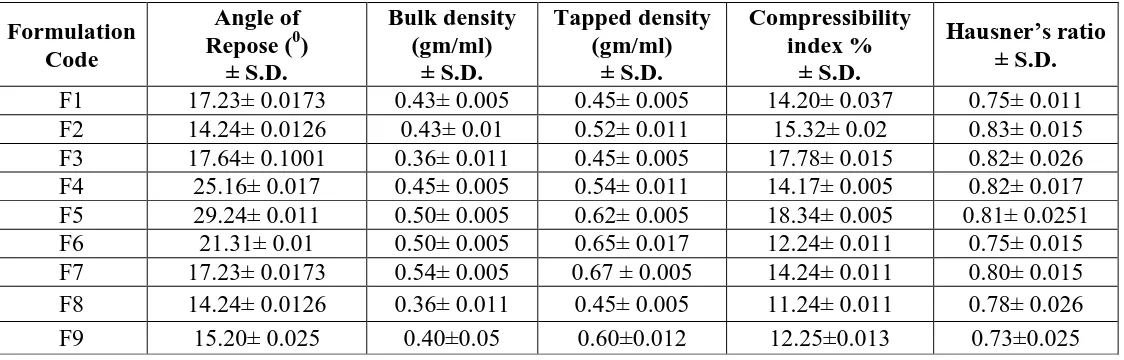
material was added to the liquid medication. The formulations indicate good flow properties
(table1).The liquisolid matrix tablet were prepared by direct compression. The
Precompression blend was characterized with respect to angle of repose, bulk density, tapped
density, carr’s index and Hausner’s ratio are within the limits.carr’s index values were found
to be in between 10% and 16%, for the Precompression blend of all the formulations
www.wjpr.net Vol 4, Issue 07, 2015.
772 EPM was selected as model drug for this study as a suitable candidate for sustained release.
Liquisolid hypothesis of Spireas et al states that drug candidate dissolved in liquid non
volatile solvent and incorporated into carrier material having porous structure and closely
matter fibers in its interior, phenomenon of both adsorption and absorption occurs. Here EPM
in the form of liquid medication is absorbed initially in the interior of particles of carrier and
after saturation of this process it gets adsorbed into internal and external surface of carrier.
Coating material such as Aerosil 200 which has high absorptivity and greater surface area
lead the liquisolid systems desirable flow properties.
Evaluation of liquisolid based matrix tablet
The prepared tablets were evaluated for physical parameters such as hardness, thickness,
friability, weight variation and drug content. The result are shown in table 3, the mean values
of hardness for the prepared tablets were in the range of 1.96 ± 0.05-2.91±0.15 kg/cm2.All the tablet passed friability test, as the loss of tablet material was less than 1%,indicating that
tablets prepared were of sufficient strength. The thickness of prepared tablets were ranked
from 6.33-6.96mm.The matrix tablet and also satisfied the drug content as they contained
92.5±0.05% - 96.5±0.12% of EPM indicating the uniform mixing of the drug and
excipients.Hence,it attributes that the prepared tablets were found be practically within the
limits.
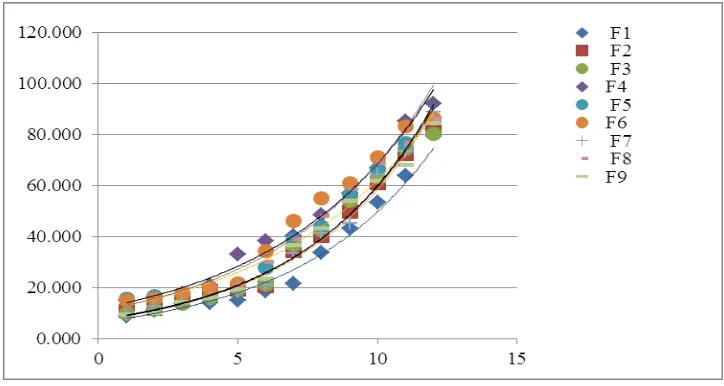
In vitro drug release study of EPM liquisolid tablet
The in vitro release studies were carried out for formulations in both PH 1.2 and PH 6.8
media and the release profile is shown in fig. .The amount of drug release in PH 1.2 in 2 hr
for EPM based liquisolid matrix tablets (F1, F2and F3) was 10.87±0.05, 11.75±0.04 and
11.49±0.02 respectively. Also after 12 hr the drug release was 71.80±0.05, 64.04±0.02 and
66.22 ±0.03 respectively. The liquisolid formulation (F4 and F7) batch shows the highest
drug release in 12hrs which is 81.20±0.05 and 80.71 ±0.03 respectively, remaining batches
shows the less drug release which shown in fig. .The correlation coefficient (r2) for the zero order release was found to be higher 0.9337,when compared to that of first order kinetic was
0.8113 indicating that the drug release from liquisolid tablet follows zero order. The results
are shown in table 6.In that result batch F4&F7 follows zero order kinetics. Table 4 shows
www.wjpr.net Vol 4, Issue 07, 2015.
773 korsemayer et al shows that liquisolid tablet follows fickian diffusion (F4 &F 7)and the other
follows non fickian diffusion, as the diffusion coefficient ‘n’ value was found to be less than
0.5 and greater than 0.5 respectively (table 6).it is evident from this data that, as MCC along
with Aerosil as coating material shows retardation of the drug release from the matrix core;
improved zero order of EPM release.
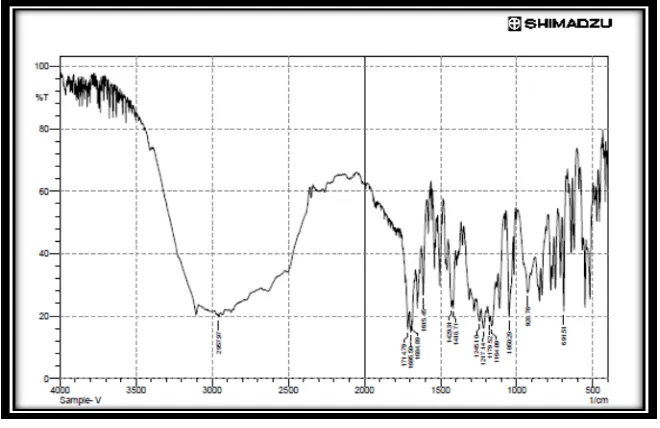
FT-IR studies
Fig. 1 shows peaks of Eprosartan mesylate at 460.18, 14,153.26, 2919.43 cm_1 (CeH bands
of absorption) 1101.52 and 1288.59 cm_1 (CeN bands of absorption) and 1764.11 cm 1(C] O
bands of absorption). The similar peaks were also found in the formulation F4 Fig. 2. In case
of formulations F7 and F3 1289.28 and 1289.31 cm_1 which shows the characteristic bands
of the ester groups as well as the C]O ester vibration at 1734.63 and 1734.61 cm_1. It may be
due to CHX vibrations can be discerned. The peaks at 2926.11 and 2938.13 cm_1 can be
assessed due to the dimethylamino groups. Hence the study indicates that there was no
Interaction between drug-excipients used in the study.
Stability studies
At the end of testing period, the liquisolid based matrix tablets (F4) were observed for
changes in physical appearance, analyzed for drug content and subjected to in-vitro drug
Release studies. The resulted data was shown in fig.5 the drug content was found to be 96.75
- 0.12% at the end of 12 h of dissolution testing. The percentage of EPM released from the
formulation (F4) before storage was 81.56 - 0.49%, where as that released after storage was
82.45 - 0.44%. There is no significant difference in the mean percentage of drug released
from formulation F4 after storing for 6 months at 40 0 2 -C/75 -25% RH.
Statistical analysis
Analysis of variance (single factor ANOVA) showed a significant difference (P < 0.05) for
www.wjpr.net Vol 4, Issue 07, 2015.
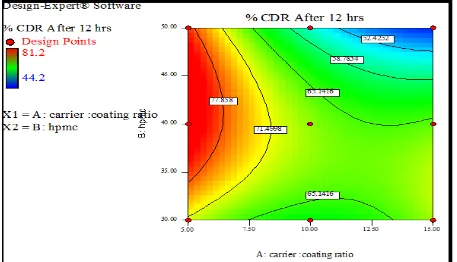
[image:12.595.71.529.69.357.2]774 Fig. 6: Surface response plot showing effect of Carrier: Coating ratio and HPMC on % CDR
[image:12.595.70.527.420.682.2]www.wjpr.net Vol 4, Issue 07, 2015.
775 The purpose of using 32 full factorial designs was to conduct comprehensive study of effect of process parameters like carrier: Coating ratio (X
1) and HPMC(X2) and their interactions using a suitable statistical tool (Design expert software version 9.0.2.0) by applying one way
ANNOVA at 0.05 levels. Mathematical modelling was carried out. Polynomial equation was
obtained depending on significant influences among 2 factors on their experimental design.
The influence of the main effects on responses was further elucidated by response surface
methodology. It is widely used tool in the development and design of the dosage form. The
three dimensional response surface plot and corresponding two dimensional contour plots
were generated by the software. The response surface plot is very useful for determination of
the main and interaction effects of the independent variables whereas two dimensional plots
give visual representation of values of responses. In case of In vitro drug release the three
dimensional response surface plot depicted the increase in drug release as polymer after
generating model equations relating main effects and responses; various tablet formulations
containing metoprolol succinate were optimized based on In vitro drug release (Y1),
sustained release effect (Y2), Bioavaibility(Y3). The optimal values for responses were
obtained by numerical analysis based on the criteria of desirability, and optimal batch was
selected. Optimized batch was having highest drug release, good sustained release effect and
increased Bioavaibility. This reveals that mathematical model obtained by factorial design to
produce optimized responses was well fitted shown in fig.6&7.
Table No. 6: Model Fitting For Batchs of EPM Liquisolid tablet Formulations Atenolol
Batches
Zero Order
First
Order Higuchi
Hixson Crowell
Korsmeyer-Peppas
R2 R2 R2 R2 R2 n-value
F1 0.873 0.775 0.766 0.818 0.812 0.878
F2 0.919 0.825 0.825 0.930 0.854 0.879
F3 0.931 0.853 0.842 0.956 0.862 0.930
F4 0.933 0.811 0.858 0.916 0.880 0.743
F5 0.923 0.838 0.829 0.973 0.8092 0.750
F6 0.932 0.916 0.881 0.900 0.841 0.793
F7 0.906 0.796 0.809 0.619 0.852 0.921
F8 0.923 0.879 0.884 0.623 0.905 1.002
F9 0.917 0.867 0.862 0.513 0.881 0.944
From the above table it is seen that the best fit model for formulation is Zero order kinetic,
www.wjpr.net Vol 4, Issue 07, 2015.
[image:14.595.116.478.71.264.2]776 Fig.8 In vitro drug release study (F1-F9)
Table 7: Comparison of % CDR for stability study
Time (hrs)
% CDR Before
Stability Study After 30 Days After 60 Days After 90 Days
1 14.86 14.82 14.83 14.85
2 16.39 16.33 16.31 16.35
3 17.93 17.90 17.93 17.92
4 21.13 21.09 21.11 21.12
5 33.29 33.24 33.26 33.28
6 38.62 38.60 38.58 38.62
7 39.96 39.94 39.96 39.95
8 44.37 44.36 44.33 44.35
9 53.10 53.09 53.10 53.11
10 62.74 62.72 62.71 62.74
11 74.57 74.56 74.58 74.57
12 82.14 82.12 82.11 82.13
Results of the stability studies showed that there is no change in the physical parameters of
the formulation. Drug content of the formulation was also found to be same as that before
stability testing. Stability data is shown in table 5 the purpose of using 32 full factorial design was to conduct comprehensive study of effect of process parameters like Aerosil 200: MCC
Ratio (X
1) and HPMC (X2) and their interactions using a suitable statistical tool (Design expert software version 9.0.2.0) by applying one way ANNOVA at 0.05 levels. Mathematical
modelling was carried out. Polynomial equation was obtained depending on significant
influences among 2 factors on their experimental design. The influence of the main effects on
responses was further elucidated by response surface methodology. It is widely used tool in
[image:14.595.72.523.322.546.2]www.wjpr.net Vol 4, Issue 07, 2015.
777 and corresponding two dimensional contour plots were generated by the software. The
response surface plot is very useful for determination of the main and interaction effects of
the independent variables whereas two dimensional plot gives visual representation of values
of responses. In case of In vitro drug release the three dimensional response surface plot
depicted the decrease in drug release as polymer after generating model equations relating
main effects and responses, various gel formulations containing metoprolol succinate were
optimized based on In vitro drug release (Y1), Viscosity (Y2), Mucoadhesive strength (Y3).
The optimal values for responses were obtained by numerical analysis based on the criteria of
desirability, and optimal batch was selected. Optimized batch was having highest drug
release, optimal viscosity and mucoadhesive strength. This reveals that mathematical model
[image:15.595.133.463.320.534.2]obtained by factorial design to produce optimized responses was well fitted.
Fig.1 FTIR Spectrum of E
Table 1: solubility of Eprosartan mesylate in various solvents
Solvent Solubility (g/100ml)
Propylene glycol 6.97
PEG 200 4.85
PEG 400 8.96
Glycerin 3.21
[image:15.595.153.442.589.681.2]www.wjpr.net Vol 4, Issue 07, 2015.
[image:16.595.19.581.97.277.2]778 Table 2. Physical Characterization of Prepared Liquisolid compact
Table 3.Physico- chemical characterization of sustained release Eprosartan mesylate matrix tablet
Formulation
code Mass (mg)
Hardness
(kg/cm2) Thickness(mm)
Friability (%)
Drug content (%)
F1 664.1± 0.01 1.96±0.05 6.33 0.140±0.012 92.5±0.71
F2 934.2±0.02 2.01±0.12 6.85 0.151±0.042 94.2±0.71
F3 1232±0.03 2.61±0.12 6.94 0.220±0.023 96.3±1.58
F4 674.1±0.01 2.05±0.10 6.35 0.312±0.015 94.4±2.05
F5 944.2±0.02 2.56±0.05 6.86 0.407±0.35 91.4±1.8
F6 1242±0.03 2.72±0.07 6.92 0.434±0.031 92.3±1.21
F7 684.1±0.01 2.15±0.13 6.40 0.212±0.021 96.5±1.56
F8 954.2±0.02 2.60±0.20 6.84 0.302±0.02 93.2±1.84
F9 1252±0.03 2.91±0.15 6.96 0.354±0.015 91.3±1.03
Table 4.Formulation design of liquisolid based matrix tablet of Eprosartan mesylate Solubility Study
Formulation code
Drug
+solvent (%) R Lf
Coating Q(mg) Carrier q(mg) HPMC (%) Total wt (mg)
F1 10 5 0.652 306.7 61.34 30 628.04
F2 10 10 0.326 613.49 61.34 30 934.83
F3 10 15 0.217 912.65 61.34 30 1242.9
F4 10 5 0.652 306.7 61.34 40 648.04
F5 10 10 0.326 613.49 61.34 40 954.83
F6 10 15 0.217 912.65 61.34 40 1262.9
F7 10 5 0.652 306.7 61.34 50 668.04
F8 10 10 0.326 613.49 61.34 50 974.83
F9 10 15 0.217 912.65 61.34 50 1284.9
Formulation Code
Angle of Repose (0)
± S.D. Bulk density (gm/ml) ± S.D. Tapped density (gm/ml) ± S.D. Compressibility index % ± S.D. Hausner’s ratio ± S.D.
F1 17.23± 0.0173 0.43± 0.005 0.45± 0.005 14.20± 0.037 0.75± 0.011
F2 14.24± 0.0126 0.43± 0.01 0.52± 0.011 15.32± 0.02 0.83± 0.015
F3 17.64± 0.1001 0.36± 0.011 0.45± 0.005 17.78± 0.015 0.82± 0.026
F4 25.16± 0.017 0.45± 0.005 0.54± 0.011 14.17± 0.005 0.82± 0.017
F5 29.24± 0.011 0.50± 0.005 0.62± 0.005 18.34± 0.005 0.81± 0.0251
F6 21.31± 0.01 0.50± 0.005 0.65± 0.017 12.24± 0.011 0.75± 0.015
F7 17.23± 0.0173 0.54± 0.005 0.67 ± 0.005 14.24± 0.011 0.80± 0.015
F8 14.24± 0.0126 0.36± 0.011 0.45± 0.005 11.24± 0.011 0.78± 0.026
www.wjpr.net Vol 4, Issue 07, 2015.
[image:17.595.138.461.101.179.2]779 Table 5. Solubility Study of EPM with different solvent
[image:17.595.95.484.209.438.2]Fourier Transform Infrared Spectroscopy Study of Liquisolid compact
Fig.2 FTIR Spectra of EPM Liquisolid compact
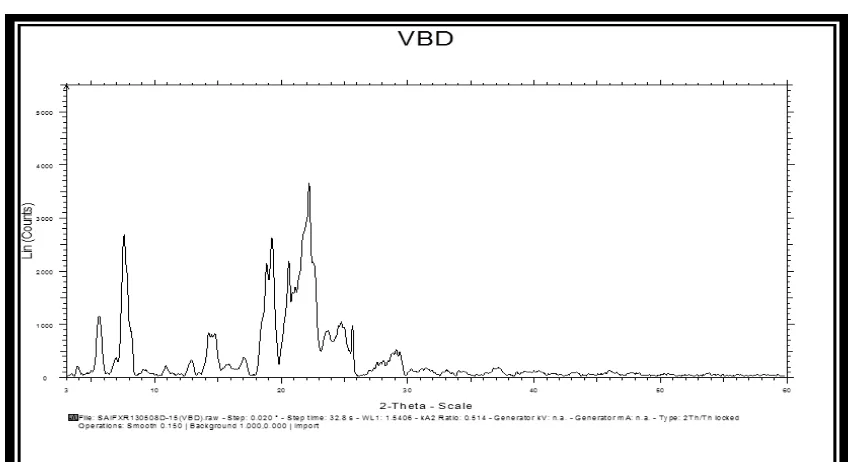
Powder X-Ray Diffraction
Fig.3 PXR-Diffractogram of EPM
Sr. No. Formulation Solubility (μg/ml) ± S.D.
1. Pure drug 0.020±0.0015
2. EPM:PEG 400 0.819±0.002
3. EPM:PG 0.521±0.002
[image:17.595.84.508.492.723.2]www.wjpr.net Vol 4, Issue 07, 2015.
780 Differential Scanning Calorimetry
Fig.4 DSC thermograph of EPM
Fig.5 in vitro drug dissolution profile of liquisolid based tablet (F4)
CONCLUSION
An attempt was made successfully to enhance the dissolution rate of tablets prepared from
Eprosartan mesylate Liquisolid compact using carriers(MCC) ,coating (Aerosil 200) and non
volatile solvent (PEG 400). The Liquisolid compacts prepared were evaluated for physical
characterization, FTIR, DSC, and PXRD.The optimized Liquisolid compact was formulated
into tablet. The prepared tablet was subjected for pre and post compression evaluation. The
following conclusion can be drawn from the present study, Phase solubility analysis aided the
selection of optimized ratio of Liquisolid compact for each solvent. Out of which EPM: PEG
400 (10%) showed the highest solubility i.e. 0.819 µg/ml, as compared to pure drug having
www.wjpr.net Vol 4, Issue 07, 2015.
781 EPM increases with increasing pH i.e. in PBS pH 6.8 drug shows solubility of 40 µg/ml.The
entire Liquisolid compact showed excellent flow property. Compressibility index of
Liquisolid compact was fair.FTIR studies of LC indicated the formation of hydrogen bond
between EPM and PEG 400 on contrary MCC and SSG did not reveal any significant
interaction.PXRD studies showed crystallinity of EPM owing to a strong peak at 2θ of 22.14.
No such peak was observed in batch F 4 of PEG 400 indicating presence of amorphous EPM.
On contrary MCC, Aerosil and SSG could not cause amorphization. DSC studies revealed
that MCC and Aerosil were capable of forming stable amorphous LC, where as HPMC
and SSG formed complexes containing crystalline EPM but of reduced crystallinity.Stability
studies indicated that prepared tablets of Liquisolid compact did not show any significant
change in physical appearance, % drug content and dissolution rate.The prepared solubility
enhanced Eprosartan mesylate Liquisolid tablet formulation fulfils all the necessary
parameters required for the oral administration. The F 4 and F 7 Batch having highest
solubility and dissolution rate may improve significant bioavailability after oral
administration of solubility enhanced EPM in tablet formulation and can be alternative to
conventional dosage form.
REFERENCES
1. Spireas SS and Sadu S. Enhancement of prednisolone dissolution properties using
Liquisolid compacts. Int J Pharm, 1998; 166: 177–188.
2. Khaled et. al. Formulation and evaluation of hydrochlorothiazide Liquisolid tablets.
Saudi J Pharm., 2001; 222: 1-6.
3. Spireas et. al. Effect of powder substrate on the dissolution properties of
methchrothiazide Liquisolid compacts. Drug Dev Ind Pharm, 1999; 25: 163–168.
4. Spireas SS. Theoretical and practical aspects of Liquisolid compacts, PhD Thesis, St.
John’s University, New York.1993.
5. Spireas et. al. Powdered solution technology: principles and mechanism. Pharm Res.,
1992; 9: 1351–1358.
6. Louis et. al. Improvement of dissolution properties of Carbamazepine through
application of the Liquisolid tablet technique. Eur J Pharm Biopharm. 2008; 69: 342–347.
7. Spireas et al. In vitro release evaluation of hydrocortisone Liquisolid tablets. J Pharm
Sci, 1998; 87: 867–872.
8. Ansel et. al. Pharmaceutical Dosage Forms and Drug Delivery Systems, Lippincott
www.wjpr.net Vol 4, Issue 07, 2015.
782 9. Patil Dhanashree Sanjay, Magar Deepak, and Saudagar Ravindra Bhanudas, Liquisolid
technology: technique for formulation with enhanced bioavailability, A Review, wjpps,
2013; 3(1): 368-387.
10. Kaur M, Bala R, AroraS. Liquisolid technology: A review. An International Journal of
Advances in Pharmaceutical Sciences, 2013; 4(1): 1-15.
11. Ahmed S. Abdul Jabber and Ahmed A. Hussein. Formulation and evaluation of
piroxicam Liquisolid compacts, International Journal of Pharmacy and Pharmaceutical
Sciences, 2013; 5(1): 132-141
12. Kaur M, Bala R, AroraS. Liquisolid technology: A review. An International Journal of
Advances in Pharmaceutical Sciences, 2013; 4(1): 1-15.
13.Noyes A. A., Whitney W. R., The rate of solution of solid substances in their own
solutions, journal of American Chemical Society., 1897; 19: 930-934.
14.Galia E., Nicolaides E., Hoerter D., Reppas C., Dressman J. B., Evaluation of various
dissolution media for predicting invivo performance of class I and II drugs,
pharmaceutical Research, 1988; 15: 698-705.
15.Hancock B. C., Zogra G., Characteristics and significance of the amorphous state in
pharmaceutical systems Review, Journal of Pharmaceutical Science, 1997; 86: 1-12.
16.Horter D., Dressman J. B., Influence of physicochemical properties on dissolution of
drugs in gastrointestinal tract Review, Advance Drug Delivery Review, 1997; 25: 3-14.
17.Goldberg A.H., Gibaldi M., Kanig J.L., Increasing dissolution rates and gastrointestinal
absorption of drugs via solid solutions and eutectic mixtures II- experimental evaluation
of a eutectic mixture: urea-acetaminophen system, Journal of Pharmaceutical Science,
1966; 55: 482-487.
18.Amidon G.L., Lennernas H., Shah, Crison V.P., J.R., A theoretical basis for a
biopharmaceutics drug classification: the correlation of in vitro drug product dissolution
and in vivo bioavailability. Pharmaceutical Research, 1995; 12: 413–420.
19.FDA,(2000) Guidance for Industry, Waiver of in vivo bioavailability and bioequivalence
studies for immediate-release solid oral dosage forms based on a Biopharmaceutics
classification system. Available at:
http://www.fda.gov/downloads/Drugs/GuidanceComplianceRegulatoryInformation/Guida
nces/ucm 070246.pdf (Last accessed August 2012).
20.Artursson P., Palm, K., Luthman K., Caco-2 monolayers in experimental and theoretical