Journal Name
ARTICLE
This journal is © The Royal Society of Chemistry 20xx J. Name., 2013, 00, 1-‐3 | 1
Please do not adjust margins
Please do not adjust margins
Received 00th January 20xx,Accepted 00th January 20xx
DOI: 10.1039/x0xx00000x
www.rsc.org/
Controlling the Emission Efficiency of Blue-‐Green Iridium(III)
Phosphorescent Emitters and Applications in Solution-‐Processed
Organic Light-‐Emitting Diodes
Muhammad T. Sajjad,a Nidhi Sharma,a,b Amlan K. Pal,b Kamrul Hasan,c,d Guohua Xie,a Lisa S. Kölln,a Garry S. Hanan*,c Ifor D. W. Samuel*a and Eli Zysman-‐Colman*b
We show that the emission efficiency of blue-‐green phosphorescent emitters can be controlled through coupling of the excited state to vibrational modes. We controlled this vibrational coupling through choice of different ligands and as a result, complexes with CF3-‐groups on the ancillary ligand were essentially non-‐
emissive (ΦPL < 1%), whereas with isosteric CH3-‐groups the complexes were strongly emissive (ΦPL > 50%).
Emission of the complexes can be drastically improved (30 times higher ΦPL compared to degassed solution
for the CF3-‐containing complexes) by blending them with an inert solid host such as PMMA, which mitigates
metal-‐ligand vibrations. Solution-‐processed organic light-‐emitting diodes made from these materials showed efficiency as high as 6.3%.
Journal Name
ARTICLE
This journal is © The Royal Society of Chemistry 20xx J. Name., 2013, 00, 1-‐3 | 2
Please do not adjust margins
Please do not adjust margins
Introduction
Iridium complexes have attracted significant attention as potent emitters in organic light-‐emitting diodes (OLEDs)1-‐3 and light-‐
emitting electrochemical cells (LEECs),4-‐7 which are
electroluminescent devices targeted for next generation flat panel displays and solid-‐state lighting. This is due to their high photoluminescence quantum yield (ΦPL) and short radiative
lifetime, facile colour tunability across the entirety of the visible spectrum, and good thermal and photo stability.8 Importantly, both singlet and triplet excitons in these complexes contribute to device efficiencies,9-‐12 which enables them to attain nearly 100% internal quantum efficiency.13
However, the reported OLEDs based on iridium complexes can in many cases show low device efficiency due to rapid non-‐radiative decay.10,14,15 One reason for the reduced efficiencies observed is due to enhanced coupling of the excited state to vibrational modes.10,14-‐16 Many different methods such as controlling isomer geometry or using rigid structures including inert hosts like poly(methylmethacrylate) (PMMA) and poly(styrene) have been reported for controlling the magnitude of vibrational coupling, which lead to moderate improvement of the quantum yield.1,17 However, in order to establish a structure-‐property relationship for achieving both high ΦPL and device efficiency, detailed
photophysical and device studies on structurally related complexes are required. Here we show that blue-‐green cationic iridium(III) complexes of the form [Ir(C^N)2(N^N)]PF6 with the same
cyclometallating, C^N, ligands but with different saturated strongly-‐ donating guanidylpyridine (gpy) N^N ligands18 can be used to control the emission efficiency. We find that there is severe quenching of PL in complexes with a CF3 on the gpy ligand in
solution, which we attribute to vibrational coupling. We show that this can be overcome by embedding the complex in an inert matrix. Therefore, we embedded the complexes within PMMA and observed a significant enhancement of the ΦPL and emission
lifetime, τe, compared to degassed MeCN solution. Quenching was
further reduced at lower temperature. The devices fabricated using solution processing in a multilayer structure show efficiency of more than 6%.
Experimental
Materials and methods
Commercial chemicals were used as supplied. All reactions were performed using standard Schlenk techniques under inert (N2)
atmosphere with freshly obtained anhydrous solvents obtained from a Pure MBRAUN (MB-‐SPS) purification system except where specifically mentioned. Flash column chromatography was performed using silica gel (Silia-‐P from Silicycle, 60 Å, 40-‐63 μm).
Analytical thin layer chromatography (TLC) was performed with silica plates with aluminum backings (250 μm with indicator F-‐254). Compounds were visualized under UV light. 1H, 19F and 13C NMR spectra were recorded on a Brucker Avance 400 spectrometer at 400 MHz, 376 MHz and 100 MHz, respectively. The following abbreviations have been used for multiplicity assignments: “s” for singlet, “d” for doublet, “t” for triplet, “m” for multiplet and “br” for broad. Deuterated chloroform (CDCl3), and deuterated acetonitrile
(CD3CN) were used as the solvent of record. Chemical shifts are
reported in parts per million (ppm) relative to residual solvent 1H resonance (1.96 ppm for CD3CN, 7.26 ppm for CDCl3) and the 13C
resonance (0.73 ppm and 118.69 ppm for CD3CN, 77.00 ppm for
CDCl3) of the solvent. Melting points (Mp’s) were recorded using
open-‐ended capillaries on a Meltemp melting point apparatus and are uncorrected. High-‐resolution mass spectra were recorded on a quadrupole time-‐of-‐flight (ESI-‐Q-‐TOF), model MICROTOF II from Bruker in positive electrospray ionization mode at the Université de Montreal. 1,3,4,6,7,8-‐Hexahydro-‐2H-‐pyrimido[1,2-‐a]pyrimidine (H-‐ hpp), 2-‐bromo-‐5-‐(trifluoromethyl)pyridine, 2-‐bromo-‐5-‐ methylpyridine, (±) BINAP, Pd(OAc)2, t-‐BuOK were purchased from
Aldrich and used as received. The corresponding iridium(III) dimers, [Ir(C^N)2Cl]2 were prepared according to the literature, where C^N
is 2-‐phenylpyridinato (ppy) or 2-‐(4,6-‐difluorophenyl)-‐5-‐ methylpyridinato (dFMeppy).19
Synthetic details
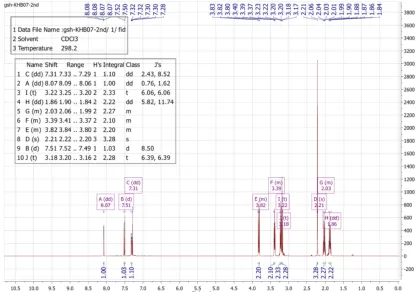
2,3,4,6,7,8-‐hexahydro-‐1-‐(5-‐methylpyridin-‐2-‐yl)-‐pyrimido[1,2-‐ a]pyrimidine (Guanidyl-‐5-‐methyl-‐pyridine (Me-‐gpy) L1): An oven-‐ dried two-‐necked round bottomed flask was charged with (±)-‐BINAP (0.06 mmol, 0.038 g) and filled with nitrogen followed by multiple vacuum and then added 3 mL dry toluene to make a suspension of BINAP. The resulting suspension was heated at 90 °C for 5 min to dissolve the BINAP. This mixture was cooled to room temperature, Pd(OAc)2 (0.04 mmol, 0.009 g) was added, and the mixture was
stirred for 3 min. To the resulting bright yellow solution were added 2-‐ bromo-‐5-‐methylpyridine (4 mmol, 0.688 g) and 1,3,4,6,7,8-‐ hexahydro-‐2H-‐pyrimido[1,2-‐a]pyrimidine (4.3 mmol, 0.600 g) and stirred for 5 min at ambient temperature. The mixture turned into bright orange colour, to which was added t-‐BuOK (5.6 mmol, 0.640 g) and the flask was again charged with nitrogen followed by couple of vacuum. The reaction mixture was then stirred at 90 °C for 5 h, after which time it was cooled to room temperature and diethyl ether (60 mL) was added and the solution was filtered. Evaporation of the filtrate gave the ligand as a yellow oil liquid. Yield: 0.80 g (87%). The synthetic method was adopted from our previously reported protocol.20 1H NMR (400 MHz, Chloroform-‐d) δ (ppm): 8.07 (dd, J =1.6, 0.8 Hz, 1H), 7.51 (d, J = 8.5 Hz, 1H), 7.31 (dd, J = 2.4, 8.5 Hz, 1H), 3.82 (m, 2H), 3.39 (m, 2H), 3.22 (t, J = 6.1 Hz, 2H), 3.18 (t, J = 6.4 Hz, 2H), 2.21 (s, 3H), 2.03 (m, 2H), 1.86 (dd, J = 5.8, 11.7
Journal Name ARTICLE
This journal is © The Royal Society of Chemistry 20xx J. Name., 2013, 00, 1-‐3 | 3
Please do not adjust margins
Please do not adjust margins
Hz, 2H). 13C NMR (101 MHz, Chloroform-‐d) δ (ppm): 155.06, 150.39, 147.17, 137.26, 126.57, 119.30, 49.16, 48.91, 44.39, 44.21, 23.94, 23.08, 18.04. HR-‐MS (ES-‐Q-‐TOF): [M]+ (C13H18N4) calculated:
230.1531; experimental: 230.1528.
1-‐(5-‐(trifluoromethyl)pyridin-‐2-‐yl)-‐2,3,4,6,7,8-‐hexahydro-‐
pyrimido[1,2-‐a]pyrimidine (Guanidyl-‐5-‐trifluoromethyl-‐pyridine (CF3-‐
gpy) L2): Yield: 0.50 g (88%). The synthesis was carried out followed by the above method. 1H NMR (400 MHz, Chloroform-‐d) δ (ppm): 8.46 (d, J =0.8 Hz, 1H), 7.86 (d, J =9.0 Hz, 1H), 7.62 (dd, J = 2.5, 9.0 Hz, 1H), 3.96 (m, 2H), 3.45 (t, J = 5.7 Hz, 2H), 3.26 (t, J = 5.9 Hz, 2H), 3.20 (t, J = 6.3 Hz, 2H), 2.03 (m, 2H), 1.91 (m,2H). 19F NMR (376 MHz, Chloroform-‐d) δ (ppm): -‐71.67. 13C NMR (101 MHz, Chloroform-‐d) δ (ppm): 158.77, 149.43, 144.74, 144.69, 132.96, 117.00, 48.95, 48.80, 44.12, 43.41, 23.95, 22.80. HR-‐MS (ES-‐Q-‐TOF): [M+H]+ (C13H16F3N4) calculated: 285.1329; experimental: 285.1323. General procedure for the synthesis of [Ir(C^N)2(N^N)]PF6
complexes. Iridium dimer (0.07 mmol, 1.0 equiv.) and N^N ligand (Me-‐gpy or CF3-‐gpy) (0.15 mmol, 2.10 equiv.) were solubilized with
20 mL of DCM/MeOH (50:50, v/v). The mixture was degassed by multiple vacuum and N2 purging cycles. The suspension was heated
at 50 °C for 19 h. The reaction mixture was cooled to room temperature and evaporated to dryness. The resulting solid was dissolved in a minimum amount of MeOH and a solution of NH4PF6
(10 equiv., 1.0 g / 10 mL) was added drop by drop to the methanolic solution to cause the precipitation of a solid. The suspension was cooled to 0 °C for 1 h, filtered and the resulting solid was washed with cold water. The crude solid was purified by flash chromatography on silica gel using DCM to DCM/Acetone (9/1, v/v).
[Ir(ppy)2(CF3-‐gpy)]PF6, 1a. Light Yellow solid. Yield: 0.083 g (71 %). Mp: 179 °C. Rf : 0.25 (5% DCM/acetone on silica. 1H NMR (400 MHz, Acetonitrile-‐d3) δ (ppm): 8.59 (d, J = 5.8 Hz, 1H), 8.27 (d, J = 6.0 Hz,
1H), 8.12 (t, J = 7.8 Hz, 3H), 7.97 (q, J = 7.8 Hz, 2H), 7.84 (s, 1H), 7.74 (dd, J = 16.0, 7.9 Hz, 2H), 7.56 (d, J = 9.0 Hz, 1H), 7.32 (t, J = 6.4 Hz, 1H), 7.26 (t, J = 6.7 Hz, 1H), 6.94 (dd, J = 15.6, 7.9 Hz, 2H), 6.80 (dt, J = 14.4, 7.4 Hz, 2H), 6.24 (d, J = 7.5 Hz, 1H), 6.16 (d, J = 7.6 Hz, 1H), 3.83 (m, 1H), 3.41 (m, 2H), 3.38 (m, 1H), 3.21 (m, 1H), 3.07 (dd, J = 10.9, 6.2 Hz, 2H), 2.85 (d, J = 13.3 Hz, 1H), 2.30 (m, 1H), 2.22 (s, 1H), 1.58 (d, J = 5.3 Hz, 1H), 1.15 (m, 1H). 19F NMR (376 MHz, Acetonitrile-‐d3) δ (ppm): -‐63.45, -‐72.00, -‐73.87. 13C NMR (101 MHz,
Acetonitrile-‐d3) δ (ppm): 168.20, 157.86, 153.21, 152.34, 150.84,
149.68, 147.04, 145.05, 144.69, 138.90, 138.60, 136.92, 132.39, 132.15, 130.22, 129.97, 125.25, 124.58, 123.30, 122.99, 122.43, 122.12, 120.18, 119.88, 48.95, 48.60, 48.24, 46.86, 22.64. HR-‐MS (ES-‐Q-‐TOF): [M-‐PF6]+ (C35H31F3N6Ir+) calculated: 785.2188;
experimental: 785.2235.
[Ir(ppy)2(Me-‐gpy)]PF6, 1b. Light yellow solid. Yield: 0.089 g (74%). Mp: 164-‐165 °C. Rf : 0.20 (5% DCM/acetone on silica. 1H NMR (400 MHz, Acetonitrile-‐d3) δ (ppm): 8.64 (d, J = 5.8 Hz, 1H), 8.36 (d, J =
5.4 Hz, 1H), 8.24 (d, J = 8.1 Hz, 1H), 8.19 (d, J = 8.1 Hz, 1H), 8.06 (t, J = 7.8 Hz, 2H), 7.90 (d, J = 7.8 Hz, 1H), 7.82 (dd, J = 13.1, 8.2 Hz, 2H), 7.50 (d, J = 8.5 Hz, 1H), 7.40 (d, J = 11.7 Hz, 2H), 7.33 (d, J = 7.0 Hz, 1H), 7.03 (dd, J = 17.5, 7.6 Hz, 2H), 6.89 (d, J = 6.3 Hz, 2H), 6.34 (d, J = 7.6 Hz, 1H), 6.25 (d, J = 7.5 Hz, 1H), 3.91 (d, J = 13.7 Hz, 1H), 3.53 (d, J = 18.9 Hz, 1H), 3.47 (m, 1H), 3.40 (m, 1H), 3.32 (m, 1H), 3.23 (m, 2H), 3.13 (d, J = 5.5 Hz, 1H), 3.03 (s, 1H), 2.38 (m, 1H), 2.05 (s, 3H), 1.61 (m, 1H), 1.13 (d, J = 5.3 Hz, 1H). 13C NMR (101 MHz, Acetonitrile-‐d3) δ (ppm): 168.30, 153.91, 153.43, 153.14, 151.16,
150.84, 150.54, 149.07, 144.91, 141.26, 138.56, 138.29, 132.30, 131.72, 129.95, 125.32, 124.33, 123.10, 122.78, 121.92, 120.14, 119.65, 117.19, 48.79, 48.64, 48.33, 46.66, 22.96, 22.86, 16.80. HR-‐ MS (ES-‐Q-‐TOF): [M-‐PF6]+ (C35H34N6Ir+) calculated: 731.2470;
experimental: 731.2494.
[Ir(dFMeppy)2(CF3-‐gpy)]PF6, 2a. Light red solid. Yield: 0.082 g (80%). Mp: 193 °C. Rf : 0.32 (5% DCM/acetone on silica. 1H NMR (400 MHz, Acetonitrile-‐d3) δ (ppm): 8.38 (s, 1H), 8.27 (m, 2H), 8.18 (m, 2H),
7.88 (d, J = 8.2 Hz, 2H), 7.64 (m, 2H), 6.58 (dtd, J = 12.1, 9.6, 2.2 Hz, 2H), 5.76 (dd, J = 8.7, 2.3 Hz, 1H), 5.60 (dd, J = 8.9, 2.3 Hz, 1H), 3.85 (m, 1H), 3.42 (m, 2H), 3.28 (m, 1H), 3.21 (m, 1H), 3.16 (m, 1H), 3.09 (m, 1H), 2.86 (d, J = 13.2 Hz, 1H), 2.39 (s, 3H), 2.38 (s, 3H), 2.31 (m, 1H), 2.22 (m, 1H), 1.67 (s, 1H), 1.15 (t, J = 7.0 Hz, 1H). 19F NMR (376 MHz, Acetonitrile-‐d3) δ (ppm): -‐64.60, -‐73.12 (m), -‐75.01, -‐110.57
(m), -‐110.93 (q, J = 9.3 Hz), -‐111.98 (t, J = 11.4 Hz), -‐112.93 (m). 13C NMR (101 MHz, Acetonitrile-‐d3) δ (ppm): 157.69, 152.50, 151.27,
150.93, 146.94, 140.53, 140.38, 137.54, 134.40, 134.14, 123.56, 123.31, 123.09, 122.90, 118.51, 114.66, 114.43, 98.58, 98.37, 98.24, 98.03, 48.96, 48.62, 48.22, 47.22, 22.74, 22.62, 17.74, 17.34. HR-‐MS (ES-‐Q-‐TOF): [M-‐PF6]+ (C37H31F7N6Ir+) calculated: 885.2124;
experimental: 885.2258.
[Ir(dFMeppy)2(Me-‐gpy)]PF6, 2b. Lemon yellow solid. Yield: 0.097 g
(81%). Mp: 180 °C. Rf : 0.22 (5% DCM/acetone on silica. 1H NMR (400 MHz, Acetonitrile-‐d3) δ (ppm): 8.34 (s, 1H), 8.31 (d, J = 8.7 Hz,
1H), 8.23 (d, J = 9.5 Hz, 1H), 8.13 (s, 1H), 7.86 (s, 2H), 7.78 (d, J = 6.7 Hz, 1H), 7.43 (d, J = 8.5 Hz, 1H), 7.17 (s, 1H), 6.55 (dtd, J = 12.0, 9.5, 2.3 Hz, 2H), 5.74 (dd, J = 8.8, 2.3 Hz, 1H), 5.56 (dd, J = 8.9, 2.3 Hz, 1H), 3.82 (d, J = 13.5 Hz, 1H), 3.41 (m, 1H), 3.28 (d, J = 10.9 Hz, 1H), 3.23 (d, J = 9.0 Hz, 1H), 3.18 (dd, J = 7.5, 4.5 Hz, 2H), 3.14 (d, J = 9.6 Hz, 1H), 3.04 (m, 1H), 2.88 (d, J = 13.1 Hz, 1H), 2.37 (s, 3H), 2.36 (s, 3H), 2.28 (d, J = 4.5 Hz, 1H), 1.99 (s, 3H), 1.61 (m, 1H), 1.05 (m, 1H).
19F NMR (376 MHz, Acetonitrile-‐d
3) δ (ppm): -‐73.16, -‐75.04, -‐111.10
(q, J = 9.4 Hz), -‐111.38 (q, J = 9.4 Hz), -‐111.98 (m), -‐113.33 (m). 13C
NMR (101 MHz, Acetonitrile-‐d3) δ (ppm): 161.80, 157.86, 154.72,
153.65, 152.94, 151.31, 150.57, 149.10, 141.79, 140.16, 140.01, 134.01, 133.79, 132.29, 123.57, 123.38, 122.91, 122.71, 114.28, 114.11, 98.20, 97.95, 97.68, 48.80, 48.61, 48.32, 46.87, 30.36, 22.98, 17.88, 17.41, 16.83. HR-‐MS (ES-‐Q-‐TOF): [M-‐PF6]+
(C37H34F4N6Ir+) calculated: 831.2407; experimental: 831.2514.
Table 1: Photophysical properties of 1a-‐2b in MeCN before and after degassing.
Before degassing After degassing
ΦPL
(%)
λmax
(nm) τe (µs)
kr (s-‐1)
X 105
knr (s-‐1)
X106 Φ(%) PL
λmax
(nm) τe (µs)
a k r(s-‐1)
X 105
knr (s-‐1)
X 106
1a 0.6 ± 0.1 512 0.026 2.3± 0.4 38.2± 6.4 2.8 ± 0.3 512 0.09, 1.60 -‐ -‐
1b 0.9 ± 0.1 512 0.031 2.9± 0.3 32.0± 3.6 50.8 ± 4.0 510 1.90 2.7 ± 0.2 0.26 ± 0.02
2a 1.0 ± 0.1 468, 495 0.040 2.5± 0.3 24.8± 2.5 1.7 ± 0.2 462, 510 0.11, 0.98 -‐ -‐
2b 1.2 ± 0.1 470, 497 0.047 2.6± 0.2 21.0± 1.8 65.6 ± 5.0 470, 496 2.60 2.5 ± 0.2 0.13 ± 0.01
a. See ESI for details of bi-‐exponential decay processes in 1a and 2a.
ARTICLE Journal Name
4 | J. Name., 2012, 00, 1-‐3 This journal is © The Royal Society of Chemistry 20xx
Please do not adjust margins
Please do not adjust margins
Results and discussion
Photophysical characterisation
The complexes under study are based on gpy N^N ligands,21 which are strongly donating compared to traditional diimine ligands such as 2,2’-‐bipyridine and coordinate to a wide variety of metal ions,20,22-‐25 including iridium (Fig. 1).18 Complexes 1a,b–2a,b were
prepared in 71–-‐81% yield. The desired complexes were synthesised by allowing one equivalent of Ir dimer, [Ir(C^N)2Cl]2 to react with a
gpy ligand containing a CF3 group, gpy-‐CF3, (1a and 2a) or a CH3
group, gpy-‐Me, (1b and 2b).
The photophysical properties of these four complexes were measured in both aerated and degassed MeCN. The photoluminescence (PL) spectra in aerated solution are shown in
Fig. 2(a) while the PL decay traces are shown in Fig. 2(b); ΦPL values,
PL lifetime (τe) and calculated radiative (kr) and non-‐radiative decay
(knr) rate constants are given in Table 1. The analysis shows that all
four complexes have similar respective ΦPL, kr and knr prior to
degassing.
Figure 1: Complexes under investigation in this study.
Upon degassing the solutions, a dramatic divergence in photophysical behaviour is observed between 1a/2a and 1b/2b. The ΦPL values are more than 50% for 1b and 2b, but remain around 2%
for 1a and 2a. The PL decays for 1b and 2b are monoexponential, with τe ~ 2 µs (Fig. 3 and Table S1), typical for cationic iridium
complexes.26-‐28 By contrast, the PL decays of 1a and 2a are biexponential, with the average τe < 300 ns (Fig. 3 and Table S1).
Upon degassing, kr shows essentially no net change for 1b/2b, while
knr decreases by two orders of magnitude. We attribute the low ΦPL
values observed for 1a and 2a to strong vibrational coupling10,14,16 principally among the asymmetric stretching modes of the Ir-‐NdFppy
bonds and the asymmetric stretching modes of the C-‐N and C-‐C bonds of the pyridine ring of the CF3-‐gpy in 1aand 2a.
This hypothesis is corroborated by DFT calculations where the LUMO (lowest unoccupied molecular orbital) is switched from the CF3-‐gpy moiety in 2a to the pyridine unit of the C^N ligands in 2b
(Fig. 4); a similar relationship exists for 1a/1b (Fig. S20). With the presence of more electron-‐withdrawing fluoro substituents, the emission profiles of complexes 2a and 2b are expectedly blue-‐ shifted compared to those of 1a and 1b. The emission spectra of 1a and 1b are broad and featureless, indicative of a mixed 3CT emission while the spectra of 2a and 2b are structured, suggesting a significant 3LC-‐based emission. Unrestricted DFT calculations support this assignment as they show the triplet state spin density is principally localised on both the Ir(III) centre and the C^N ligands for all complexes, but to some extent is also delocalised onto the guanidyl part of the ancillary CH3-‐/CF3-‐gpy ligand in complexes 1a
and 1b, which is not the case for complexes 2a and 2b (Fig. 5).
1.75 2.00 2.25 2.50 2.75 3.00
0.0 0.2 0.4 0.6 0.8 1.0
0 50 100 150 200 250 300 350 400 450
101 102 103 104 PL int ens ity (a .u) Energy (eV) 1a 1b 2a 2b (a) 1a 1b 2a 2b
PL int
ensity ( coun ts/s) Time (ns) (b) Figure 2: Emission spectra of 1a–2b in MeCN in air (λexc = 360 nm). (b)
Photoluminescence decay of 1a–2b in MeCN in air (λexc = 375 nm). The
experimental data was fitted to a monoexponential decay (red lines).
Journal Name ARTICLE
This journal is © The Royal Society of Chemistry 20xx J. Name., 2013, 00, 1-‐3 | 5
Please do not adjust margins
Please do not adjust margins
0.0 0.3 0.6 0.9 1.2 1.5 1.8102
103
104
0 3 6 9 12 15 18
102 103 104 (b) 1a 2a biexponential fit PL in ten sity (co unts /s)
Time (µs)
(a)
1b, τ=1.9 µs 2b, τ=2.6 µs monoexponential fit PL in ten sity (co unts /s)
Time (µs)
Figure 3: Photoluminescence decay of (a)1a and 2a and (b) 1b and 2b in
degassed MeCN solution. λexc = 375 nm. fits are shown in red.
Figure 4: Calculated frontier MO energies of [2a]+ and [2b]+, obtained from
DFT [(B3LYP/SBKJC-‐VDZ for Ir(III)) and (6-‐31g** for C,H,N,F] with CPCM(CH3CN) and 0.5 eV threshold of degeneracy (isovalued at 0.03). Kohn-‐
Sham MOs of [2a]+ and [2b]+ are also shown.
Frequency calculations suggest that there is a strong coupling among the asymmetric stretching modes of the Ir-‐NdFppy bonds and
the asymmetric stretching modes of the C-‐N and C-‐C bonds of the pyridine ring of the CF3-‐gpy ligand in 2a (vibrational mode #121, E =
1054 cm-‐1) (see Table S4 for other minor contributing vibrational modes that couple with the spin density). This coupling is found to be very weakly present in 2b, the analog complex containing CH3-‐
gpy. Thus, the strong vibrational coupling present in the T1 state
leads to poor ΦPL for 2a (1a) and not for 2b (1b).
Figure 5. Triplet spin density distributions of complexes [1a]+, [1b]+, [2a]+
and [2b]+, obtained from TD-‐DFT [(UB3LYP/SBKJC-‐VDZ for Ir(III)) and (6-‐
31g** for C,H,N,F] with CPCM(MeCN) (isovalue at 0.02).
This vibrational coupling can be quantified by analysis of the Huang-‐ Rhys factors which were estimated from the relative strength of (0,1) and (0,0) transitions. Complexes 2a and 2b have well-‐defined 0–0 and 0–1 peaks in their degassed PL spectra while this is not the case for 1a and 1b. Therefore, we used 2a and 2b to further investigate the nature of this vibrational coupling. From the analysis there is stronger vibrational coupling in 2a (Huang Rhys factor = 1.14) compared to 2b (Huang Rhys factor = 1.09).
For electroluminescence applications, an emitter with a high ΦPL in
the solid state is required. Previously it has been shown that the ΦPL
can be improved by blending the emissive complex within an inert solid host.14,29 Therefore, we blended our complexes with PMMA to
modulate the vibrational coupling in order to enhance the emission efficiency of the complexes. The photophysical data is shown in
Table S3 (ESI). Both 2a and 2b show relatively high ΦPL in thin film,
with a notable recovery of ΦPL for 2a measured in air (> 65%) and
under an N2 environment (> 72%) given that 2a was only slightly
emissive (1.7%) in degassed solution.
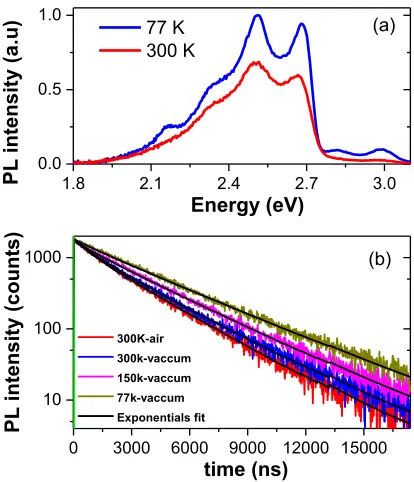
We undertook temperature-‐dependent photophysical studies in order to comprehend further the contrasting behaviour of 2a in solution and thin film. A comparison of the PL emission of 2 wt% 2a in PMMA at room temperature and at 77 K (λexc = 380 nm) is shown
in Fig. 6(a). It can be seen that the 0-‐0 and 0-‐1 peaks are more prominent in the solid-‐state spectrum at room temperature compared to the degassed MeCN solution spectrum (Fig. S18(b)). This shows that having the complex embedded in the host PMMA inhibits significantly the vibrational coupling of the CF3-‐moiety
associated with the non-‐radiative decay of the PL emission. At 77 K the 0–0 peak becomes even more prominent (Huang Rhys factor = 1.05) due to reduced vibrational coupling compared to the measurements at 300 K (Huang Rhys factor = 1.15) and in MeCN
[image:5.595.344.509.68.270.2]ARTICLE Journal Name
6 | J. Name., 2012, 00, 1-‐3 This journal is © The Royal Society of Chemistry 20xx
Please do not adjust margins
Please do not adjust margins
degassed solution spectra (Huang Rhys factor = 1.14). Moreover, relative intensity of PL emission increases at 77 K.
1.8 2.1 2.4 2.7 3.0
0.0 0.5 1.0
0 3000 6000 9000 12000 15000
10 100 1000 PL int ens ity (a .u) Energy (eV) 77 K 300 K (a) 300K-air 300k-vaccum 150k-vaccum 77k-vaccum Exponentials fit PL intensit y (counts) time (ns) (b)
Figure 6: (a) PL spectra of 2 wt% 2a in PMMA measured at 300 K and 77 K (λexc = 380 nm). (b) Temperature-‐dependent PL decay of 2 wt% 2a in PMMA
measured in air and under vacuum (λexc = 379 nm) with fits shown in black. The transient PL decays of 2 wt% 2a in PMMA at different temperatures and in different environments (air and vacuum) are shown in Fig. 6(b) and the photophysical data collected in Table 2
and Table S2. Both components of the decay of 2a under vacuum are longer-‐lived than under air due to the absence of O2, which
quenches phosphorescence. The τe increases upon cooling, to 3.2 µs
at 150 K and 3.7 µs at 77 K due to suppression of thermally-‐ activated non-‐radiative processes,15 including the coupling of the excited state to vibrational modes. Furthermore, the lifetime measured in the solid state is more than 15 times longer than that in degassed MeCN. This shows that doping 2a into PMMA significantly reduces the vibrational quenching at room temperature and this vibrational quenching is almost completely absent at 77 K.
Table 2: Photophysical properties of 2a in DCM and 2 wt% of 2a in PMMA thin film measured at room temperature (300 K)
2a
DCM Film
Before degassing
After degassing
Air Vacuum
ΦPL (%) 1.0 1.7 65.9 72.4
τe (µs)a 0.04 0.11, 0.98 0.82, 2.80 0.92, 3.00
a See ESI for details of bi-‐exponential decay processes.
Device fabrication
After controlling the vibrational coupling in the solid state, we investigated the electroluminescence of 2a and 2b by fabricating solution-‐processed organic light emitting diodes (OLEDs). For
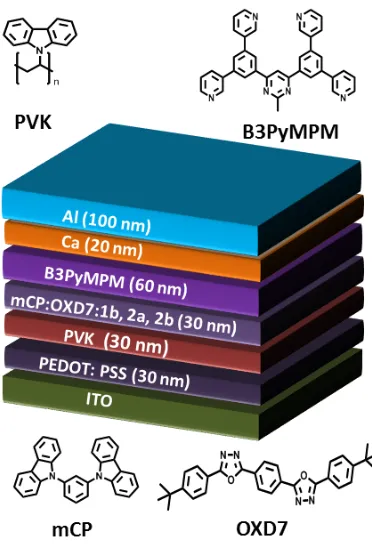
comparison, we also fabricated OLEDs with 1b. The device architecture consisted of following layers: ITO / PEDOT:PSS (30 nm) / PVK (30 nm) / mCP:OXD7:1b–2b(75:20:5 wt%) (30 nm) / B3PYMPM (60 nm) / Ca (20 nm) / Al (100 nm). Here poly(3,4-‐ ethylenedioxythiophene):poly(styrene sulfonate) (PEDOT:PSS) is the hole injection layer and was spin-‐coated at 4000 rpm for 60 s and then baked it at 120 0C for 20 minutes to obtain a 35 nm smooth film. Poly(N-‐vinylcarbazole) (PVK) was used as the hole transporting layer. PVK was spin-‐coated from chlorobenzene at 2000 rpm inside the nitrogen-‐filled glovebox. It was then baked at 80 0C for 2h to
form a smooth film of 30 nm thickness. The emitting layer consisted of 1,3-‐bis(N-‐carbazolyl)benzene (mCP) and 2,2’-‐(1,2-‐ phenylene)bis[5-‐(4-‐tert-‐butylphenyl)-‐1,3,4-‐oxadiazole] (OXD-‐7) as host materials and phosphorescent dopants 1b–2b, which were cast from acetonitrile at 2000 rpm to form a film of 30 nm thickness. OXD7 and mCP are wide band gap (3.7 eV) materials.30, 31 OXD7 and
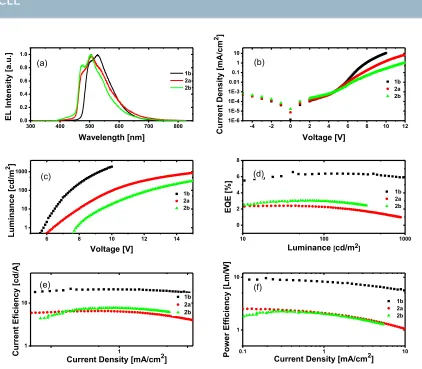
mCP were selected because they are wide band gap materials with high triplet energies and together can transport both electron and hole well. A 60 nm electron-‐transporting layer 4,6-‐bis(3,5-‐ di(pyridin-‐3-‐yl)phenyl)-‐2-‐methylpyrimidine (B3PyMPM) was then thermally evaporated onto the emitting layer under high vacuum. Finally, the composite cathode Ca (20 nm) / Al (100 nm) was thermally deposited through a shadow mask in the vacuum chamber at ~ 2.0×10⁻⁶ mbar. The device architecture along with the energy levels are shown in Fig. 7. The electroluminescence (EL) spectra of the three devices are shown in Fig. 8(a). EL spectra of 2a and 2b are similar to their PL spectra but are red-‐shifted and show different relative intensities of the vibronic peaks. However, the EL spectrum of 1b has two distinct vibronic peaks compared to PL spectra, which showed only one broad peak, pointing to a greater ligand-‐centered character to the emission of 1b in the device. In the EL spectra, we did not observe any emission around 410 nm (expected emission from host) due to complete energy transfer from the host to the iridium emitters.32 Current-‐voltage characteristics of the devices are shown in Fig. 8(b).
(a)
ITO -‐4.7 PE D O T: PS S -‐5.2 -‐3.4 -‐5.6 -‐2.0 PV K -‐6.0 -‐2.4 mC P OX D 7 -‐2.4 -‐6.3 -‐5.3
-‐
2.3 B3 Py M PM -‐6.8-‐
3.2 Ca-‐
2.9-‐
4.3 AlEn
er
gy
1a, 1b
, 2
a,
2b
-‐5.7
-‐
2.2(b)
[image:6.595.60.267.106.347.2] [image:6.595.305.531.466.702.2]Journal Name ARTICLE
This journal is © The Royal Society of Chemistry 20xx J. Name., 2013, 00, 1-‐3 | 7
Please do not adjust margins
Please do not adjust margins
Figure 7: (a) Energy level diagram of light emitting devices using 1b–2b as the emitter. (b) Schematic of fabricated light emitting devices fabricated using 1b-‐2b.
The device made from 1b showed the highest current density at high voltage (> 6 V), followed by the devices with 2b then 2a. The turn-‐on voltage for the OLED with 2a is lower than that with 2b. All devices show a steep increase in luminance with voltage once turned on (see Fig. 8(c)). A maximum luminance of 1846 cd/m2 at a driving voltage of 10 V, 881 cd/m2 at 15.1 V and 332 cd/m2 at 15.1 V
was achieved for 1b, 2a and 2b, respectively. The luminance characteristics of the devices (Fig. 8 (c)) show that the OLED based on 1b has the lowest turn-‐on voltage and highest power and current efficiencies among all devices whereas 2b has the highest turn-‐on voltage. The external quantum efficiencies (EQE) of the devices are given in Fig. 8(d). The EL properties are summarized in Table 3. The maximum EQE of 6.5% was obtained for 1b at a luminance of 41 cd/m2 (7V), which reduced only slightly to 6.3% at 100 Cd/m2 and 5.8% at 1000 Cd/m2. A similar low roll off of the EQE for 2a and 2b was also observed. A maximum EQE of 2.4% at luminance of 35 cd/m2 was obtained for 2a, which reduced to 2.3% at 100 Cd/m2, whereas in the case of 2b, a maximum EQE of 3.0% was obtained at 40 cd/m2, which reduced to 2.8% at 100 Cd/m2.
The EQE of 6.3% and current efficiency of 20.8 Cd/m2 at a luminance of 100 cd/m2 for 1b is among the best performing OLEDs based on the use of cationic iridium complexes as emissive layer.33-‐
39 To the best of our knowledge the best performing solution-‐
processed device using a cationic iridium complex as the emitter showed a maximum EQE of 7.1% and CE of 10.0 cd/m2.39 This device
used [Ir(npy)2(c-‐phen)]PF6, (npy is 2-‐(naphthalen-‐1-‐yl)pyridinato c-‐
phen = 1-‐Ethyl-‐2-‐(9-‐(2-‐ethylhexyl)-‐9H-‐carbazol-‐3-‐yl)-‐1H-‐imidazo[4,5-‐ f][1,10]phenanthroline). Due to the use of strongly conjugated C^N ligands the emission colour of the device was in the red region with CIE coordinates of (0.57, 0.40)39 and so a direct comparison to the current devices is not appropriate. Recently, Duan and co-‐workers reported the use of the blue-‐green [Ir(ppy)2(pzpy)][PF6] (pzpy = 2-‐
(1Hpyrazol-‐1-‐yl)pyridine) complex as the emitter in a a single-‐layer solution-‐processed OLED.40 A maximum EQE of 6.8% with current
efficiency of 17.1 cd/m2 was obtained with CIE coordinates of (0.21, 0.48).
Table 3: Electroluminescence characteristics of the OLEDs. Emitter
Von a (V) λpeak
b (nm) EQE
c (%) CE
d (cd/A) PE.
e
(lm/W) CIE f
1b 5.8 527 6.3 20.8 8.7 (0.29, 0.58)
2a 6.3 506 2.3 6.2 1.9 (0.26, 0.47)
2b 7.8 503 2.8 7.1 1.6 (0.22,0.43)
a Turn-‐on voltage @ 1 cd/m2. b Peak wavelength at 1 mA/cm2. c External
quantum efficiency at 100 cd/m2. d Current efficiency at 100 cd/m2. e Power
efficiency at 100 cd/m2. f The Commission Internationale de L’Eclairage (CIE)
coordinates at 1 mA/cm2.
Our device using 1b has CIE coordinates of (0.29, 0.58) and so is slightly red-‐shifted and has a slightly higher current efficiency compared to the device of Duan et al. The device with 1b exhibits considerably better performance. We attribute this to the shallower HOMO enabling more efficient hole injection, which explains the lower turn-‐on voltage and improved charge balance and device efficiency. The device with 2a has the lowest EQE, despite a higher luminance and similar power efficiency compared to 2b (Fig. 8(d) and 8 (e)). These results suggest there may be poorer charge carrier balance in these devices.17, 32, 41
Conclusions
In summary, we have shown that the suppressed emission of CF3-‐
containing complexes 1a and 2a in MeCN solution can be overcome by decreasing the temperature or by embedding these complexes in a rigid PMMA matrix. In fact, emission in the thin film is enhanced by ca. 30-‐fold compared to measurement in degassed solution. The supressed emission in solution is the result of strong coupling of the excited state to vibrational modes implicating the CF3-‐group;
whereas 1a and 2a show ΦPL of <1%, replacement of the CF3-‐ group
by CH3-‐ recovers the emission without affecting the emission
energy, with ΦPL >50%. OLEDs were made with both solution-‐state
emissive (2b) and non-‐emissive complexes (2a). Their performance resulted in similar EQEs measured for both devices. Thus, this study demonstrates the importance of assessing the solid-‐state optoelectronic properties of emitters prior to their considered use in EL devices.
[image:7.595.47.233.63.336.2]
Journal Name
ARTICLE
This journal is © The Royal Society of Chemistry 20xx J. Name., 2013, 00, 1-‐3 | 8
Please do not adjust margins
Please do not adjust margins
Figure 8. (a) EL spectra of three complexes. (b) Current density of 1b (black), 2a (red) and 2b (green) as function of voltage of OLEDs. (c) Luminance as a function of applied voltage. (d) External quantum efficiency (EQE) as a function of Luminance. (e) Current efficiency as a function of current density. (f) Power efficiency as a function of current density for the devices fabricated using 1b, 2a and 2b.
Acknowledgements
We are grateful to the European Research Council (grant 321305), EPSRC (grants EP/J01771X, EP/L017008/1 and EP/M02105X/1) for financial support. IDWS acknowledges a Royal Society Wolfson Research Merit Award. GSH thanks the Natural Sciences and Engineering Research Council (NSERC) of Canada for funding.
Notes and references
1. Y. You and S. Y. Park, Dalton Trans., 2009, 1267-‐1282.
2. L. Xiao, Z. Chen, B. Qu, J. Luo, S. Kong, Q. Gong and J. Kido, Adv. Mater., 2011, 23, 926-‐952.
3. H. Xu, R. Chen, Q. Sun, W. Lai, Q. Su, W. Huang and X. Liu, Chem. Soc. Rev., 2014, 43, 3259-‐3302.
4. R. D. Costa, E. Ortí, H. J. Bolink, F. Monti, G. Accorsi and N. Armaroli, Angew. Chem. Int. Ed., 2012, 51, 8178-‐8211.
5. T. Hu, L. He, L. Duan and Y. Qiu, J. Mater. Chem., 2012, 22, 4206-‐ 4215.
6. M. S. Lowry and S. Bernhard, Chem. Eur. J., 2006, 12, 7970-‐7977. 7. A. F. Henwood and E. Zysman-‐Colman, Top. Curr. Chem., 2016,
374, 1-‐41.
8. S. Ladouceur and E. Zysman-‐Colman, Eur. J. Inorg. Chem., 2013,
2013, 2985-‐3007.
9. M. A. Baldo, D. O'brien, Y. You, A. Shoustikov, S. Sibley, M. Thompson and S. Forrest, Nature, 1998, 395, 151-‐154.
10. S.-‐C. Lo, R. E. Harding, C. P. Shipley, S. G. Stevenson, P. L. Burn and I. D. Samuel, J. Am. Chem. Soc., 2009, 131, 16681-‐16688. 11. M. Baldo, M. Thompson and S. Forrest, Nature, 2000, 403, 750-‐
753.
300 400 500 600 700 800
0.0 0.2 0.4 0.6 0.8 1.0
-4 -2 0 2 4 6 8 10 12
1E-6 1E-5 1E-4 1E-3 0.01 0.1 1 10
6 8 10 12 14
1 10 100 1000 1 1 10
0.1 1 10
1 10 (a) EL Inte ns ity [a .u. ] Wavelength [nm] 1b 2a 2b (b) Curr en t Den si ty [mA/c m 2 ] Voltage [V] 1b 2a 2b (d) (c) 1b 2a 2b L u m in an ce [ cd /m 2 ] Voltage [V]
10 100 1000
0 2 4 6 8 EQE [ % ]
Luminance [cd/m2]
1b 2a 2b (e) 1b 2a 2b Cu rr en t Efic ie n cy [ cd /A]
Current Density [mA/cm2]
(f) Pow er Eff ic ie n cy [ L m /W]
Current Density [mA/cm2] 1b 2a 2b
[image:8.595.83.505.130.499.2]Journal Name ARTICLE
This journal is © The Royal Society of Chemistry 20xx J. Name., 2013, 00, 1-‐3 | 9
Please do not adjust margins
Please do not adjust margins
12. X. Gong, W. Ma, J. C. Ostrowski, G. C. Bazan, D. Moses and A. J. Heeger, Adv. Mater., 2004, 16, 615-‐619.
13. C. Adachi, M. A. Baldo, M. E. Thompson and S. R. Forrest, J. Appl. Phys., 2001, 90, 5048-‐5051.
14. R. E. Harding, S.-‐C. Lo, P. L. Burn and I. D. Samuel, Org. Electron., 2008, 9, 377-‐384.
15. T. Sajoto, P. I. Djurovich, A. B. Tamayo, J. Oxgaard, W. A. Goddard III and M. E. Thompson, J. Am. Chem. Soc., 2009, 131, 9813-‐9822. 16. J. A. Treadway, B. Loeb, R. Lopez, P. A. Anderson, F. R. Keene and
T. J. Meyer, Inorg. Chem., 1996, 35, 2242-‐2246.
17. J. Lee, H.-‐F. Chen, T. Batagoda, C. Coburn, P. I. Djurovich, M. E. Thompson and S. R. Forrest, Nat. Mater., 2016, 15, 92-‐98. 18. K. Hasan, A. K. Pal, T. Auvray, E. Zysman-‐Colman and G. S. Hanan,
Chem. Commun., 2015, 51, 14060-‐14063.
19. M. Nonoyama, Bull. Chem. Soc. Jpn., 1974, 47, 767-‐768.
20. A. K. Pal, S. Nag, J. G. Ferreira, V. Brochery, G. La Ganga, A. Santoro, S. Serroni, S. Campagna and G. S. Hanan, Inorg. Chem., 2014, 53, 1679-‐1689.
21. A. K. Pal, P. K. Mandali, D. K. Chand and G. S. Hanan, Synlett, 2015, 26, 1408-‐1412.
22. S. Nag, J. G. Ferreira, L. Chenneberg, P. D. Ducharme, G. S. Hanan, G. La Ganga, S. Serroni and S. Campagna, Inorg. Chem., 2010, 50, 7-‐9.
23. A. K. Pal, P. D. Ducharme and G. S. Hanan, Chem. Commun., 2014,
50, 3303-‐3305.
24. A. K. Pal, S. Serroni, N. Zaccheroni, S. Campagna and G. S. Hanan,
Chem. Sci., 2014, 5, 4800-‐4811.
25. A. K. Pal, N. Zaccheroni, S. Campagna and G. S. Hanan, Chem. Commun., 2014, 50, 6846-‐6849.
26. S. Ladouceur, D. Fortin and E. Zysman-‐Colman, Inorg. Chem., 2011, 50, 11514-‐11526.
27. L. He, L. Duan, J. Qiao, R. Wang, P. Wei, L. Wang and Y. Qiu, Adv. Funct. Mater., 2008, 18, 2123-‐2131.
28. R. D. Costa, E. Ortí, H. J. Bolink, S. Graber, S. Schaffner, M. Neuburger, C. E. Housecroft and E. C. Constable, Adv. Funct. Mater., 2009, 19, 3456-‐3463.
29. T. Sajoto, P. I. Djurovich, A. Tamayo, M. Yousufuddin, R. Bau, M. E. Thompson, R. J. Holmes and S. R. Forrest, Inorg. Chem., 2005,
44, 7992-‐8003.
30. D. O’Brien, A. Bleyer, D. Lidzey, D. Bradley and T. Tsutsui, J. appl. Phys., 1997, 82, 2662-‐2670.
31. K. Masui, H. Nakanotani and C. Adachi, Org. Electron., 2013, 14, 2721-‐2726.
32. A. F. Henwood, A. K. Bansal, D. B. Cordes, A. M. Slawin, I. D. Samuel and E. Zysman-‐Colman, J. Mater. Chem. C, 2016, 4, 3726-‐ 3737
33. E. A. Plummer, A. van Dijken, J. Hofstraat, L. De Cola and K. Brunner, Adv. Funct. Mater., 2005, 15, 281-‐289.
34. W. Y. Wong, G. J. Zhou, X. M. Yu, H. S. Kwok and Z. Lin, Adv. Funct. Mater., 2007, 17, 315-‐323.
35. L. He, L. Duan, J. Qiao, D. Zhang, G. Dong, L. Wang and Y. Qiu,
Org. Electron., 2009, 10, 152-‐157.
36. L. He, L. Duan, J. Qiao, D. Zhang, L. Wang and Y. Qiu,
Org.Electron., 2010, 11, 1185-‐1191.
37. B. Park, Y. H. Huh, H. G. Jeon, C. H. Park, T. K. Kang, B. H. Kim and J. Park, J. Appl. Phys., 2010, 108, 094506.
38. G. Nasr, A. Guerlin, F. Dumur, L. Beouch, E. Dumas, G. Clavier, F. Miomandre, F. Goubard, D. Gigmes and D. Bertin, Chem. Commun., 2011, 47, 10698-‐10700.
39. H. Tang, Y. Li, B. Zhao, W. Yang, H. Wu and Y. Cao, Org. Electron., 2012, 13, 3211-‐3219.
40. D. Ma, C. Zhang, Y. Qiu and L. Duan, J. Mater. Chem. C, 2016, 4, 5731-‐5738
41. M. Y. Wong, G. Xie, C. Tourbillon, M. Sandroni, D. B. Cordes, A. M. Slawin, I. D. Samuel and E. Zysman-‐Colman, Dalton Trans., 2015,
44, 8419-‐8432.
S1
Controlling the emission of blue-‐green Iridium (III) phosphorescent
emitters
Muhammad T. Sajjad,
aNidhi Sharma,
a,bAmlan K. Pal,
bKamrul Hasan,
c,dGuohua Xie,
aLisa Sophie
Kölln,
aGarry S. Hanan,*
cIfor D. W. Samuel,*
aEli Zysman-‐Colman*
ba Organic Semiconductor Centre, SUPA, School of Physics and Astronomy, University of St. Andrews, St.
Andrews, Fife, KY16 9SS, UK; Tel: +44-‐1334 463114;
E-‐mail: idws@st-‐andrews.ac.uk
b Organic Semiconductor Centre, EaStCHEM School of Chemistry, University of St Andrews, St Andrews, Fife,
UK, KY16 9ST, Fax: +44-‐1334 463808; Tel: +44-‐1334 463826;
E-‐mail: eli.zysman-‐colman@st-‐andrews.ac.uk; URL: http://www.zysman-‐colman.com
c Département de Chimie, Université de Montréal, 2900 Edouard-‐Montpetit, Montréal, Québec H3T-‐1J4,
Canada.
E-‐mail: [email protected]; Fax: +1-‐514 343-‐2468; Tel: +1-‐514 343-‐7056
d Department of Chemistry, College of Sciences, University of Sharjah, P. O. Box 27272, Sharjah, United Arab
Emirates
E-‐mail: [email protected]; Fax: +971 6 5053820; Tel: +971 6 5166768
SUPPORTING INFORMATION
Table of contents
1
H,
19F and
13C NMR spectra of individual compounds and complexes
Photophysical characterisation
DFT calculations
OLED Device Fabrication
Pages
S2-‐S9
S10-‐S11
S12-‐S20
S20
S2
1
H,
19F and
13C NMR spectra of individual compounds and complexes
Figure
S1
.
1H NMR spectrum of
L1
(Me-‐gpy)
in CDCl
3
at 400 MHz.
Figure
S2
.
13C NMR spectrum of
L1
(Me-‐gpy)
in CDCl
3
at 400 MHz.
[image:12.595.89.505.104.396.2] [image:12.595.86.509.434.732.2]S3
Figure
S3
.
1H NMR spectrum of
L2
(CF
3
-‐gpy)
in CDCl
3at 400 MHz at r.t.
Figure
S4
.
19F NMR spectrum of
L2
(CF
3
-‐gpy)
in CDCl
3at 400 MHz at r.t.
[image:13.595.84.512.98.397.2] [image:13.595.89.505.434.732.2]S4
Figure
S5
.
13C NMR spectrum of
L2
(CF
3
-‐gpy)
in CDCl
3at 400 MHz at r.t.
Figure
S6
.
1H NMR spectrum of
[Ir(ppy)
2
(CF
3-‐gpy)]PF
6,
1a
in Acetonitrile-‐
d
3at 400 MHz.
[image:14.595.89.509.93.391.2] [image:14.595.92.509.424.728.2]S5
Figure
S7
.
19F NMR spectrum of
[Ir(ppy)
2
(CF
3-‐gpy)]PF
6,
1a
in Acetonitrile-‐
d
3at 400 MHz.
Figure
S8
.
13C NMR spectrum of
[Ir(ppy)
2
(CF
3-‐gpy)]PF
6,
1a
in Acetonitrile-‐
d
3at 400 MHz.
[image:15.595.77.490.71.370.2] [image:15.595.84.503.415.713.2]S6
Figure
S9
.
1H NMR spectrum of
[Ir(ppy)
2
(Me-‐gpy)]PF
6,
1b
in Acetonitrile-‐
d
3at 400 MHz.
Figure
S10
.
13C NMR spectrum of
[Ir(ppy)
2(Me-‐gpy)]PF
6,
1b
in Acetonitrile-‐
d
3at 400 MHz.
[image:16.595.87.505.73.371.2] [image:16.595.87.507.410.709.2]S7
Figure
S11
.
1H NMR spectrum of
[Ir(dFMeppy)
2
(CF
3-‐gpy)]PF
6,
2a
in Acetonitrile-‐
d
3at 400 MHz.
Figure
S12
.
19F NMR spectrum of
[Ir(dFMeppy)
2
(CF
3-‐gpy)]PF
6,
2a
in Acetonitrile-‐
d
3at 400 MHz.
[image:17.595.89.506.74.372.2] [image:17.595.86.503.412.715.2]S8
Figure
S13
.
13C NMR spectrum of
[Ir(dFMeppy)
2
(CF
3-‐gpy)]PF
6,
2a
in Acetonitrile-‐
d
3at 400 MHz.
Figure
S14
.
1H NMR spectrum of
[Ir(dFMeppy)
2
(Me-‐gpy)]PF
6,
2b
in Acetonitrile-‐
d
3at 400 MHz.
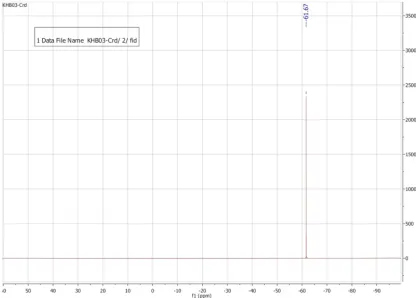
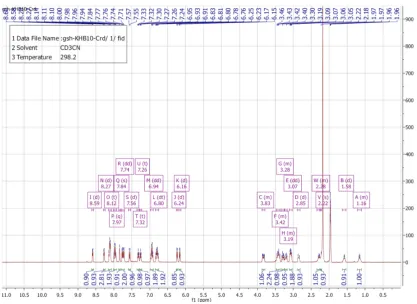
[image:18.595.86.507.74.372.2] [image:18.595.88.505.420.718.2]S9
Figure
S15
.
19F NMR spectrum of
[Ir(dFMeppy)
2
(Me-‐gpy)]PF
6,
2b
in Acetonitrile-‐
d
3at 400 MHz.
Figure
S16
.
13C NMR spectrum of
[Ir(dFMeppy)
2
![Figure
4:
Calculated
frontier
MO
energies
of
[2a
]+and
[2b],
obtained
from
+DFT
[(B3LYP/SBKJC-‐VDZ
for
Ir(III))
and
(6-‐31g**
for
C,H,N,F]
with
CPCM(CH3CN)
and
0.5
eV
thre](https://thumb-us.123doks.com/thumbv2/123dok_us/8664949.375821/5.595.344.509.68.270/figure-calculated-frontier-energies-obtained-lyp-sbkjc-cpcm.webp)
![Figure
S7
19.F
NMR
spectrum
of
[Ir(ppy)2(CF-‐gpy)]PF3
1a
6,in
Acetonitrile-‐d
at
400
MHz](https://thumb-us.123doks.com/thumbv2/123dok_us/8664949.375821/15.595.84.503.415.713/figure-nmr-spectrum-ir-ppy-cf-acetonitrile-mhz.webp)
![Figure
S9
1.H
NMR
spectrum
of
[Ir(ppy)2(Me-‐gpy)]PF
1b
6,in
Acetonitrile-‐d
at
400
MHz](https://thumb-us.123doks.com/thumbv2/123dok_us/8664949.375821/16.595.87.507.410.709/figure-nmr-spectrum-ir-ppy-gpy-acetonitrile-mhz.webp)
![Figure
S11
1.H
NMR
spectrum
of
[Ir(dFMeppy)2(CF-‐gpy)]PF3
2a
6,in
Acetonitrile-‐d
at
400
MHz](https://thumb-us.123doks.com/thumbv2/123dok_us/8664949.375821/17.595.86.503.412.715/figure-nmr-spectrum-ir-dfmeppy-cf-acetonitrile-mhz.webp)
