Development of AE Monitoring System with Noise Reduction Function
by Spectral Subtraction
Takuma Matsuo and Hideo Cho
Department of Mechanical Engineering, Faculty of Science and Engineering, Aoyama Gakuin University, Sagamihara 229-8558, Japan
In order to monitor acoustic emission (AE) in a noisy environment, an AE monitoring system with a real-time noise reduction function using spectral subtraction (SS) was developed. First, the improvement in the S/N ratio and distortion of the waveform after the process were compare to those in¾-filter and wavelet shrinkage methods. The improvement in the S/N ratio of the waveform processed by SS constantly increased and was observed to be independent of the S/N ratio of the wave before processing. The distortion of the waveform processed by SS was less than the distortions of the waves processed using¾-filter and by wavelet shrinkage. Next, the effect of two parameters in the SS process®frame number (fn) and over-subtraction factor (¡)®on the noise reduction performance was studied. The S/N ratio of the signals processed by the SS technique improved with decreasingfnand with increasing¡. However, the processed waveform was distorted when¡was large. It is necessary to set the value offnto 16 or less and¡to 5 or less so that SS showed an advantage to reduce noise with low waveform distortion.
Cylindrical wave AE signals produced by the Hsu-Nielsen source (pencil lead breaking) were monitored with the developed system in an environment with artificial noise. The developed system was able to acquire AE signals with a sampling frequency of up to 25 MHz. The noise was reduced and AE signals with S/N ratio of 0 dB before the process could be detected. The S/N ratio of the AE signal was improved by approximately 10 dB using the SS technique. [doi:10.2320/matertrans.I-M2011855]
(Received November 9, 2009; Accepted October 29, 2011; Published January 18, 2012)
Keywords: acoustic emission, spectral subtraction, noise reduction, signal processing, real-time monitoring
1. Introduction
An acoustic emission (AE) technique has been utilized for
a condition monitoring of structures1,2) and machines.3)
However, it is a difficulty to monitor AE signals in a noisy
environment where vibration or electromagnetic noise exist
as environmental noise. A frequency filter is generally used
to reduce background noise, however, a frequency filter is
unable to considerably reduce wide frequency band noise or noise due to variation in frequency with time. Noise is not just a problem associated with AE monitoring but a common
problem in the field of sound engineering, medical
electronics and geophysics explorations that involve signal
detection.4)In order to overcome this problem, various signal
processing methods were proposed. Domoho proposed a
de-noising technique involving a discrete wavelet transform.5)
Arakawa et al. proposed a nonlinear filter called ¾-filter.6)
Lim and Oppenheim proposed a Wienerfilter that utilized a
mean square error.7)Boll proposed spectral subtraction (SS),
a technique for reducing noise on the basis of the frequency
spectrum.8)SS is a computationally efficient technique and is
widely used for noise reduction of speech signals.9,10)It has
also been used for noise reduction of AE signals.11)We also
applied SS for AE signals and embedded it in a real-time
noise reduction system by using SS.12) However, noise
reduction performance has not been compared to other techniques. Moreover, the previous system has a dead time of 30 ms.
In this study, we developed an AE monitoring system with a real-time noise reduction function using the SS technique with no dead-time. First, we compared the noise reduction performance between SS and other techniques for the inherent background noise in the monitoring system and the sensor. Then, we monitored the cylindrical wave AE
signals produced by the HsuNielsen source (pencil lead
breaking) in a noisy environment with a wide frequency band.
2. Spectral Subtraction
The AE signal x(t) is the combined waveform of the
original signals(t) and noise signaln(t), detected by the AE
monitoring system. The AE signal x(t) and its frequency
spectrumX(f) are expressed by
xðtÞ ¼sðtÞ þnðtÞ ð1Þ XðfÞ ¼SðfÞ þNðfÞ ð2Þ
whereX(f),S(f), andN(f) represent the frequency spectra of
x(t),s(t) andn(t), respectively. The spectrum of the original
signal can be estimated by subtracting the frequency spectrum
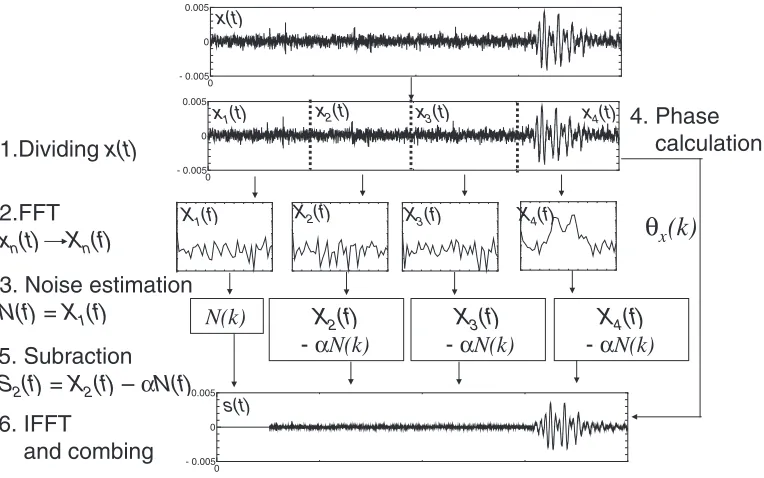
of the noise signal, N(f), from X(f). Figure 1 shows a
schematic diagram of the SS process used in this study.
(1) The detected signalx(t) was divided intofnequal parts.
Here,fntakes an arbitrary number. In Fig. 1, fnwas 4.
In this study, fn was 4, 8, 16, 32, and 64. The data
length in one frame depends on the frame number. (2) A fast Fourier transform (FFT) was performed for all
frames individually.
(3) As N(f) should be determined before the noise
reduction process, the signal in the first frame was
assumed to be the noise component.
(4) The phases of each divided signal (ª1(f),ª2(f),+) was
calculated.
(5) The frequency spectrum of the original signal S(f) is
given by
SðfÞ ¼ XðfÞ ¡NðfÞ (XðfÞ>¡NðfÞ)
0 (otherwise)
ð3Þ
where¡is an over-subtraction factor. In this paper, the
value of¡ is varied from 1 to 8.
Special Issue on APCNDT 2009
(6) After an inverse fast Fourier transform (IFFT) was performed for the obtained frequency spectra of the original signal, divided signals were combined in the same order of the detected signal.
3. Noise Reduction by Spectral Subtraction and Comparison of Noise Reduction Performance
[image:2.595.108.490.70.309.2]3.1 Noise reduction by spectral subtraction
Figure 2 shows the experimental setup for estimation of noise reduction performance in AE monitoring. Two AE transducers (PAC, PICO center frequency: 450 kHz) were mounted on a type-304 stainless steel plate with 1 mm thickness. One transducer was used for the excitation of an
artificial AE signal and another transducer was used as a
sensor for detecting the signal. AE was excited by applying 1 cycle of sine voltage at a frequency of 450 kHz to the excitation transducer which was placed 120 mm away from
the detection transducer. The input voltage Vin for the
excitation transducer was varied from 70 mV to 2.0 V in
order to change the S/N ratio of the AE signal. The detected
AE signal was amplified by 40 dB with a pre-amplifier and
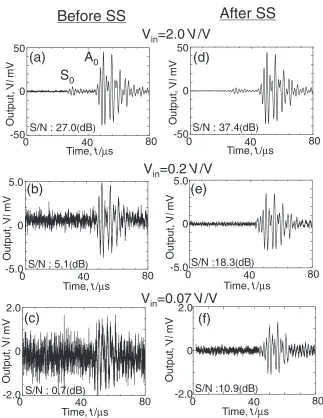
was fed to a digitizer. The sampling interval and data points were set to 40 ns and 4096 points, respectively. Figure 3 shows a comparison between waveforms before and after the noise reduction or SS process. The panels on the left of Fig. 3 show the waveforms before noise reduction, and panels on the right show waveforms in Fig. 3 show
waveforms after noise reduction by SS with fn=4 and
¡=2. In this case, AE propagates as a Lamb wave. The
detected waveform forVin=2.0 V (a) is an ideal Lamb wave
composed of a strong A0mode followed by a weak S0mode.
The waveform after SS (b) displays a reduced background
noise, and the S/N ratio of the waveform increased by
10.4 dB. The waveforms (b) and (c) were processed into
waveforms (e) and (f), respectively. The S/N ratios of
waveforms (e) and (f) were thereby improved by 13.2 and 10.2 dB, respectively.
3.2 Improvement in S/N ratio and waveform distortion by SS process
The relationship between the S/N ratios of the signal
before and after SS was studied and the characteristics of noise reduction by SS were compared to the characteristics of
noise reduction using the¾-filter (EF)6)and wavelet shrinkage
(WS).5) The parameter of SS were fn=8 and ¡=2. The
parameters of EF were ¾0=10, ¾1=3.0 mV and ¾2=
1.5 mV. In WS, Daubechies wavelet (N=10) was adopted
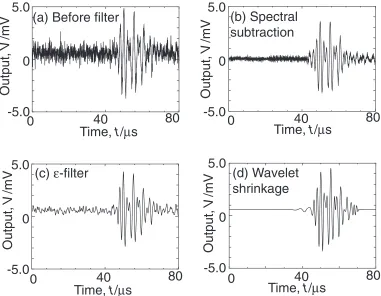
as the mother wavelet. Figure 4 shows a comparison between the waveforms before noise reduction (a) and the waveforms
processed using spectral subtraction (b), ¾-filter (c), and
wavelet shrinkage (d), respectively. We can observe that the
background noise was reduced and the S/N ratio improved in
all the processes. Figure 5 shows a change in the S/N ratio
before and after processing by the aforementioned three
techniques. The improvement in S/N ratio of the waves
processed by both SS and EF is approximately constant.
Thus, the improvement in S/N ratio by these processes is
not dependent on the amplitude of the noise components.
0 - 0.005
0 0.005
N(k)
θx
(k)
0- 0.005 0 0.005
x1(t)
X1(f) X3(f) X4(f)
X
2(f)
-
α
N(k)
X
3(f)
-
α
N(k)
X
4(f)
-
α
N(k)
X2(f)
s(t)
0 - 0.005 0 0.005
x(t)
x2(t) x3(t) x4(t)
1.Dividing
x(t)
2.FFT
x
n(t)
X
n(f)
3. Noise estimation
N(f)
=
X
1(f)
4. Phase
calculation
5. Subraction
S
2(f)
=
X
2(f)
–
α
N(f)
6. IFFT
and combing
Fig. 1 Procedure of spectral subtraction.
Digitizer
Sensor
(Center Frequency , 450 f/kHz)
Excitation for AE
(Center Frequency, 450 f/kHz)
Type 304
Stainless steel plate
Pre-Amp (40 (dB))
450 f/kHz 1 Cycle sine wave Vin= 2 V/V – 70 V/mV
Function Generator (AE Generator)
[image:2.595.305.547.348.469.2]However, the S/N ratio did not improve after WS for the
waveform with an S/N ratio lower than 5.1 dB. In the WS
method, the original signal was distinguished from noise by obtaining decomposed signals by a wavelet transform and removing the noise on the basis of a threshold. Therefore, when the amplitude of the amplitude of original signal is less than that of noise, the WS technique does not work.
Figure 6 shows the correlation between the waveforms processed by the three types of noise reduction techniques and the waveform shown in Fig. 3(a). Here, low correlation
signifies that the process caused a distortion in the waveform.
Although all processed signals tend to be distorted in the
signal with lower S/N ratio, correlation coefficient for the
wave processed by the SS technique was higher than the
correlation coefficients for the waves processed by the
other two processes. Distortion by EF may be caused by
inappropriate parameters. In AE monitoring, it is difficult
to choose the appropriate parameters because the amplitude
and/or frequency characteristics of the noise component vary
with time.15) Noise reduction by the SS technique did not
depend on the S/N ratio, hense, SS was considered to be a
convenient technique for AE monitoring.
3.3 Effect of frame number
Figure 7 shows waveforms processed by SS withfnof 4,
16 and 64, and ¡of 2 for the waveform shown in Fig. 3(c)
(Vin=70 mV). In order to evaluate the effect of the frame
number on noise reduction, fn was changed from 4 to 64,
while ¡ was kept at 2. The S/N ratio increased with
decreasing frame number. For anfnof 64, 16, and 4, the S/N
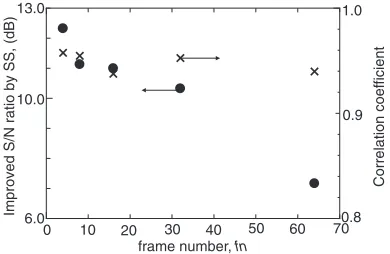
ratio was 10.9, 9.8, and 4.9 dB, respectively. Figure 8 shows
the changes in the S/N ratio and correlation coefficient for
the waveform processed by SS [shown in Fig. 3(a)] as a
function of fn. Improvement of S/N ratio decreased with
increasing fn. This is because the difference of data length
in one frame. As the frequency resolution of Fourier
transform depends on the data length of the waveform,13)
the frequency spectrum of noise can be determined with
high resolution by using a long data length or a small fn.
The correlation coefficient is maintained at more than 0.92
for any frame number. There was no advantage of noise reduction performance in SS over EF and WS by using
the value of fnto 32 or more because improved S/N ratio
rapidly decreased. Thus, a smaller fn is suitable for AE
monitoring.
Time, t/μs
0 40 80
Output,
V/
mV
50
-50
V
in=2.0
V
/V
0
S/N : 27.0(dB)
(a)
0 40 80
50
-50 0
S/N : 37.4(dB)
(d)
0 40 80
5.0
-5.0
V
in=0.2
V
/V
0
0 40 80
5.0
-5.0 0
S/N : 5.1(dB) S/N :18.3(dB)
V
in=0.07
V
/V
0 40 80
2.0
-2.0 0
0 40 80
2.0
-2.0 0
S/N : 0.7(dB) S/N :10.9(dB)
(c)
(f)
(b)
(e)
Before SS
After SS
S
0A
0Time, t/μs
Time, t/μs Time, t/μs
Time, t/μs Time, t/μs
Output,
V/
mV
Output,
V/
mV
Output,
V/
mV
Output,
V/
mV
Output,
V/
mV
[image:3.595.136.459.66.484.2]Some researchers have reported that an artifact signal called musical noise or pre-echo, appeared just before the AE
signal when a small fn was used.14,15) This artifact signal
obstructs the analysis of the AE waveform, especially AE
source characterization16) and/or source location.17) This
artifact signal tends to appear when the signal amplitude changes rapidly and it is prevented by using a short sampling
interval.4,14,15)
3.4 Effect of over-subtraction factor
Figure 9 shows waveforms with Vin=70 mV [shown in
Fig. 3(c)] after they are processed with the SS technique
using¡=1, 4, and 8. In this case,fnwasfixed at 8. The S/N
ratio of the waveform was improved to 10.1, 19.5 and
24.7 dB as ¡ increased from 1 to 4 to 8. However, the
maximum amplitude of the processed signals decreased. The SS technique does not reduce only the noise signal but also a
part of the original signal when ¡ is too high. Figure 10
shows a change in the improvement of the S/N ratio of the
waveform before and after processing by SS the correlation
coefficient as functions of ¡. A trade-off was observed
between the S/N ratio improvement and waveform distortion
against the over-subtraction factor. Thus,¡is required to be
determined by a high noise reduction performance or low waveform distortion of AE signals. However, correlation
coefficient is suitable more than 0.9 to get an advantage to EF
and WS in Fig. 6. To be higher correlation coefficient more
than 0.9,¡should be 5 or less.
Time,
t
/
μ
s
0
80
Output,
V
/mV
0
5.0
-5.0
(a) Before filter
40
0
5.0
-5.0
(b) Spectral
subtraction
0
5.0
-5.0
0
5.0
-5.0
0
40
80
0
40
80
0
40
80
(c)
ε
-filter
(d) Wavelet
shrinkage
Time,
t
/
μ
s
Time,
t
/
μ
s
Time,
t
/
μ
s
Output,
V
/mV
Output,
V
/mV
Output,
V
/mV
Fig. 4 Comparison of waveforms before noise reduction (a) and waveformsfiltered by spectral subtraction (b),¾-filter (c) and wavelet shrinkage (d).
ε-filter(EF)
Wavelet Shrinkage(WS)
S/N ratio before process, (dB)
0 10 20 30
Correlation coef
ficient
1.0
0.25 0.5 0.75
SS EF WS
Spectral Subtraction
Fig. 6 Comparison of correlation coefficients for waveformsfiltered by spectral subtraction, e-filter, and wavelet shrinkage.
0 20 30
S/N ratio after process, (dB)
0 70
-10
10 30
Spectral Subtraction
ε-filter Wavelet Shrinkage
SS EF WS
S/N ratio before process, (dB)
[image:4.595.109.490.71.367.2] [image:4.595.329.521.418.571.2] [image:4.595.74.266.425.570.2]0
40
80
2.0
-2.0
0
S/N :10.9 (dB)
0
40
80
2.0
-2.0
0
S/N :9.8 (dB)
0
40
80
2.0
-2.0
0
S/N :4.9 (dB)
fn
=4
fn
=16
fn
=64
Time,
t
/
μ
s
Output,
V/
mV
Time,
t
/
μ
s
Output,
V/
mV
Time,
t
/
μ
s
Output,
V/
mV
Fig. 7 Waveformsfiltered by spectral subtraction withfn=4, 16, 64 and over-subtraction factor¡=2.
frame number, fn
Improved S/N ratio by SS, (dB)
70 13.0
6.0 10.0
10 20 30 40 50 60 0
Correlation coef
ficient
1.0
0.9
0.8
Fig. 8 Change in improvement of S/N ratio and correlation coefficient by spectral subtraction as function of frame number.
0
40
80
2.0
-2.0
0
S/N :10.1 (dB)
0
40
80
2.0
-2.0
0
S/N :19.5 (dB)
0
40
80
2.0
-2.0
0
S/N :24.7 (dB)
α
= 1
α
= 8
α
= 4
Time,
t
/
μ
s
Output,
V/
mV
Time,
t
/
μ
s
Output,
V/
mV
Time,
t
/
μ
s
Output,
V/
mV
Fig. 9 Waveforms filtered by spectral subtraction with frame number
fn=8 and over-subtraction factor¡=1, 4, 8.
Over-subtraction factor, α
Improved S/N ratio by SS, (dB)
25
Correlation coef
ficient
0 2 4 6 8
0 10 20
[image:5.595.69.511.65.521.2]0.8 0.9 1
[image:5.595.330.525.71.521.2] [image:5.595.72.267.586.713.2] [image:5.595.325.526.587.713.2]4. Developed AE Monitoring System with Noise Reduction Function and Its Application in AE Monitoring
4.1 AE monitoring system with noise reduction function by spectral subtraction
Figure 11 shows the block diagram of the developed AE monitoring system with real-time noise reduction by SS. Signals detected by an AE sensor were temporarily stored
in the first memory in the A/D board (first buffer). When
first buffer was completely filled with the data, the stored
data were transferred to the main memory in the PC, and signals were buffered in the second memory in the board simultaneously. As signals were alternately buffered in the two memories, the transferred signals were processed by SS simultaneously. When the maximum amplitude of the processed signal exceeded the predetermined threshold level, the processed data were saved in the hard disk. To process the entire transient data during AE monitoring without dead time, parallel computing was performed in this system. This developed system can acquire AE signals with a sampling frequency of up to 25 MHz (40 ns sampling intervals) with no dead-time. This sampling interval is
sufficiently small to prevent the generation of the signal by
SS process.
4.2 Monitoring of cylindical wave AE in noisy environ-ment
Figure 12 shows the experimental setup for monitoring
cylindrical wave AE signals using the developed system. An AE sensor was set on a steel pipe with 6000 mm in length, 114.3 mm in diameter, and 6 mm in thickness. An adhesive tape (JIS Z1901, vinyl chloride tape of 0.4 mm thickness)
was wrapped over 3000 mm long on the pipe. An artificial
noise was generated by a PZT transmitter placed on one edge of the pipe, and a white noise electronic signal with a peak-to-peak voltage of 5 V was applied to the transmitter for noise
generation. AE signals were excited by the HsuNielsen
source (pencil lead breaking) at a distance (L) of 13 m from
the AE sensor. The frame number fnwas set to 4 and
over-subtraction factor¡was set to 4.
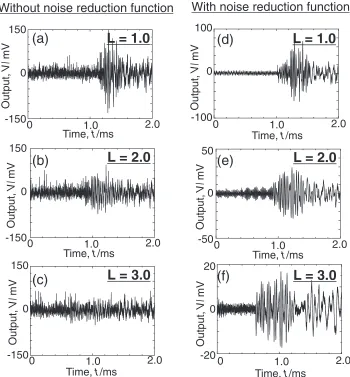
Figure 13 shows unprocessed waveforms [(a)(c)] and
waveforms processed by the SS technique [(d)(f)]. The
attenuation of amplitude of the AE wave increased with increasing L due to the absorption of the wave energy by the
adhesive tape. In particular, the S/N ratio of the unprocessed
wave (c) for propagated distance of 3.0 m was approximately 0 dB, and it could not be distinguished from noise. The AE
signal could be identified in the waveform (f) after waveform
(c) was processed and its S/N ratio was improved to 12.8 dB.
The S/N ratio of other processed AE signals were also
improved by approximately 10 dB. Thus, we found that the developed system is suitable for AE monitoring in a noisy environment.
5. Conclusion
An AE monitoring system with real-time noise reduction by spectral subtraction (SS) process was developed and demonstrated for cylindrical wave AE monitoring. The results are summarized below:
(1) Three types of noise reduction techniques, wavelet
shrinkage (WS), ¾-filter (EF) and SS were compared.
For an environment with a high background noise,
the correlation coefficient in the case of SS was higher
than that in other processes.
(2) The improvement in the S/N ratio and waveform
distortion by SS decreased with increasing frame
number. In contrast, improvement in S/N ratio
in-creased with increasing¡, and a trade-off relation was
observed between S/N ratio improvement and
wave-form distortion against the over-subtraction factor. SS had an advantage of noise reduction performance and
6000
2000 3000
6.0
1
14.3
Adhesive tape for corrosion protection (JIS Z 1901)
L
Pre-Amp(40dB) Developed AE monitoring system
(CPU:Intel CORE i7, A/D board:Alazartech ATS660)
Steel pipe
500
Hsu-Nielsen source (Pencil lead breaking) Function
Generator
Transmitter for noise (KGK, K-98)
AE sensor (PAC, PICO)
[image:6.595.55.284.439.580.2]Unit, L/mm
Fig. 12 Experimental setup for monitoring cylindrical wave produced by Hsu-Nielsen source in noisy environment.
Digitize data
Receive data
Spectral Subtraction AE
sensor
Save Signal
A/D board Noise Reduction Program
Developed AE Monitoring System
Check data
Over the threshold
Under the threshold
1st Buffer
2nd Buffer Store data
Send data Clear data
Check all data
[image:6.595.107.480.624.765.2]suppress of waveform distortion by using the value of
fnto 16 or less and¡to 5 or less.
(3) An AE monitoring system with noise reduction function was developed. The developed system can acquire AE signals with a sampling frequency of up to 25 MHz with no dead-time.
(4) Cylindrical wave AE signals produced by the Hsu–
Nielsen source were monitored in an environment
containing wide frequency band noise. The S/N ratio of
the AE signal was improved by approximately 10 dB using the SS technique.
REFERENCES
1) B. Muravin, G. Muravin, G. Kravertz and T. Duchin: Progr. Acoustic Emission13(2006) 183193.
2) T. Shiotani, X. Lio and H. Haya: J. Acoustic Emission24(2007) 205 214.
3) C. Scheer, W. Reimche and F. W. Bach: J. Acoustic Emission25(2008) 331340.
4) S. V. Vaseghi: Advanced Digital Signal Processing and Noise
Reduction, (Wiley, England, 1996).
5) D. L. Domoho:IEEE Trans. Inf. Theory41(1995) 613627.
6) H. Watase, K. Arakawa and Y. Arakara: IEICE Trans.E83-A(2000) 283290.
7) J. S. Lim and A. V. Oppenheim:IEEE Trans. ASSP26(1978) 197210.
8) S. F. Boll:IEEE Trans. ASSP27(1979) 113120.
9) R. M. Udrea, N. Vizireanu, S. Ciochina and S. Halunga:Signal Process. 88(2008) 12991303.
10) H. Saruwatari, S. Kajita, K. Takeda and F. Itakura: IEICE Trans. FundamentalsE83-A(2000) 866876.
11) M. Wevers, L. Rippert, J.-M. Papy and S. Van Huffel:NDT&E Int.39 (2006) 229235.
12) T. Matsuo and H. Cho: J. Japan Society for Non-Destructive Inspection
58(2009) 549555 (in Japanese).
13) M. Takemoto, H. Cho and H. Suzuki: J. Acoustic Emission24(2006) 1221.
14) M. Okazaki, T. Kunimoto and T. Kobayashi: Proc. the 2004 IEEE Int. Conf. on Acoustics (ICASSP, 2004) pp. 805808.
15) Z. Goh, K.-C. Tan and B. T. G. Tan: IEEE Trans. Speech Audio Process.6(1998) 287292.
16) M. Enoki and T. Kishi: Acoustic Emission beyond the Millenium, (Elsevier, Netherland, 2000) pp. 118.
17) Y. Mizutani, K. Nagashima, M. Takemoto and K. Ono:J. NDT&E Int. 33(2000) 101110.
L = 1.0
0
150
-150
0
1.0
2.0
L = 2.0
0
150
-150
0
1.0
2.0
L = 3.0
0
150
-150
0
1.0
2.0
0
100
-100
0
1.0
2.0
0
50
-50
0
1.0
2.0
0
20
-20
0
1.0
2.0
Without noise reduction function
With noise reduction function
L = 1.0
L = 2.0
L = 3.0
(a)
(b)
(c)
(d)
(e)
(f)
Time,
t
/ms
Output,
V/
mV
Time,
t
/ms
Output,
V/
mV
Time,
t
/ms
Output,
V/
mV
Time,
t
/ms
Output,
V/
mV
Time,
t
/ms
Output,
V/
mV
Time,
t
/ms
Output,
V/
[image:7.595.124.474.71.448.2]mV