University of Warwick institutional repository: http://go.warwick.ac.uk/wrap
A Thesis Submitted for the Degree of PhD at the University of Warwick
http://go.warwick.ac.uk/wrap/54103
This thesis is made available online and is protected by original copyright. Please scroll down to view the document itself.
Jet Fuel Spray Characterisation Using Optical Methods:
an Experimental Study of High Speed Fuel Injection Systems in Small Rotary
Engines
By:
Rami Zakaria
Thesis submitted in partial fulfilment of the requirements for admission to the degree of
Doctor of Philosophy in Engineering
School of Engineering
December 2011
Table of Contents
List of Figures ... vii
Abbreviations ... xiv
Acknowledgements ... xv
Declaration ... xvi
Abstract ... xvii
Chapter1. Introduction ... 1
1.1. Research Motivation ... 1
1.2. Experimental Conditions ... 3
1.3. Research Objectives ... 4
1.4. Thesis Structure ... 5
Chapter2. Fluid Atomisation ... 7
2.1. Fluid Disintegration Process ... 8
2.2. Atomisers ... 9
2.3. Factors Affecting Atomisation ... 10
2.4. Fluid Spray Characteristics ... 14
2.4.1. Droplet Size ... 14
2.4.2. Tip Penetration and Jet Velocity ... 18
2.4.3. Spray Cone Angle and Spray Pattern ... 21
Chapter3. Fuel Injection Systems ... 22
3.1. Introduction in Combustion Chemistry ... 22
3.1.1. Mass Transfer/Burning Rate ... 24
3.1.2. Discussion in light of the present project requirements ... 27
3.2. Fuel Injectors ... 30
3.3. Fuel Injection Strategy ... 32
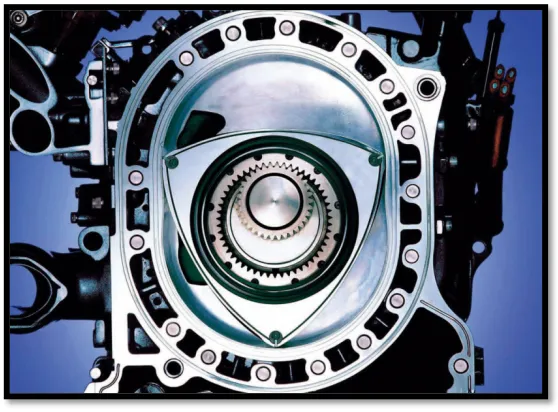
3.4. Rotary Engine Review ... 35
3.4.1. Fuel Injection in Rotary Engines ... 37
3.4.2. Injection-‐Ignition Timing ... 38
3.4.3. Ignition Arrangement in Rotary Engines ... 39
Chapter4. Optical Diagnostics in Multiphase Flows; Available Tools and Related Works ... 42
4.1. Introduction ... 42
4.2. Lasers Application in Multiphase Flow Characterisation ... 45
4.2.1. Laser Overview ... 45
4.2.3. Laser Doppler and Phase Doppler Techniques ... 48
4.2.4. Particle Image Velocimetry (PIV) ... 51
4.3. Direct Imaging Technique ... 54
4.3.1. Related Work ... 55
4.3.2. Discussion ... 57
4.4. Laser Imaging Technique ... 58
4.4.1. Related Work ... 58
Chapter 5. Light Scattering by Small Fluid Droplets ... 65
5.1. Background ... 66
5.2. Understanding Light Diffraction ... 68
5.2.1. Mie Theory ... 70
5.2.2. Rayleigh Solution ... 74
5.3. Influential Factors in Light Diffraction Patterns ... 75
5.3.1. Particle/Droplet Size ... 76
5.3.2. Angle of Observation ... 78
5.3.3. Particles Concentration and Volume ... 79
5.3.4. Refractive Index ... 81
5.3.5. Material Colour Against Light Wavelength ... 83
5.4. Related Experiments ... 84
Chapter6. Visualisation of the Heavy Fuel Spray Project; Instrumentation and Data Acquisition ... 89
6.1. Introduction ... 89
6.2. Engine Specifications and Fuel Delivery System ... 90
6.2.1. Fuel Injectors ... 93
6.3. Jet-‐ A1 (JP-‐8) Heavy Fuel Characteristics ... 95
6.4. Direct Imaging System ... 96
6.4.1. Direct Imaging System Setup ... 96
6.4.2. Data Acquisition in the Direct Imaging Method ... 97
6.5. Laser Imaging System ... 98
6.5.1. Development of Spray Visualisation Experimental Rig ... 98
6.5.2. Data Acquisition ... 108
6.6. Image Processing ... 117
6.6.1. Discrete Cosine Transform (DCT) in Spray Analysis ... 119
6.6.2. Principal Component Analysis in Spray Disintegration Detection ... 120
6.6.4. PIV analysis ... 122
Chapter7. Results and Discussion ... 123
7.1. Introduction ... 124
7.2. Spray Pattern ... 127
7.2.1. Mean Image and Spray Pattern Model ... 127
7.2.2. Spray-‐Sheet Area and Image Energy ... 128
7.2.3. Spray Pattern Detection Using Prolonged Exposure ... 130
7.2.4. Spray Cone-‐Angle Calculation ... 131
7.2.5. Spray Profile of the Lee Injector Using the MINSTAC Atomiser ... 134
7.3. Spray Development Process ... 137
7.3.1. Spray Tip penetration and Velocity ... 137
7.3.2. Spray Formation Map ... 140
7.3.3. PCA Indicator for Fluid Disintegration ... 143
7.3.4. Spray Breaking up on a Solid Surface ... 145
7.4. Flow Rate Calculations ... 147
7.5. Droplet Size Distribution ... 150
7.5.1. Arithmetic Mean-‐Diameter (AMD) ... 151
7.5.2. Sauter Mean-‐Diameter (SMD) ... 152
7.5.3. Probability Distribution ... 153
7.5.4. The Effect of the Heating Matrix on the Droplet Size ... 157
7.6. PIV and Droplet Tracking ... 158
7.6.1. PIV for Spray Development Analysis ... 158
7.6.2. Primary Atomisation ... 164
7.6.3. Microscopic Droplets Tracking ... 165
7.7. Spray Characterisation Discussion ... 168
7.8. Light Scattering of Seeding Particles in Stereoscopic PIV Systems ... 172
7.8.1. 3C-‐PIV for Jet Noise Test Experimental Rig ... 172
7.8.2. PIV Seeding Particles ... 172
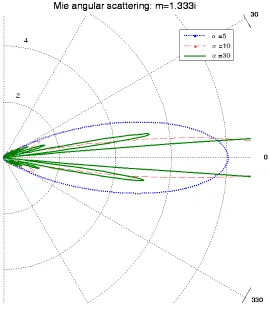
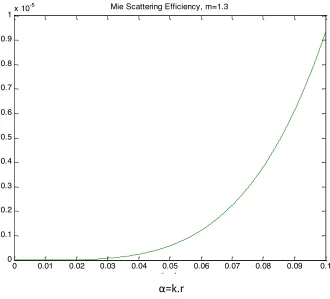
7.8.3. Light Scattering of the Seeding Particles (Mie Curves) ... 174
7.8.4. Evaluation of the Camera View Angle for Oil Smoke Seeding ... 176
7.8.5. Correlation Quality of Seeding Particles ... 180
Chapter8. Conclusion and Further Work ... 187
8.1. Conclusion ... 187
8.1.2. Droplet Size Measurement Using Microscopic Shadowgraphs ... 187
8.1.3. Novel Injection System ... 188
8.1.4. Velocity Distribution Using PIV ... 189
8.1.5. Light Scattering of Seeding Particles ... 191
8.1.6. Image Processing ... 192
8.1.7. Flow Rate Calculation and Evaporation Rate Estimation ... 193
8.2. Further Work ... 194
List of References ... 198
Appendices ... 213
Appendix 2.1 : Weber Number Graph ... 213
Appendix 2.2 : Static Drop Formation ... 213
Appendix 3.1 : Efficiency of a perfect engine for different air/fuel ratios. ... 214
Appendix 3.2: Plotting the evaporation rate of kerosene (Matlab code). ... 214
Appendix 3.3: Dependency of evaporation rate on ambient pressure. ... 215
Appendix 3.4: Influence of droplet size and air temperature on droplet lifetime. ... 216
Appendix 4.1: Kerosene drops breaking up ... 217
Appendix 4.2: Double pulsed image samples. ... 218
Appendix 5.1: Evaluation of the Laser Diffraction-‐base Particle Sizing Systems ... 219
Appendix 6.1 Cubewano Wankel engine design ... 220
Appendix 6.2: ThorLabs; NB1-‐K12 dielectric mirror reflectivity curve ... 220
Appendix 6.3 : Microcontroller operation software written by micro-‐C embedded language . 221 Appendix 6.4 Matlab code for drawing the greyscale fit of the calibration object ... 232
Appendix 6.5: gasoline injector image processing stages ... 233
Appendix 6.6: Image compression using DCT for reducing redundancy in the image matrix ... 240
Appendix 6.7 jet fuel ignition delay time JP8 ... 241
Appendix 7.1: Spray angle for Lee injector and atomiser at 280 Hz ... 242
Appendix 7.2: Lee atomiser close-‐up view of the primary atomisation region ... 243
Appendix 7.3 Spray penetration against time for the new 4-‐hole injector. The injector nozzle is opened for 2 ms time period. A mean velocity of 20 ms-‐1 is calculated at P=5 bar. Smaller particles usually have smaller velocity. ... 244
Appendix 7.4: Tip penetration during the first millisecond of a 2 ms injection pulse for both water and kerosene (JP-‐8). ... 245
Appendix 7.6 The duty cycle effect on the flow rate of the Lee medical dispenser at P= 3 bar,
f=500 Hz. ... 247
Appendix 7.7 : Samples of the PIV of a primary breakup 600 microsecond ASOI. Resolution: (1pixel=57 um). Time delay between double frames = 15 microsecond. ... 248
Appendix 7.8 : PIV for spray breakup on a surface ... 249
Appendix 7.9 PIV for kerosene against water ... 250
Appendix 7.10 Injecting upward into an air stream. ... 250
Appendix 7.11 top-‐bottom configuration; unbalanced intensity levels between 3C-‐PIV cameras using 0.3 microns (mean diameter) oil droplets. ... 251
Appendix 7.12: Al2O3 (m= 1.66+0.001i) Mie scattering pattern for particles range (0.2 – 1 microns) ... 252
Appendix 7.13 TiO2 Mie scattering profile ... 252
Appendix 7.14 Light scattering profile for oil seeding smoke and Al2O3 particles for 0.3 and 0.6 microns diameter. ... 253
Appendix 7.15: Matlab code for image correlation calculation ... 254
Appendix 8.1 CFD simulation for a gasoline conventional nozzle at 5 bar injection pressure ... 255
List of Figures
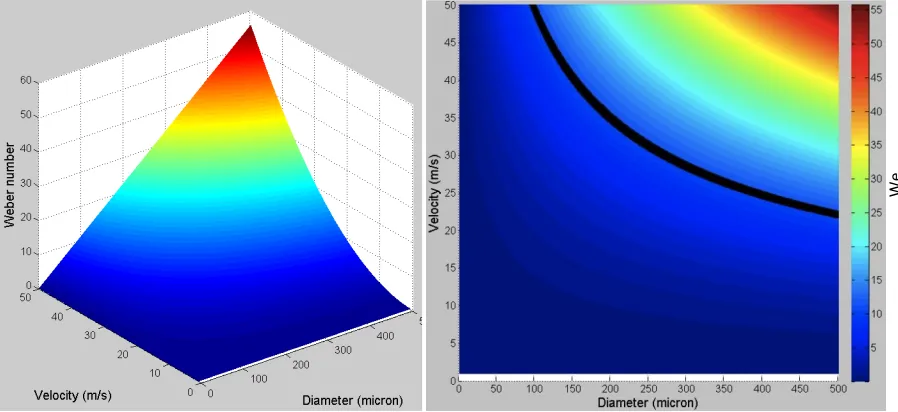
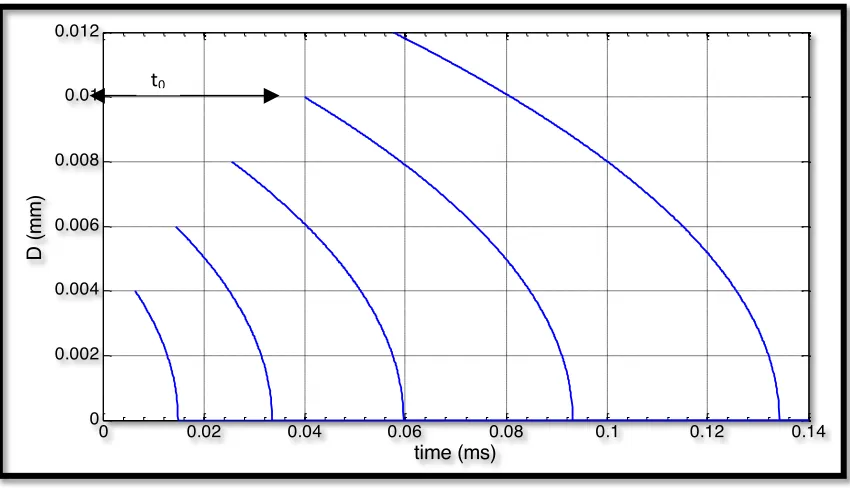
Figure 2.1 Fuel atomisation using plain orifice pressure atomiser at 5 bar injection pressure into unpressurised ambient; θ is the spray angle and S(t) is the tip penetration at the moment t. .9 Figure 2.2 Different modes of fragmentation of a liquid drop interacting with gas flow, presenting the Weber number effect on atomisation .13 Figure 2.3 Weber number for kerosene as function of droplet velocity and diameter showing the critical Weber number .14 Figure 2.4 Measured SMD against fluid velocity for kerosene jet fuel .18 Figure 3.1 (A)Fuel drops (heptane) burning rate against Initial droplet diameter, (B) Changes in kerosene drop diameter squared against time .26 Figure 3.2 Changes in small droplet diameter against time for kerosene at T= 1000 degree C, P=1MPa .28 Figure 3.3 Changes in drops diameter against time for kerosene Jet fuel at T= (1000,700,500) degree C, P=1MPa .29 Figure 3.4 Conventional electromagnetic fuel injector (EFI); (a) IWP gasoline electromagnetic injector (b) Cross section in gasoline injector [adapted from Robert Bosch GmbH (2006)] .31 Figure 3.5 (A) indirect injection (IDI) strategy and (B) direct injection (DI) strategy in IC
engines .33
Figure 4.3 The differential LDA method in calculating the velocity of a moving object .50 Figure 4.4 a. Raw and binary images of the diesel spray; b. Setup of a high-‐speed recording with backlight illumination .57 Figure 4.5 Image of diesel spray at 1500 Bar fluid pressure behind the nozzle. The high-‐ speed imaging system has a temporal resolution of 222 µs .57 Figure 4.6 a. PIV at 320 degree crank angle [Towers & Towers (2004)]; b. Spray velocity map at 1.8 ms ASOI and 5 MPa fluid pressure in GDI engine .60 Figure 4.7 Diesel spray by light scattering method .60 Figure 4.8 a. Early spray development (shadowgraph); b. (Part of) a processed image (1.23mm×0.98mm) with tracked particles .61 Figure 4.9 (a) Microscopic shadowgraph of one diesel droplet breakup (We=68). (b) raw image of the water droplets shadowgraph .62 Figure 5.1 Diffraction angles in 3D coordinates .70 Figure 5.2 Light scattering angle for different values of (α=k.r) at refractive index m=1.333
(Water) .76
Figure 6.7 Lee nozzles .95 Figure 6.8 Direct imaging system setup and fuel delivery circuit .97 Figure 6.9 Unprocessed images taken by Nikon D200 SLR camera at different flash power settings for DI water sprays generated by LEE medical injector at pressure P=6 bar .98 Figure 6.10 The laser imaging experimental for high speed spray jet .99 Figure 6.11 PCO camera systems 1. PCO2000, 2. PCO Pixelfly .100 Figure 6.12 Light sheet formation by cylindrical lenses .102 Figure 6.13 a. The hold and spike driver diagram, b. The control signal generated by the driver circuit .104 Figure 6.14 MSP430 development board developed by TI two processors (MSP430FG4618 and MSP430F2013) with an LCD display .105 Figure 6.15 YAPP control software snapshot .105 Figure 6.16 The laser sheet imaging system .107 Figure 6.17 The principle of the Scheimpflug correction .110 figure 6.18 field of view measurement using a flat ruler in the focal plane .111 Figure 6.19 The calibration plate in the field of view of the microscope, and the measurements of the focal depth .112 Figure 6.20 The Gaussian blur effect due to defocusing of the calibration plate (distances in microns; axes in pixels). Graph is generated by Matlab code .113 Figure 6.21 The microscopic shadowgraph set-‐up for imaging the kerosene droplet less than 100 microns in diameter .114
Figure 7.14 Kerosene spray formation map for the single-‐hole gasoline inject IPW023 at 5 bar differential pressure .141 Figure 7.15 Kerosene spray sheet area against time ASOI for pressure range (1-‐ 6) bar .142 Figure 7.16 PCA scores for the first 5 components at 0.4 and 0.6 millisecond (ASOI), 5 bar pressure, Tinj = 2ms, D0= 584 µm. (The first 5 components against time) .144 Figure 7.17 The first PCA component against the time after start of injection; fluid pressure= 5 bar, Tinj = 2, time step = 200 µs .144 Figure 7.18 The first PCA component against the time during the first 400 µs after start of injection; fluid pressure= 5 bar, Tinj = 2, time step = 50 µs .145 Figure 7.19 The spray breakup process on a sharp surface , and the colour-‐coded mean images; (a) without the surface, (b) with the surface .146 Figure 7.20 The flow rate of the Lee medical dispensing setup for 5 bar differential pressure. Each point represents 50000 injection events at the corresponding pulse width .147 Figure 7.21 The flow rate of the Lee medical dispensing setup for 5 bar differential pressure against the duty cycle ratio .148 Figure 7.22 The flow rate against pressure for IWP023 conventional gasoline injector at 240 Hz injection frequency .149 Figure 7.23 The flow rate against pressure for the Lee medical injector provided with the MINSTAC atomiser (D0=125 µm at 500 Hz injection frequency). The effect of the change in the duty cycle from 50% to 60% is presented .150 Figure 7.24 Part of raw microscopic image, showing kerosene droplets in air .151 Figure 7.25 The arithmetic mean diameter (AMD) of the Lee injector spray at the points 1, 1.3, 1.6 cm away from the central jet (4 cm downstream the nozzle tip) .152 Figure 7.26 The Sauter mean diameter (SMD) of the Lee injector spray at the points 1, 1.3, 1.6 cm away from the central jet (4 cm downstream the nozzle tip) .153 Figure 7.27 Droplet size distribution of the Lee injector at 3bar pressure. Only diameters less than 100 microns are taken into consideration .154 Figure 7.28 The percentage distribution of the Lee injector sprays at different pressure
values .154
the high resolution settings (3.5 -‐ 100 µm) .156 Figure 7.30 The influence of the heating matrix on the spray profile using IPW043 multi-‐hole injector at 3 bar pressure; (a) without the heater, (b) with the heater, (c) the heating matrix
design .157
Figure 7.43 The experimental result of the image average brightness against the scattering angle. The trend-‐line is the polynomial fit of the 5th order .178 Figure 7.44 The theoretical calculation of the Mie scattering profile for the smoking oil (diameters in microns, angles in degrees), and (b) the mean value (theoretical) of the light scattered by the smoke particles ranging from 0.25 to 1 micron in diameter .178 Figure 7.45 Image sample from the jet noise test using positions (2) and (3) ; Cam 1 at the top left of the rig; Cam 2 at the bottom left of the rig .179 Figure 7.46 Jet flow laser-‐sheet imaging using aluminium oxide seeding particles for the core and oil smoke for the flight-‐stream, at (a) 0D and (b) 1D downstream of the nozzle .181 Figure 7.47 Cross-‐correlation result using 46X46 pixels interrogation window and aluminium oxide particles for seeding .182 Figure 7.48 Cross-‐correlation result using 46X46 pixels interrogation window and oil smoke for seeding .182 Figure 7.49 Correlation maps for different correlation window size .184
Abbreviations
AMD: arithmetic mean diameter
ASOI: after start of injection (time)
DI: direct injection
DC: direct current
DCT: discrete cosine transform
DOF: depth of focus
ECU: engine control unit
ESD: Equivalent Spherical Diameter
FOV: field of view
GDI: gasoline direct injection
IDI: indirect injection
LASER: Light Amplification by Stimulated Emission of Radiation
MMD: mass median diameter
Nd-‐YAG: neodymium-‐doped yttrium aluminium garnet
PIV: particle imaging velocimetry
3C-‐PIV: three components particle imaging velocimetry
PCA: principal component analysis
Qi: absorbed heat (J)
Qo: rejected heat (J)
Re: Reynolds number
RE: rotary engine
SLR: single-‐lens reflex
SMD: Sauter Mean Diameter
TDC: top dead centre (engine stroke)
UAV: unmanned aerial vehicle
Acknowledgements
I would like to acknowledge and thank all those who have supported me in carrying out my
research. My first thanks go to Professor Peter Bryanston-‐Cross, for his conscientious
supervision and critical feedback. His encouragement and devotion have been very inspirational.
My gratitude goes to Optical Engineering Laboratory (OEL) staff members and Dr. Brenda Timmerman for the academic support, as well as to Dr David Hunter, Dr Jop Vlaskamp, Dr
Daniel Claus, and Mr Paul Hackett.
Thanks also go to University of Warwick for funding my research and providing generous
support that facilitated my studies; to Cubewano Limited, for financial and technical
support; to QinateQ NTF team for supporting the experimental work; to my friends, who
have helped me with this undertaking, sometimes in more obscure ways than they realized,
in particular, Malek Zerkli, Yi Wang, Iman Sheeha, Yamen Rahwan, Naia Naser, Ahmed Al
Makky, Siân Elizabeth Mitchell, Mahmoud Jeidani, Khalid Hathlool, Liz Hardiman, Vedita
Cowaloosur, Rifkhan Anver, Abdul-‐Qadir Alyasin, and Khaled Alhaj-‐Husain for pleasant
company during tea breaks and for their good humour.
Finally, it is to my family that I dedicate this work. Their belief in my abilities never ceased to
motivate me and carried me through to the end. Each and every one of them has been an inspiration to me throughout this undertaking.
Declaration
I hereby declare that, except where otherwise indicated, this thesis contains the results of
research undertaken by me in the School of Engineering at the University of Warwick. This
thesis is entirely my own work, and that no part of it has been submitted for any other degree or qualification.
Rami A.K. Zakaria
The University of Warwick,
August 2012
Abstract
This thesis was initiated by the need to develop a stable low vibration engine with a
high power to weight ratio. A new rotary (Wankel) engine was chosen to meet these
requirements. A further operating criterion was that the engine was required to use JP8
(aviation fuel). The difficulty created by the use of JP8 is that its combustion temperature is
higher than other conventional fuels, and preheating is necessary, especially in the case of
cold start. Thus, the question posed was, could a more appropriate and efficient method of
fuel delivery be devised?
This thesis presents the design and construction of a fluid spray visualisation system
for investigating the macroscopic and microscopic characteristics of fuel sprays using low
injection pressure up to 10 bar (1 MPa). Laser imaging techniques have been used for data acquisition. The thesis has been divided into several aspects.
Firstly, a background study of fluid sprays and fuel injection strategies was carried
out. This has centred on the relationship between droplet size and the combustion process.
It further investigated what differentiated the fuel delivery approach to Wankle from that to other engines.
Secondly, two families of fuel injector were tested and evaluated within the optical
engineering laboratory using deionised water (DI) water for safety reasons. The first family involved conventional gasoline injectors with several nozzle arrangements. The second
family involved medical nebulisers with several nozzle diameters. The evaluation of the fuel
injectors required developing a fluid delivery circuit, and a specific ECU (Electronic Control
the project then set up a test cell for performing experiments on JP8 fuel. The initial global
visualisation of the jet spray was made using a conventional digital camera. This gave a
measurement of the spray angle and penetration length. However, as the study moved to
the more precise determination of the fuel spray particulate size, a specialised Nd:YAG laser based diagnostic was created combined with a long range diffraction limited microscope.
Microscopic characterisation of the fuel sprays was carried out using a backlight
shadowgraph method. The microscopic shadowgraphy method was applied successfully to
resolve droplets larger than 4 microns in diameter. The spray development process during
an individual fuel injection cycle was investigated, presenting the frequency response effect
of electronic fuel injectors (EFI) on the spray characteristics when operating at high injection frequencies (0.25 -‐ 3.3 kHz). The velocity distribution during the different stages of an
injection cycle was investigated using PIV. The influence of the injection pressure on the
spray pattern and droplet size was also presented.
Novel fluid atomisation systems were investigated for the capability of generating an
optimum particulate distribution under low pressure. Finally, it was found that a new
electronic medical nebuliser (micro-‐dispenser) could be used to deliver the fuel supply with
the relevant particle size distribution at low flow rate and high injection frequency.
However, as yet it has not been possible to apply this approach to the engine; it is hoped
that it will yield a more efficient method of cold starting the engine. The characteristics of
this atomiser can be applied to provide a controllable fuel supply approach for all rotary
engines to improve their fuel efficiency.
The second part of this research discusses the droplets-‐light interaction using Mie
scattering theory was implemented into Three-‐Components Particle Image Velocimetry (3C-‐
PIV) tests to address a number of problems associated with flow seeding using oil smoke.
Mie curves were used to generate the scattering profile of the oil sub-‐micron droplets, and
therefore the scattering efficiency can be calculated at different angles of observation. The
results were used in jet flow PIV system for the determination of the optimum position of
the two cameras to generate balanced brightness between the images pairs. The brightness
balance between images is important for improving the correlation quality in the PIV
calculations. The scattering efficiency and the correlation quality were investigated for
different seeding materials and using different interrogation window sizes.
Chapter1. Introduction
1.1.
Research Motivation
The investigation into the characteristics of fluid micro-‐mists is of importance to the fuel
combustion application. Modern engine manufacturers worldwide have recently become
focused on improving the efficiency of their engines, in order to produce more powerful
engines that meet both the environmental and economic standards. Factors such as particle
size distribution and injection-‐ignition timing play an important role in improving the
thermal efficiency of the internal combustion (IC) engine. The mechanism of fluid
disintegration and the impact of the different operational parameters are still not
completely understood [Shao & Yan (2009)]. Therefore, the research on the dynamic
behaviour of fuel sprays is crucial to the fuel injection systems.
The size of a fluid droplet produced by an atomiser is directly related to the design and
quality of that atomiser; the more effective a fuel atomiser, the smaller droplets it produces.
Increasing the overall surface area of a fuel improves the evaporation rate and the burning range, leading to higher rates of the released power during the combustion process and
lower exhausted pollutant emissions.
The current study tackles the problem of fuel injection into a new small rotary engine
design. The small physical dimensions of the engine introduce several requirements for
These requirements are related to the fuel spray pattern, spray angle, fluid pressure, and
flow rate, but more importantly, to the effective fuel atomisation in producing droplets
within the microscopic range using low-‐pressure forces. For instance, it is required to
produce droplets less than 5 µm in diameter in order to perform a cold start of the engine.
These droplets are generated using an injection pressure less than 5 bar1 to suit the high
power-‐to-‐weight applications, such as unmanned aerial vehicles (UAVs). The current engine
has further restrictions in terms of its size and the type of fuel (JP8 in this case) that requires preheating to achieve an internal combustion due to its low flash point.
Advancement in optical metrology provides the necessary tools for a better
understanding of multiphase flows in engineering and industrial applications. Measurements on the size and velocity of a fluid droplet can be carried out by the light
scattering methods. The light-‐droplet interaction is a complex process with a large number
of parameters. Light scattering methods usually provide a point diagnosis rather than a
global representation of the flow. Recent attempts have been made to allow droplet sizing
using shadowgraph-‐imaging methods. These types of experiments, however, are usually reported for droplets larger than 30 microns in diameter, due to difficulties in producing
well-‐contrasted images of high-‐speed micro-‐droplets at a high imaging resolution. The
difficulty in the imaging based methodologies is to balance between the required spatial
resolution and the area of view.
The analysis of light scattering images at the macroscopic range can provide adequate
information about a spray jet geometry and development process in the time domain, while
the application of the microscopic shadowgraphy allows the physical measurement of
individual droplets. Both macroscopic and microscopic characteristics are used for the
evaluation of the fuel injection systems.
It is also advantageous to an engine designer to evaluate the performance of a fuel
injector against various operation parameters, such as fuel pressure and injection
frequency. The accuracy in injection mechanism is more important in the case of high-‐speed
engine (higher than 12,000 rpm), where the time for mixture formation, evaporation and
combustion is extremely short. Spray development process can be investigated by calculating the jet tip velocity and also by applying particle imaging velocimetry (PIV).
Knowledge associated with the interaction between micro-‐particles and light-‐waves is
also utilised in the stereoscopic particle imaging velocimetry (3C-‐PIV) topic, where changes
in the angle of observation have a great impact on the amount of the received optical
energy at an image sensor, and consequently on the correlation between the successive images of a flow.
1.2.
Experimental Conditions
The experiments were conducted on the Jet A-‐1 (JP8) kerosene-‐grade, using a maximum
of (10) bar injection pressure into an unpressurised ambient. The JP8 fuel is commonly used
in turbine-‐engined aircrafts. The low injection-‐pressure condition was required by the
engine manufacturer to reduce the operation energy, weight and vibration of the fuel
delivery system. Two families of fuel injectors were tested during the experimental work.
The first family (IWP series) included conventional 12V electronic gasoline injectors with
different nozzle settings. This type of injector operates at a maximum injection frequency of
by the Lee Company mainly for medical applications (drug delivery) that need micro-‐litre
and nano-‐litre dispense volumes. The selection of this injector was based on the low power
(500 milliwatts maximum), low weight and high frequency requirements. The top operation
frequency of this injector is as high as 3.3 kHz. The pulse width of this injector could be
accurately adjusted so that short injection pulses with a low flow-‐rate can be provided
during the intake stroke. Another advantage of this injector was the ability of replacing the end-‐nozzle, which can be as small as 125 microns in diameter. Another advantage was
Spray images were acquired in dark environment; i.e. in an isolated cell where all
devices were remotely controlled. Strict health and safety regulations were applied due to
the explosive nature of the fuel and the risk of direct exposure to class-‐4 and class-‐3 laser beams.
1.3.
Research Objectives
This research aims to contribute to the topic of fuel spray characterisation during the
fluid atomisation process using optical methods. Experimental work is made possible by
developing a visualisation system using digital imaging and laser sheets. The acquired data is
used for the evaluation of different fuel injectors prior to application in a new design rotary
(Wankel) engine. The light scattering theory is also applied on a 3C-‐PIV system, in order to
address a number of practical problems associated with the seeding process.
The first objective is to assess the injectors’ performance by developing a direct
visualisation system and a programmable control system for injectors’ pulse-‐width and
The second objective is to develop a laser-‐sheet imaging system for the characterisation
of the JP8 (kerosene) sprays and the frequency response of the injectors. The global fuel
spray characteristics of interest include the spray pattern, angle, density distribution, overall
area and penetration-‐velocity. The microscopic characteristics of interest include the droplet size and velocity.
Another objective is to study the formation process of the fuel mist in the time domain.
Velocity vector maps of the fuel sprays can be generated in both macroscopic and microscopic ranges using PIV.
Finally, the investigation of the light scattering pattern and the Mie curves of the sub-‐
micrometer droplets aims at estimating the light scattering efficiency of the oil smoke
seeders used in stereoscopic-‐PIV tests, and comparing the PIV results of the oil seeder with
other conventional solid seeding particles. The outcome of this study aims to improve the design of a jet-‐noise experimental rig by optimising the position of the PIV cameras with
respect to the laser-‐sheet.
1.4.
Thesis Structure
This thesis includes five main parts. The first part is a literature review of topics related
to this research project. In chapter two a general review on the subject of fluid atomisation
is presented. A description of the process of fluid droplet formation is provided and related
definitions are clarified. Fuel injection strategies in IC engines are presented in chapter
three, reviewing the up-‐to-‐date research conducted on rotary engines. An investigation into
the evaporation rate of kerosene is carried out and discussed in terms of the current engine
including a general description of instrumentation commonly used in this type of
measurement.
The second part (chapter 5) of the literature review comprises of a detailed study about
the light-‐droplet interaction topic and light diffraction of small particles. Mie theory in light
diffraction is applied in the study of the light-‐scattering efficiency against imaging angle for
sub-‐micron oil smoke droplets.
Methodology, instrumentation, data acquisition and data processing are all included in
the third part in chapter six, in which a detailed description is presented regarding the
experimental work conducted on the fuel injection systems and the development of the
experimental rig, illuminating the process of extracting the macroscopic and microscopic characteristics of the JP8 fuel sprays.
The last part presents results and discussions (chapter seven) about spray pattern, spray
development process, flow rate, droplet size probability distribution, injector performance and droplet velocity (PIV). The results of the laser scattering angle effect on a 3C-‐PIV camera
position and correlation quality are presented in this chapter too. The light scattering results
are based on the application of Mie theory on jet flow seeding (oil) submicron-‐droplets for
the experimental work during the jet noise test (in QinetiQ wind tunnel facilities). Finally,
Chapter2. Fluid Atomisation
This chapter briefly reviews the physical aspect of fluid atomisation in producing various
sprays, and the factors affecting spray characteristics. Fuel spray combustion is applied in
automobile engines, jet engines, gas turbines and industrial furnaces. The investigation into
fuel spray characteristics is critical to the internal combustion systems for the optimal
utilisation of the fuel energy. The chapter contains key definitions in the spray
characterisation topic, such as spray cone-‐angle, tip penetration and Sauter mean diameter
(SMD). An empirical study is presented to determine the relationship between the SMD and
the spray jet velocity based on experiments on the JP8 fuel. The analysis differentiates between the spray exit (discharge) velocity and the after-‐atomisation tip velocity.
Fluid spray characteristics of importance to the fuel combustion topic can be divided into
two main categories:
a. Macroscopic characteristics: including spray jet pattern, tip penetration, global velocity
and spray angle.
b. Microscopic characteristics: including droplet size distribution, droplet velocity
distribution and droplet spatial density.
2.1.
Fluid Disintegration Process
Fluid atomisation is the process in which a liquid volume is broken down into fine
droplets. The device that performs the atomisation task is referred to as “atomiser”. There
are various ways in which sprays can be produced. However, the fundamental principle in all
of them is to generate a sufficiently high relative velocity between the liquid and the
ambient medium.
If no external forces are applied, the surface tension of a fluid shapes it out into a
compact spherical form as this has the minimum surface energy. The disintegration of a
fluid bulk occurs when the surface tension is disturbed by external forces. This can be
practically produced by increasing the kinetic energy of the fluid by pressurising it through a narrow nozzle, or by providing mechanical energy using a high-‐speed rotor or vibrator.
The atomisation process goes through two main stages. A primary atomisation
where a volume of liquid is disintegrated into smaller segments, and a secondary
atomisation where fluid elements encounter further fragmentation due to interaction with the surrounding air and other droplets.
In the case of global spray imaging, the characteristics of interest include the spray cone-‐
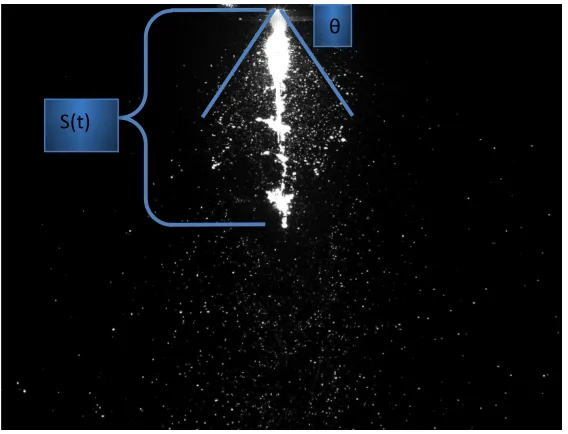
angle and the tip penetration against time. Figure 2.1 is an example of a fuel spray image
showing the spray angle θ and the tip penetration S(t) for a single injection pulse. The term
“injection frequency” represents the switching frequency of an injector which is the number
Figure 2.1 Fuel atomisation using plain orifice pressure atomiser at 5 bar injection pressure into unpressurised ambient; θ is the spray angle and S(t) is the tip penetration at the moment t.
2.2.
Atomisers
The geometry of an atomiser and its operation mechanism play the main role in
determining the macroscopic and microscopic characteristics of its spray. Beside the
pressure atomisers, there is a wide range of fluid atomisers depending on the mechanism of
producing the high velocity between the liquid phase and the gaseous phase such as rotary
atomisers, air-‐assist atomisers, air-‐blast atomisers and other types [Watanawanyoo, et al.
(2009); Chathcart, et al. (2005); Hoffman, et al. (1997); Lefebvre (1989)]. For example, in air-‐
blast atomisers the fluid is injected using low pressure but into a high-‐velocity air stream
[Kihm & Chigier (1991)]. The fuel injectors deployed in internal combustion engines are
mostly pressure atomisers. The main principle of pressure atomisation is to convert the
pressure into kinetic energy. Pressurised liquid jets travel faster when discharged into a
relatively low-‐pressure medium. The sudden drop in pressure between the nozzle and the S(t)
9
[image:29.595.158.442.70.287.2]ambient raises the fluid velocity (Bernoulli's principle)1, giving it the required energy for
breaking-‐up into a fluid mist. The exit velocity of a typical hydrocarbon fuel jet is
proportional to the square root of the applied pressure.
Ue=const !P (2-‐1)
There is a wide range of currently available pressure atomisers such as “plain
orifice”, “simplex (pressure-‐swirl)”, “dual-‐orifice”, “duplex”, “fan-‐ spray”, and “air-‐assist”
Atomisers. Plain orifice and simplex atomisers are commonly used in automobile fuel
injectors. Due to the relatively low viscosity of the automotive and jet fuels, it can be
enough to pressurise the fuel through a circular nozzle into the combustion space in order
to produce small fuel droplets. In this type of atomisers, spray particles have the highest velocity at the centre of the jet, which gradually decreases at the mist peripheries.
2.3.
Factors Affecting Atomisation
The influence of the pressure differential between the fluid medium and the
ambient has been investigated in several studies, mostly dealing with diesel engines. Due to
the variation in injection system designs and the large number of variables involved in the
spray characterisation, the relationship between the physical properties of an injector and
the spray characteristics is usually determined by empirical modules relying on experimental
measurements (or simulations in some cases). Some examples of these empirical modules
will be later presented in this chapter.
Beside the injection technique, spray characteristics are also affected by the physical
properties of the liquid and the surrounding air (or gas). The liquid viscosity, for instance,
resists any change in the fluid shape, and therefore, liquids with smaller viscosities can be
atomised at lower disruption energy. The high viscosity is associated with a small Reynolds
number1 which creates a time delay in the fluid breakup process.
Since hydrocarbon fuels show small differences in density (720-‐ 810 kg/m3), density
has little influence on the atomisation process [Lefebvre (1989), Ch1]. The effect of the
ambient gas density is reported several times in literature, where high values of ambient
density negatively affect the spray penetration owing to its dissipation effect on the spray energy, but at the same time help producing wider cone-‐angles.
The surface tension, on the other hand, plays an important role in fluid atomisation.
The surface area of all droplets together is larger than the surface area of the gathered liquid of the same volume. A spray with smaller particles has a bigger overall surface area.
The surface tension of a liquid can be understood as the force that resists this increment in
the liquid surface; meaning that liquids with higher surface tensions require higher energy
levels to be atomised. Common petroleum derived fuels have surface tensions range
between 23 and 32 mN/m at room temperature [Lefebvre (1989); Dormanb et al. (1951);
NOAA; Dechoz & Rozé (2004)], which is considerably low in comparison with 71-‐73 mN/m
for water at the same temperature. Liquids have smaller values of surface tension at higher
temperatures [Berthier(2008), Ch.2], and for that reason, heating up a fluid before
atomisation would help in producing sprays with smaller droplets for the same pressure
level.
1 The Reynolds number Re is a dimensionless parameter that represents the ratio of inertia to viscous force
µ ρl.Ul.r
The atomisation phenomenon, therefore, occurs when the external forces
represented by the fluid velocity and air density, overcome the internal forces represented
by the surface tension. This can be mathematically described by the dimensionless “Weber
number” [van Basshuysen (2009), Ch.3; Nigmatulin(1991),Ch.2 ] :
We= !gUl
2
D "
(2-‐2)
Where (D) is the diameter of the liquid drop, (UL) is the liquid velocity, (ρg) is the air density
and (σ ) is the liquid surface tension. The atomisation of a hydrocarbon liquid fuel starts at
Weber numbers bigger than 10-‐12.
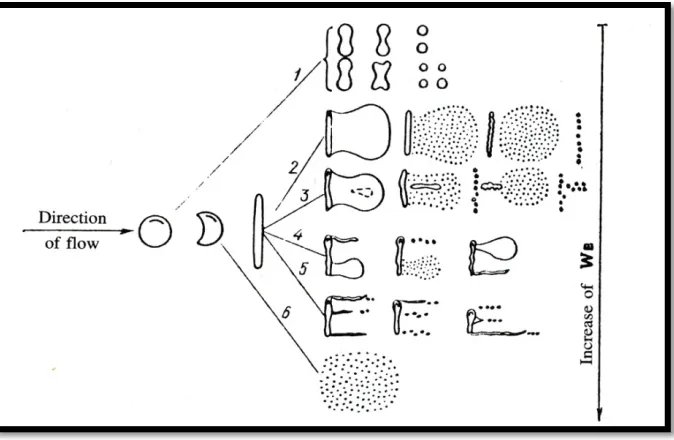
Liquid instability and atomisation modes are mainly controlled by the Weber
number1 [Pai et al. (2009), Guildenbecher et al. (2011)], which estimates if fluid drops have
sufficient kinetic energy to overcome the surface tension forces. At small Weber numbers, a
drop starts splitting up into smaller droplets in a relatively slow manner until the new
droplets reach a certain diameter where the Weber number is smaller than the critical value
of fragmentation. At higher Weber numbers, the disintegration process becomes faster in a more explosive-‐like mode, producing much smaller droplets, as presented in Figure 2.2.
1 Ohensorge number is also sometimes used in the qualitative fluid dynamic characterisation. It represents the
ratio between the viscous forces and the surface tension;

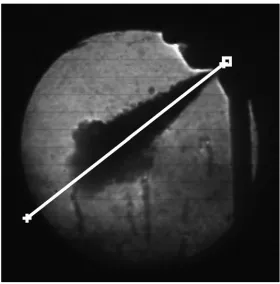
![Figure
4.9:
(a)
Microscopic
shadowgraph
of
one
diesel
droplet
breakup
(We=68)
[Parks,
et
al.(2006)]](https://thumb-us.123doks.com/thumbv2/123dok_us/9686325.470037/82.595.106.497.370.656/figure-microscopic-shadowgraph-diesel-droplet-breakup-parks-et.webp)