http://go.warwick.ac.uk/lib-publications
Original citation:
Lai, Stanley C. S., Dudin, Petr V., Macpherson, Julie V. and Unwin, Patrick R.. (2011)
Visualizing zeptomole (electro)catalysis at single nanoparticles within an ensemble.
Journal of the American Chemical Society, Vol.133 (No.28). pp. 10744-10747. ISSN
0002-7863
Permanent WRAP url:
http://wrap.warwick.ac.uk/38596/
Copyright and reuse:
The Warwick Research Archive Portal (WRAP) makes the work of researchers of the
University of Warwick available open access under the following conditions. Copyright ©
and all moral rights to the version of the paper presented here belong to the individual
author(s) and/or other copyright owners. To the extent reasonable and practicable the
material made available in WRAP has been checked for eligibility before being made
available.
Copies of full items can be used for personal research or study, educational, or
not-for-profit purposes without prior permission or charge. Provided that the authors, title and
full bibliographic details are credited, a hyperlink and/or URL is given for the original
metadata page and the content is not changed in any way.
Publisher’s statement:
This document is the unedited Author’s version of a Submitted Work that was
subsequently accepted for publication in Journal of the American Chemical Society, ©
American Chemical Society after peer review. To access the final edited and published
work see
http://dx.doi.org/10.1021/ja203955b
A note on versions:
The version presented here may differ from the published version or, version of record, if
you wish to cite this item you are advised to consult the publisher’s version. Please see
the ‘permanent WRAP url’ above for details on accessing the published version and note
that access may require a subscription.
Visualizing zeptomole (electro)catalysis at single
nanoparti-cles within an ensemble
Stanley C.S. Lai
†, Petr V. Dudin
†, Julie V. Macpherson and Patrick R. Unwin*
Department of Chemistry, University of Warwick, Coventry CV4 7AL, United Kingdom* Corresponding author: [email protected].
ABSTRACT The relationship between the structural proper-ties, such as the size and the shape, of a catalytic nanoparticle and its reactivity is a key concept in (electro)catalysis. Current understanding of this relationship is mainly derived from stud-ies involving large ensembles of nanoparticles (NPs). Howev-er, the results necessarily reflect the average catalytic behavior of an ensemble, even though the properties of individual parti-cles may vary widely. Here, we demonstrate a novel approach using scanning electrochemical cell microscopy (SECCM) to locate and map the reactivity of individual NPs within an elec-trocatalytic ensemble, consisting of platinum NPs supported on a single carbon nanotube. Significantly, our studies show that subtle variations in the morphology of NPs lead to dra-matic changes in (potential-dependent) reactivity, which has important implications for the design and assessment of NP catalysts. The instrumental approach described is general, and opens up new avenues of research in functional imaging, na-noscale electron transfer and catalysis.
A fundamental understanding of processes occurring at supported metal nanoparticles (NPs) is not only of scientific interest, but also technologically relevant, as NPs are employed in many (elec-tro)catalytic processes to optimize metal utilization.1-4 In particu-lar, the relationship between the size and structure of a NP and its catalytic activity has been studied extensively.1,5-13 However, as the vast majority of investigations have employed a large number of particles in a catalytic ensemble, the information obtained is limited due to unavoidable variations in NP size, shape and local environment.14
Efforts to circumvent this limitation have been made by shifting to single particle measurements,15-20 but such studies are rather
challenging.21 In general, single particle experiments fall into one of two categories. First, a single NP can be deposited on an elec-trode with a small surface area, either through elecelec-trodeposi- electrodeposi-tion15,16 or through collision of a colloidal NP in solution with the electrode.17 Valuable insights can be obtained, but such studies preclude an understanding of ensemble behavior and are limited in the range of electrode supports and environments that can be investigated. Second, attempts have been made to study NP en-sembles at a single particle level by scanning probe techniques, such as scanning tunneling microscopy19 and scanning electro-chemical microscopy.18 However, such studies are complicated by the challenges in locating a NP and in isolating the reactivity of a single NP from the influence of nearby NPs.
[image:2.612.320.550.167.448.2]The new approach reported herein, using scanning electrochemi-cal cell microscopy (SECCM),22 allows us to study heterogeneous (electro)catalysis, on a support of any character, shape and size.
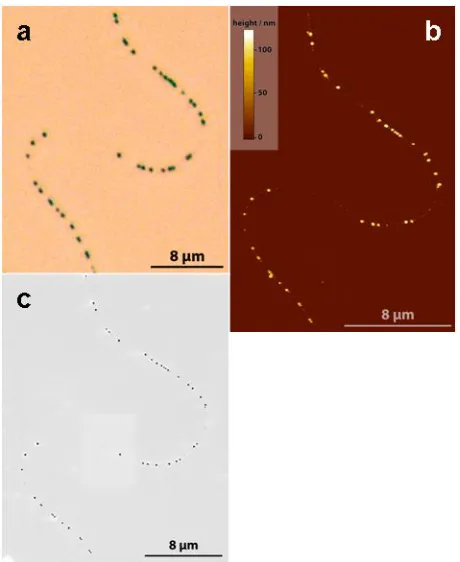
Figure 1 Microscopy images of Pt-NPs on a single carbon nanotube on a SiO2 substrate. a,Optical microscopy. b, AFM. c, FE-SEM
(col-or inverted f(col-or clarity).
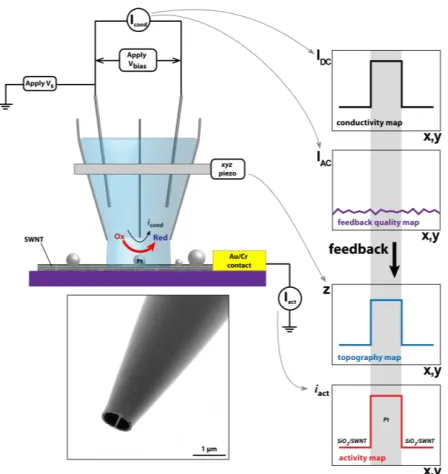
Figure 2 Schematic sketch of a scanning electrochemical cell micros-copy (SECCM) experiment. A dual barreled theta pipet pulled to ca. 1µm serves as a mobile localized electrochemical cell. The electrolyte solution at the end of the tip is brought into contact with the surface and a small amplitude oscillation is applied to the z-position of the tip. While scanning in the x-y plane, the ion migration (conductivity) current across the meniscus (Icond), the z-extension of the piezoelectric
positioner (z) and the surface activity current (Iact) are recorded. The
tip-substrate distance is held constant through a feedback mechanism in which the ac-component of the conductivity current (Iac) is
main-tained at a fixed value. In this way, maps of the dc conductivity (IDC),
feedback quality (IAC), topography (z) and surface activity (Iact) are
obtained simultaneously. Inset shows a FE-SEM image of the end of a tip.
Electrodeposition on an individual SWNT template produced an ensemble of electrically connected Pt-NPs23,24 and allowed us to
complement SECCM measurements with conventional high reso-lution microscopy, enabling direct correlation of reactivity and NP morphology (Figure 1). In addition, electrodeposition circum-vents the need for stabilizing ligands which may shield (certain sites) on the NPs for electron transfer. It can be seen clearly in the conventional optical microscope image(Figure 1a) that the sam-ple contains well-dispersed NPs. This finding was confirmed and quantified by atomic force microscopy (AFM) and field emission-scanning electron microscopy (FE-SEM) (Figures 1b-c) and re-vealed the NPs to be 100±14 nm. These particles have a ‘cauli-flower’-like morphology due to simultaneous hydrogen evolution at the electrodeposition potential25 (−1.0 V vs. Ag/AgCl for 0.2 s), as well as by agglomeration of smaller crystallites during the elec-trodeposition.26,27 Investigation of the catalytic behavior of NP agglomerates is of considerable value as catalyst sintering is a common process that occurs during catalytic runs and is speculat-ed as one of the main causes of fuel cell degradation.28,29 On the other hand, nanocrystalline morphologies of this type may actual-ly facilitate the oxygen reduction reaction,30 and insights into the behavior of agglomerates (rather than well-dispersed NPs) is of further importance as they are deployed in several important large-scale industrial catalytic processes.31-34
The SECCM set-up developed and used for electrocatalytic map-ping is shown schematically in Figure 2. SECCM provides three simultaneous functional maps of a surface: catalytic activity; to-pography and conductivity. The probe was a simple dual-channel borosilicate theta pipet, pulled to a sharp taper (ca. 1 µm
diame-ter). Ultimately, the spatial resolution is determined by the tip diameter, and research into smaller tips is ongoing. Each channel was filled with an air-saturated electrolyte solution (0.1 M H2SO4), forming a small meniscus at the end of the tip. A
palladi-um-hydrogen (Pd-H2) quasi-reference electrode (E0 = 50 mV vs.
RHE)35 was inserted into each channel and a fixed potential bias
(Vbias) of 200 mV applied between the two electrodes, causing a
small conductance current (Icond) to flow across the meniscus. The
tip was connected to a 3-axis (x-y-z) piezoelectric positioner, and a small oscillation (200 nm peak-to-peak amplitude, 83 Hz) was applied to the z-position of the tip. Rough positioning (within 10 µm) of the tip near the point of interest was performed by means of a 3-axis micropositioner and video camera monitoring (See Supporting Information). When brought into contact with the sample, Icond develops an alternating current (IAC) component.
Using IAC as a setpoint for the z-position of the tip, a constant
tip-sample separation was maintained while scanning the tip in the xy-plane, mapping the topography of the sample. As shown be-low, changes in the mean conductance current (IDC) allows further
unambiguous determination of the location of NPs. Concurrently, the local electrochemical (redox) activity of the substrate is mapped by holding it at the potential of interest (Vs+½Vbias vs.
Pd-H2) and measuring the current (Iact) passing through it. A data
point was typically recorded every µm and was the current aver-aged over a measurement time of 40 ms at up to 25kHz (1000 points). This brief residence time is advantageous in minimizing effects of passification and impurity adsorption from solution. Furthermore, it ensures the interrogation of only the most active sites on a NP; in some cases we were able to measure just a few hundred electrochemical events (zeptomole level detection) when contacting a single NP (vide infra). Finally, although the surface is repeatedly wetted and dried, no significant residues were ob-served with FE-SEM or AFM on the surface after performing SECCM measurements.
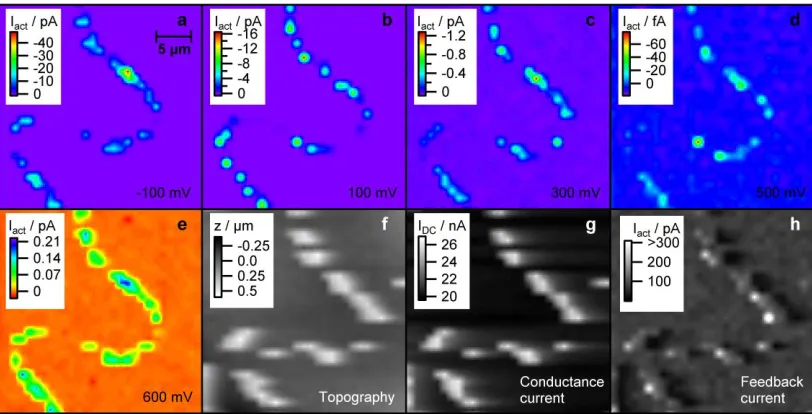
Typical SECCM images of the area shown in Figure 1 are shown in Figure 3. Figure 3a-e shows the electrochemical response (Iact)
of the sample held at various potentials (relative to Pd-H2). The
potentials shown correspond to hydrogen evolution on platinum (−100 mV), oxygen reduction on platinum at different driving forces (100, 300 and 500 mV),36 and the onset of Pt oxidation (600 mV). Comparing the electrochemical reactivity maps (Figure 3a-e) with the microscopy images of the sample (Figure 1), it is evident that there is excellent correspondence of the electrochem-ically active regions with the Pt-NPs. Moreover, reactivities as small as 10 fA, corresponding to electroreduction of ca. 600 O2
molecules during the 40 ms residence period of the SECCM probe, can be resolved at individual Pt-NPs. It should be noted that the currents observed are significant with respect to the noise levels over the residence period (< 30 fA at −100 mV and 100 mV, <3 fA at 300, 500 and 600 mV). Further confirmation that single active particles are identified with this approach comes from the ‘topography map’ and the mean conductance (IDC), both
of which pinpoint the locations of NPs (Figure 3f-g). The setpoint signal (Figure 3h; error image using AFM terminology) likewise highlights morphology changes of the samples.
measure-ments. On the other hand, second, the data for individual NPs display highly non-uniform values. This is clearly illustrated, for example, in the current density profile at 100 mV, where particle ‘C’ is much more active than others, or at −100 mV where parti-cle ‘A’ becomes inert (note: IDC proved that particle ‘A’ was
con-tacted electrochemically). Third, even for particles of similar size
based on AFM and FE-SEM (particles ‘A’ and ‘C’), very differ-ent reactivity profiles are seen. This is likely related to the more nanofaceted nature of ‘C’, evident from the FE-SEM images, which is expected to promote activity.30 Although most studies
only aim to relate reactivity
[image:4.612.103.509.111.318.2].
Figure 3 SECCM images of platinum particles deposited on a carbon nanotube of the area shown in Figure 1. a-e: Electrochemical response (cur-rents) at various potentials, relative to the Pd-H2 quasi-reference electrode. Note that the currents at 600 mV are oxidative currents. f: ‘Apparent’
surface topography. g: DC conductance current between the two barrels of the SECCM probe. h: Alternating current (ac) component of the con-ductance current. f-h were recorded at a sample potential of 300 mV.
Figure 4 Activity of selected (groups of) particles. a: High resolution FE-SEM images of selected example (groups of) particles from the array shown in Figures 1 and 3. b: Current density plots at various potentials (relative to the Pd-H2 quasi-reference electrode) for the selected (groups of)
particles. Note that the currents at 600 mV are oxidative currents. The current density was calculated based on spherical particles using AFM par-ticle heights (which were similar to the widths from FE-SEM). The dashed line in each plot corresponds to the average current density at that po-tential.
with NP size, this finding clearly demonstrates the importance of considering factors other than particle size. Finally, different (groups of) particles show very different potential-current pro-files. While particle ‘C’ shows the highest current densities (both cathodic and anodic) at all potentials, such trends are less evident for the other particles. For example, particle ‘B’ shows a compa-rable reactivity to particle ‘C’ at −100 mV, but only a fraction of the reactivity at all other potentials. Similarly, the activity of the two particles ‘D’ at −100 mV and 300 mV is about the same as
the average activity (as given by the dashed line in the figure), but is significantly below average at the other potentials. We resolve such large potential-dependent variations in activity, which have also been seen in other electrochemical systems when investigated at the microscale,37 in part, by virtue of the short residence time
and high mass transport rates of the SECCM system.
[image:4.612.79.536.393.576.2]elec-4
trodeposited platinum NPs on a single walled carbon nanotube,the reactivity of individual NPs has been resolved, revealing unique information on the wide dispersion of reactivity within the ensemble and demonstrating a variance in reactivity among ap-parently similar-sized NPs. These results have highlighted the importance of factors other than NP size effects, such as the mor-phology and local support in determining NP reactivity; an under-standing which has remained elusive in previous NP studies. We believe the SECCM method to be a versatile approach towards a full quantitative understanding of NP reactivity. Finally, we wish to emphasize that although this paper has focused on electrocata-lytic reactions, the approach is more general and could be extend-ed to study other heterogeneous systems where the reaction causes a change in conductivity current that can be detected by SECCM. Furthermore, we believe there are prospects to enhance the spatial resolution by an order of magnitude, through the use of smaller probes, which would reduce the need for model systems with widely-spaced active sites, as well as further expand the range of systems to which the technique is applicable.
METHODS
Sample preparation. Si/SiO2 (300 nm oxide film)substrates
(chips) with ferritin as a catalyst (1/200 dilution in water) were used for SWNT growth. The catalyst was deposited on one side of a chip as a ~ 1 mm line, using a glass capillary (ca. 150 µm diam-eter). Individual millimeter long pristine SWNTs were grown from the catalyst particles in an 1-inch diameter tube furnace at 1000 °C by heating the substrate under 300 sccm of H2 flow and
then introducing an Ar flow (300 sccm) through an ethanol bub-bler (carbon source) held at 0 °C for 25 min. Gold contacts (70 nm) with an adhesive underlayer of chromium (2 nm) were ther-mally evaporated through a shadow mask onto the chip (covering the ferritin line) to provide an electrical contact to the SWNTs.
Pt nanoparticles were deposited electrochemically from a solu-tion of 1.0 mM K2PtCl6 in 0.2 M NaClO4 in a three-electrode cell.
The sample was connected as the working electrode and dipped into the electrolyte in such a way that the gold band contacting the SWNTs was also in solution. Platinum nanoparticles were depos-ited onto the electrically conducting SWNTs by pulsing the elec-trode potential from 0 V to −1.0 V (vs. Ag/AgCl) for 0.2 s, and were investigated by SECCM immediately after preparation. No deposition on the SiO2 substrate was observed.
Methods. AFM images were recorded in tapping mode on a Veeco Enviroscope AFM with Nanoscope IV controller. AFM images were processed with the SPIP software package (Image Metrology). FE-SEM images were acquired with a Zeiss Supra55-VP microscope with the In-Lens detector at 10 kV, allowing the Pt NPs and the SWNT to be imaged simultaneously. SECCM images were processed and analyzed with the Igor Pro 6.21 soft-ware package (Wavemetrics).
AUTHOR INFORMATION
Corresponding Author
Author contributions
†
Both authors contributed equally to this work
ACKNOWLEDGMENT This work was supported by the En-gineering and Physical Sciences Research Council (EPSRC) and the European Research Council (Advanced Investigator Grant ‘QUANTIF’). We gratefully acknowledge fruitful discussions
with, and technical support from, Mr Neil Ebejer, Dr Alex Col-burn and Dr Aleix Guëll.
REFERENCES
(1) Somorjai, G. A. Science 1985, 227, 902.
(2) Daniel, M.-C.; Astruc, D. Chem. Rev. 2003, 104, 293. (3) Chen, A.; Holt-Hindle, P. Chem. Rev. 2010, 110, 3767. (4) Xu, W. L.; Shen, H.; Liu, G. K.; Chen, P. Nano Res. 2009,
2, 911.
(5) Xu, Z.; Xiao, F. S.; Purnell, S. K.; Alexeev, O.; Kawi, S.; Deutsch, S. E.; Gates, B. C. Nature 1994, 372, 346.
(6) S nche -S nche , C. M. Solla- ull n, . Vidal-Iglesias, F. J.; Aldaz, A.; Montiel, V.; Herrero, E. J. Am. Chem. Soc.2010,
132, 5622.
(7) Tian, N.; Zhou, Z. Y.; Sun, S. G.; Ding, Y.; Wang, Z. L.
Science 2007, 316, 732.
(8) Ahmadi, T. S.; Wang, Z. L.; Green, T. C.; Henglein, A.; ElSayed, M. A. Science 1996, 272, 1924.
(9) Sun, Y. G.; Xia, Y. N. Science 2002, 298, 2176.
(10) Burda, C.; Chen, X.; Narayanan, R.; El-Sayed, M. A.
Chem. Rev. 2005, 105, 1025.
(11) Ortalan, V.; Uzun, A.; Gates, B. C.; Browning, N. D. Na-ture Nanotech. 2010, 5, 843.
(12) Vajda, S.; Pellin, M. J.; Greeley, J. P.; Marshall, C. L.; Curtiss, L. A.; Ballentine, G. A.; Elam, J. W.; Catillon-Mucherie, S.; Redfern, P. C.; Mehmood, F.; Zapol, P. Nature Mater. 2009, 8, 213.
(13) Greeley, J.; Rossmeisl, J.; Hellmann, A.; Nørskov, J. K. Z. Phys. Chem. 2007, 221, 1209.
(14) Hashmi, A. S. K.; Hutchings, G. J. Angew. Chem. Int. Ed.
2006, 45, 7896.
(15) Krapf, D.; Wu, M.-Y.; Smeets, R. M. M.; Zandbergen, H. W.; Dekker, C.; Lemay, S. G. Nano Lett. 2005, 6, 105.
(16) Chen, S.; Kucernak, A. J. Phys. Chem. B 2003, 107, 8392. (17) Xiao, X. Y.; Bard, A. J. J. Am. Chem. Soc. 2007, 129, 9610.
(18) Tel-Vered, R.; Bard, A. J. J. Phys. Chem. B 2006, 110, 25279.
(19) Meier, J.; Friedrich, K. A.; Stimming, U. Faraday Discuss.
2002, 121, 365.
(20) Chen, S.; Kucernak, A. J. Phys. Chem. B 2004, 108, 3262. (21) Bard, A. J. J. Am. Chem. Soc. 2010, 132, 7559.
(22) Ebejer, N.; Schnippering, M.; Colburn, A. W.; Edwards, M. A.; Unwin, P. R. Anal. Chem. 2010, 82, 9141.
(23) Quinn, B. M.; Dekker, C.; Lemay, S. G. J. Am. Chem. Soc.
2005, 127, 6146.
(24) Day, T. M.; Unwin, P. R.; Wilson, N. R.; Macpherson, J. V. J. Am. Chem. Soc. 2005, 127, 10639.
(25) Penner, R. M. J. Phys. Chem. B 2002, 106, 3339.
(26) Bayati, M.; Abad, J. M.; Nichols, R. J.; Schiffrin, D. J. J. Phys. Chem. C 2010, 114, 18439.
(27) Jeon, H.; Joo, J.; Kwon, Y.; Uhm, S.; Lee, J. J. Power Sources 2010, 195, 5929.
(28) Wilson, M. S.; Garzon, F. H.; Sickafus, K. E.; Gottesfeld, S. J. Electrochem. Soc. 1993, 140, 2872.
(29) Mamat, M. S.; Grigoriev, S. A.; Dzhus, K. A.; Grant, D. M.; Walker, G. S. Int. J. Hydrogen Energy 2010, 35, 7580.
(30) Komanicky, V.; Menzel, A.; You, H. J. Phys. Chem. B
2005, 109, 23550.
(31) Devred, F.; Gieske, A. H.; Adkins, N.; Dahlborg, U.; Bao, C. M.; Calvo-Dahlborg, M.; Bakker, J. W.; Nieuwenhuys, B. E. Appl. Catal. A: General 2009, 356, 154.
(32) Schlogl, R. Angew. Chem.-Int. Edit. 2003, 42, 2004. (33) Erisman, J. W.; Sutton, M. A.; Galloway, J.; Klimont, Z.; Winiwarter, W. Nat. Geosci. 2008, 1, 636.
(34) Huber, G. W.; Iborra, S.; Corma, A. Chem. Rev. 2006, 106, 4044.
(35) Vasile, M. J.; Enke, C. G. J. Electrochem. Soc. 1965, 112, 865.
(36) Gewirth, A. A.; Thorum, M. S. Inorg. Chem. 2010, 49, 3557.