BACHELOR THESIS PSYCHOLOGY
“
LEARNING COMPLEX
MOTOR PROCEDURES
”
–
CAN THE ABILITY TO LEARN DEXTERITY GAMES
PREDICT A PERSON’S A
BILITY TO LEARN A COMPLEX
TASK?
Primary Supervisor: Dr. Martin Schmettow (CPE) Secondary Supervisor: Dr. Marleen Groenier (TG)
Objectives: MIS seems to be more difficult to perform than open/regular surgery. Because of
its differences to regular surgery it can lead to more risks and problems. These risks cannot be
fully explained by cognitive or ergonomic factors. As previous studies suggest different
correlations between the performance in MIS and specific cognitive factors can be found
(Anastakis, Hamstra, & Matsumoto, 2000). Because of MIS’s advantages it is important to
research which factors might predict an ability of skills that are needed to perform well on
MIS. The aim of this research is to study whether one dexterity task has predictive power for
learning another dexterity task. Moreover, the question is asked if these predictions can be
more accurate if the skills are viewed holistically rather than viewed as specified cognitive
abilities.
Method: 40 participants took part in this study. Each participant repeated four different
dexterity tasks for a specific amount of times. Per trial the time was measured and
observations were noted down. The measured time was used to estimate individual learning
curves.
Results: A Pearson pairwise correlation was exercised between the four different tasks per
parameter. The parameter virtual previous experience and the learning parameter showed no
strong correlation. In comparison a strong correlation could be detected between the Drawing
maximum performance and the Origami maximum performance.
Conclusion: In conclusion it can be seen that it is only partly possible to predict the ability of
a person to learn complex motor procedures by letting them perform dexterity tasks. It can be
seen that the maximum performance of two tasks seemed to be associated. If a person has a
talent in Drawing the person will also score high on the Origami task. It should be worked on
these results in more detail to examine if other tasks are connected, or any specific underlying
factors that might determine those tasks.
Keywords: Minimally Invasive Surgery (MIS), learning curve, dexterity tasks, holistic view,
Content
1. General Introduction ... 4
1.1 MIS: Advantages and Difficulties ... 5
1.2 Previous Studies ... 6
1.3 Learning curve ... 7
1.4 Conclusion ... 7
1.5 Research Question ... 8
2 Pilot Study ... 8
2.1 Origami ... 10
2.2 Rubber Band ... 11
2.3 Drawing ... 11
2.4 Buzz Wire ... 12
2.5 Duncan Loop ... 12
2.6 General aspects ... 13
2.7 Conclusion ... 14
3 Method ... 14
3.1 Design ... 14
3.2 Participants ... 14
3.3 Materials ... 14
3.3.1 Duncan Loop ... 15
3.3.2 Origami ... 15
3.3.3 Buzz Wire ... 16
3.3.4 Drawing ... 16
3.3.5 Measures and other materials ... 17
3.4 Procedure ... 18
3.4.1 Data collection ... 18
3.4.2 Data analysis ... 19
4 Results ... 20
4.1 Descriptive statistics ... 20
4.1.1 Virtual previous experience ... 20
4.1.2 Learning ... 21
4.1.3 Asymptote ... 22
4.2 Correlation analysis ... 23
4.2.1 Virtual previous experience parameter ... 23
4.2.2 Learning parameter ... 24
4.2.3 Asymptote parameter ... 25
5 Discussion ... 26
7 References ... 31
8 Appendix ... 34
8.1 Appendix A: Rulebook/ Instruction ... 34
8.2 Appendix B: Observation scheme ... 40
8.3 Appendix C: Randomized order of task for participants ... 41
8.4 Appendix D: Informed consent ... 44
8.5 Appendix E: Instruction (Origami Duncan Loop) / Drawing figure ... 45
1.
General Introduction
Over the last few years much progress has been achieved in the area of surgery.
Minimally invasive surgery (MIS) can be seen as the technique with the most powerful
development including important changes in surgery skills. MIS is a sort of surgery that
differs from regular surgery. The patient is operated on via a small key (keyhole surgery) or
stab wound. Richard Martin Satava had the most impact on MIS and started the revolution of
MIS (Gallagher & Smith, 2003). MIS offers many advantages regarding the superior cosmetic
results or less postoperative pain (Matern & Waller, 2014). Not only does this method have
many advantages, this surgery technique also poses problems. Because of its variations and
differences to regular open surgery it seems to be more difficult to establish the skills that are
needed for MIS. This results in a higher rate of risks and complications with new surgeons
applying this surgery strategy (Gallagher & Smith, 2003). Also the circumstances and the
setup of MIS surgery differs greatly from open surgery. Transforming the 2D image into the
real 3D situation or the “fulcrum effect” (see section Advantages and Difficulties) is only one
example of limits in MIS that demonstrates the difficulties and high demands that MIS poses
not only to new surgeons.
Since MIS includes many advantages, but is also prone to risks because of its limits
and differences to regular surgery, different studies tried to give an explanation of possible
underlying factors. It differs from person to person how good they perform in MIS. This leads
to individual differences. These differences might be explained by various aspects. According
to Gallagher & Smith (2003) dealing with MIS technology is related to ergonomic, cognitive
and training factors. Specific failures in MIS can be attributed to an insufficient ability to
interact and use the equipment and instruments in MIS (ergonomic factor). Another problem
is posed by the transfer of the 3D image while interacting with the instruments and seeing the
situation on a screen (cognitive factor). Finally, training seems to have an influence on the
performance in MIS. The ability to practice MIS without failure depends partly on issues of
training. According to Gallagher & Smith (2003) there is a necessity for long term training
and practice to succeed in MIS without failure.
Much research focused on the aspect of cognitive factors to explain the abilities of
performing MIS. Different cognitive abilities were looked into to see if there was any specific
correlation between a cognitive ability and MIS skills. An example of this is the cognitive
aptitude test. This test includes different cognitive aspects such as visual spatial ability,
perceptual skills, spatial memory, perceptual speed and reasoning. This test is used prior to a
level that is needed. In conclusion it can be said that the cognitive aptitude test is only related
partly/moderately to the learning curve of MIS (Groenier & Schraagen, 2014).
The results of different studies suggest different correlations between possible
predicting underlying factors and MIS skills. These different results seem to be ambiguous
and do not show the same correlations if they are replicated (see section Previous Studies).
Also it has to be kept in mind that there is a possible ‘publication bias’ of studies that found
no correlation/ significant results at all and therefore were not published. It seems that there is
no consent about the link between the ability to perform MIS and the different results that are
suggested by studies (Anastakis et al., 2000).
Due to these ambiguous results a different starting point should be considered to study
a precondition to perform MIS successfully. A reboot could be one possible option that does
not examine the cognitive factors as specific parts but takes into account the bigger picture/a
combination of these factors (holistic view). If these complex skills are viewed holistically it
may be possible to predict a person’s ability to learn complex tasks. The holistic approach supports the idea of taking a step back and determine if a task-based assessment procedure
could work at all. There may be the probability that by not examining specific cognitive
aspects, MIS skills could be represented as a whole and then further studied. Everyday
dexterity tasks can serve as a possible assessment tool to present the holistic view. Tasks such
as tying a knot or folding Origami include different cognitive components. These tasks can
therefore test a combination of factors (motor skills, spatial ability and strategies that
orchestrate these skills) rather than testing them one by one in abstract components (cognitive
aptitude test). Individuals may perform on a high level on different tasks that may speak for a
correlation of the underlying factors of these tasks. These underlying factors may be able to
predict the ability of an individual to learn complex motor procedures such as MIS. Learning
curves can then serve as an instrument that measures the acquiring of these motor skills and
can indicate differences and correlations between tasks and individuals.
1.1
MIS: Advantages and Difficulties
MIS is regarded as a standard for different operations and has been used for more than ten
years (Matern & Waller, 2014). This kind of surgery has been applied more and more
frequently because of its advantages. In comparison to regular surgery, MIS is superior in
cosmetic results. Because of the small stab wounds/ keyholes the scars are smaller. Also MIS
causes less postoperative pain and therefore patients are released from hospital more quickly
entails is the aspect of a faster recovery compared to the recovery time of regular open
surgery (Ponsky, 1991).
As opposed to the advantages that can be seen in MIS, this surgery technique also
poses problems and difficulties that should be taken into account. According to Gallagher &
Smith (2003) there is a higher risk of complications during the first 50 operations for new
surgeons. The first 10 MIS operations include the highest risk factor. This higher risk factor
and therefore greater complication rate can be related to the low amount of experience of
surgeons. Another explanation is the general difference between MIS and regular surgery.
One aspect that differentiates these kinds of surgeries is that the situation can only be grasped
in a 2D image on a screen which has to be then transformed to the actual 3D situation.
Another aspect that differs to the regular surgery environment is that the instruments respond
in an inverted way. This leads to more prone scaling (Groenier & Schraagen, 2014).
Moreover, because of the indirect way of interacting with the instruments the surgeons have
to operate in a different posture. This is the reason why MIS can lead to physical discomfort
of surgeons. Furthermore, there is a fixed axis to the movement of the instrument. This leads
to a limited axis of operating (fixed to body wall), which is also called the ‘fulcrum effect’
(Groenier & Schraagen, 2014).
1.2
Previous Studies
Different studies focused on cognitive aptitude tests including multiple cognitive abilities that
were tested in order to find out if they are related to MIS skills. Differences that could be
detected in learning curves are on account of differences in the cognitive aptitude (Buckley,
Kavanagh, Nugent, & Ryan, 2014; Groenier & Schraagen, 2014).
An example of a cognitive ability that has been tested is visual spatial ability. Previous
studies showed that this cognitive factor is correlated with the performance in MIS
(correlations between 0.42 to 0.46)(Keehner, Lippa, Montello, & Tendick, 2006; Luursema,
Buzink, & Verwey, 2010). Visual spatial ability can be detected in different aspects during
MIS. Transforming the 2D image mentally into the 3D real situation is part of visual spatial
ability (Fried, Satava, & Weghorst, 2004). Also the orientation that is needed within the body
itself is related to these skills (Cao, MacKenzie, & Payandeh, 1996). Visual spatial ability is
not the only aspect that seems to have a correlation with MIS performance. Gallagher &
Smith (2003) suggested that psychomotor skills are also related to MIS performance. Other
studies also tested other cognitive abilities such as spatial memory, reasoning, perceptual
All these abilities seem to be related to early stages of the learning phase of MIS skills
(Keehner et al., 2006).
Even though the correlations and relations between these cognitive abilities and MIS
skills have been found in studies, these results could not always be replicated by other studies.
Anastakis et al. (2000) refers to different correlations in different studies. A recent study by
Groenier & Schraagen (2014) demonstrates that these correlations cannot be replicated. This
research focused on the cognitive factors spatial memory, visual spatial ability, perceptual
speed, reasoning. No significant relations between the cognitive factors and the learning
curves could be found (Groenier & Schraagen, 2014). It seems to be a discrepancy between
the results of different studies and the suggested correlations. It could be possible that there
are underlying factors that determine MIS skills, but are only visible if viewed holistically.
1.3
Learning curve
Learning curves were established in 1885 by Ebbinghaus and were then further developed
into different types of learning curves. Learning curves describe in general how a person
learns something. This is presented in a graph with experience on the horizontal axis and
learning variable on the vertical axis. In these curves a rise can be detected to a limit. First the
curve increases fast but then nothing more changes and it stabilizes at a certain level. The
starting point of a learning curve can vary per person. It depends on the amount of experience
that the individual has already undergone before. The limit of a learning curve can be reached
in different ways. A steep curve describes a quick rise till the limit level and then stabilizes. In
contrast a stable/shallow learning curve reaches the same limit but it takes longer to reach it.
The limit levels, the starting points and the rise of the curve itself can be compared per
individual and per task to detect correlations. These correlations and differences can then
make a statement about the predisposition of people’s ability to learn complex motor
procedures. In this study the learning curves are going to be estimated with a non-linear
mixed effects model with exponential, used as a regression model for learning curves.
According to Heathcote, Brown, & Mewhort (2000) the main function of such a model is:
1.4
Conclusion
As seen above, laparoscopic surgery (MIS) has a more demanding learning curve compared to
open/regular surgery. Because of its differences to regular surgery it can lead to more risks
and problems. These risks cannot be fully explained by cognitive or ergonomic factors. As
previous studies suggest different correlations between the performance in MIS and specific
cognitive factors can be found (Anastakis et al., 2000). Because of MIS’s advantages it is
important to research which factors might predict an ability of skills that are needed to
perform well on MIS.
1.5
Research Question
The aim of this research is to study whether one dexterity task has predictive power for
learning another dexterity task. Moreover, the question is asked if these predictions can be
more accurate if the skills are viewed holistically rather than viewed as specified cognitive
abilities. A holistic view leads to the necessity to take a step back and to assess whether a
task-based assessment procedure could work at all. According to previous studies in the
literature it is expected that a holistic view might pose a better solution for predicting MIS
skills than viewing skills in an isolated way.
To research this hypothesis, the learning curves of different dexterity tasks will be
analysed. These dexterity tasks are not based on one cognitive factor but a combination of
different skills. It may be possible that one participant performs well on all tasks while other
participants always show the same pattern of failing specific tasks. Also two or more tasks
could show to be associated because if participants perform high in the one task they also will
have a talent for the other tasks. These results could then support a test that discovers a
predisposition of skills that are needed to perform MIS successfully. Therefore, the research
question is established if a person’s ability to learn a complex task can be predicted by letting
the person perform dexterity tasks.
2
Pilot Study
At the beginning of this study, five different candidate tasks were developed in connection to
the reboot. These five tasks are different dexterity tasks which are going to be described in
more detail. A pilot study is conducted to test the functionality of the setup of the tasks and to
acquire feedback for further improvement. Four participants took part in the pilot study.
Almost every task was done by every participant. Some of the researchers themselves did not
take part because of previous experience while constructing the task and the instructions
time was measured and the performance was noted. Furthermore, extra observations such as
strategy changes, difficulties and general changes were noted. These notes were later on used
for the improvement of the study.
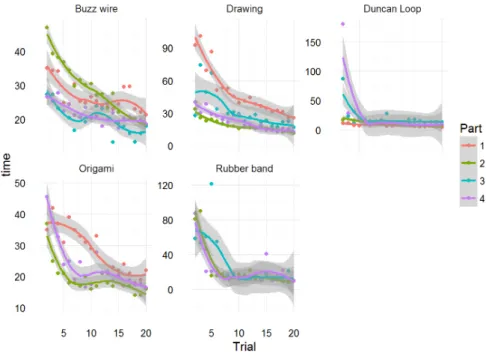
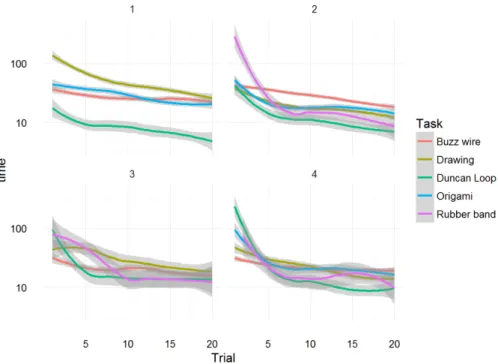
The results of the time measurements were used to establish different graphs (see
Figure 1, Figure 2). These graphs were used afterwards to detect if there was an improvement
during the 20 trials and if there are any varieties between different learning curves (task
dependent and participant depended). In relation with the observational notes a decision was
made for four of the five tasks to be used in the actual study. A description of the tasks and
improvements of the setups can be found beneath.
Figure 2. Comparison of learning curves between participants
2.1
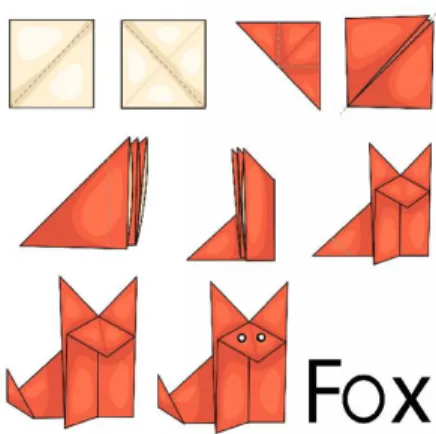
Origami
Origami is a Japanese art of folding paper. It involves spatial thinking to be able to understand
and interpret the given instructions. The given instructions with this candidate task were only
visual. This means that the instructional steps are only shown by pictures and no further
explanation. The instructions show how to fold a fox (see Appendix A). This is done by
following the nine steps of the instructions.
The graphs of the Origami tasks show a decrease of time with each trial for every
participant. At the end all learning curves stabilize. Some learning curves were not smooth but
had extra peaks and then improved again and stabilized. Compared with the observational
notes this can be related to the lack of motivation and sometimes also annoyance because of
the repetition of the tasks. If the participant was informed about the amount of the trials left an
improvement was visible. The performance per trial was difficult to measure. It was not
always clear which criteria determine if the fox is good enough. Also the participants stated
that they had difficulties estimating which aspect of the performance was prior (fast time or
perfection of the Origami figure). Furthermore, the paper that was used in the pilot study was
not perfectly cut and had only one color (compared to the paper used in the instruction with
one side colored).
Taking all these aspects into account, the Origami task seemed to be suitable for the
visible in almost every curve. Therefore, it was decided to pick this task and improve aspects
that seemed to be problematic. It was decided to use normal paper but cut that paper
professionally to prohibit any special difficulties.
2.2
Rubber Band
Creating figures out of Rubber Band includes spatial aspects to follow the instructions and
transferring those to make the figure. The Rubber Band task consisted of a specific figure that
needed to be replicated by using your hands and one Rubber Band. The figure chosen in this
task was a double star. For this, two different kinds of instructions were used and tested. One
set of instructions was a series of pictures with an explanation beneath every picture. While
testing these instructions it seemed to be too complicated to follow the more spatial steps that
needed to be performed. Because of these difficulties video instructions were also tested. This
video was easier to understand but problems arose following the speed of the steps. Most
participants could follow the steps to a specific moment and then had problems to go on or
made a mistake. Because of the kind of instructions, it was difficult to go back, stop or
re-watch a specific step. The participant needed to replay different parts of the video and
sometimes needed to stop it to follow the instructions completely. This resulted in higher
amounts of times per trial because the time to stop and go back in the video and then start
again was also counted. More details can be seen in the graphs described beneath.
As seen in the graphs almost every participant had a low previous experience on this
tasks because almost everyone started at their highest beginning level compared to other
tasks. Each result of the different participants showed an improvement in time and the curves
stabilized at the end. The observational notes suggested difficulties in the setup of the study.
Because of the spatial dimension of the tasks it was difficult to decide on the kind of
instructions that should be used. Instructions presented in different pictures were too
complicated to follow. The video that was used was better to follow and therefore possible to
understand but it seemed to be not practical during the pilot study. In conclusion the
difficulties with the setup seemed to be too grave and it was therefore decided to erase this
task from the actual study.
2.3
Drawing
The Drawing task was established based on the “fulcrum effect”. Because of the difficulties
interacting with something that moves in the opposite direction it was decided to construct a
paper on which a line of a figure should be traced that was only visible for the participant in
the mirror.
The graphs established from the Drawing task results showed the greatest variances.
There were different beginning levels and different kinds of improvements in time. According
to the observational notes the participants had difficulties deciding on what was more
important: The accuracy of the traced line or the time of the trial. Also the pen that was used
could influence the performance of the participant. A thicker pen led to a more difficult level
and therefore could lead to different results. In spite of these difficulties this task seemed to be
suitable for the actual study and was therefore chosen.
2.4
Buzz Wire
The Buzz Wire task was based on a typical toy for children. It was made out of wood and a
formed wire with different kinds of curves. If the wire was touched with the attached hook a
red LED lighted up. This light was used to count the mistakes. During the trials it was
difficult to count the mistakes because the LED lighted up too quickly. This resulted in
invalid measurements of the amount of mistakes.
The learning curves of the Buzz Wire tasks are more stable and do not decrease as
much as other learning curves. Still a decrease and stabilization in each learning curve of
every participant could be detected. Difficulties resulted from the setup and the construction
of the task itself. If the wire was touched it began to shiver. This added extra difficulty to the
task that was not the same over every trial. Also a problem with the goal of the tasks itself
could be seen. It was not clear enough what aspect the focus was on. If the participant just
took the time as the most important factor a different strategy could be observed than when
taking the amount of mistakes in consideration.
Considering all aspects, it was decided to use this task in the actual study. The setup
off the Buzz Wire was changed to be more suited for the task. The wire used in the new
apparatus was thicker and therefore more stable. Also, the amount of time the LED lighted up
was extended so counting the mistakes was the same with all participants. Furthermore,
three-dimensional aspects were added to the wire so that a greater decrease of the learning curve
was possible with a higher entry level.
2.5
Duncan Loop
The Duncan Loop is a specific knot used in different areas such as fishing. Also in this task
For this task an instructional figure was used. Before the participant began the finished knot
was shown to him/her to let them see what it should look like. For the task a white cord was
used. A problem arose with the ending of the knots because they dissolved and then were
disturbing for the participants.
The results of the Duncan Loop task showed a discrepancy between the participants.
Two learning curves started at a very high level of previous experience compared to the two
others. This seemed to be the result of earlier training and experience in sailing and scouting.
Another anomaly that could be detected was the fast decrease and also fast stabilization of the
learning curves. Just after five to ten trials almost every participant reached their maximum
performance and maximum performance did not change anymore.
Although two participants had previous experience in this task and therefore had no
significant learning curve, it was decided to use this task in the actual study. It seemed that
this task was suited for the purpose of the study and that the results of those two participants
might be an exception. The learning curves suggested that a maximum performance was
already reached earlier and 20 trials were not needed. Therefore, it was decided to shorten the
amount of trials to ten for the actual study.
2.6
General aspects
Also general feedback was conducted to improve the overall setup of the study. One question
was how to deal with struggles and problems of the participants with the tasks. If the
participant gets stuck (Duncan Loop: participant is stuck and is not able to recreate the loop
with the instructions and needs extra help; Rubber Band: participant is not able to follow
instructions and does not know at which step the mistake is) and is not able to go on or does
something wrong and does not get where the mistake is, how should the researcher react in
this situation. Therefore, an instructional handbook was created that gave the researchers rules
on how to react in these kinds of situations. This handbook also included information about
how to measure the performance because this seemed to be difficult for the researchers as
well as for participants.
Also the motivational aspect of the study seems to have an influence on the
performance. If the participants were informed about the number of trials left (last three trials)
they wanted to improve their time and get the best results for the last trials. It should be
Moreover, the performance of the participants during the tasks could be influenced by
the order the tasks are completed. Some tasks need more concentration at the beginning to
understand them (Rubber Band, Duncan Loop) than others (Drawing, Buzz Wire). If the
participant is already exhausted by the three tasks before this might be visible in the results of
the last task.Therefore, a randomized order of tasks should be used for each participant.
2.7
Conclusion
After evaluating and discussing all the collected data and observations, the decision was made
to exclude one task from the study. The Rubber Band seemed to be not suited for this type of
study. Because of the struggles with the kind of instructions it was more difficult to learn the
trick. Under these circumstances it would be possible to measure a greater amount of the
instructions than the learning of the task itself. The other four tasks were further developed
according to the evaluation and feedback that was resolved from this pilot study. The
description of this improvement and of the tasks themselves can be seen in the method
section.
3
Method
3.1
Design
In this study a within-subject design was employed. The experiment consisted of one group
that fulfilled all tasks in a randomized order. The tasks were the same with every participant.
3.2
Participants
A convenience sample of 40 participants (N=40) with an age range between 18 till 76 (M=
28.05; SD=14) was used in this study. 80% of the participants that took part in this study were
female, 20% were male participants. The group of participants consisted of 14 German
persons and 26 Dutch persons. The studies/jobs varied from 20% that had a job and 80% that
studied. 90% of the participants indicated to be right handed, 2.5% stated to use both hands
equally and 7.5% were left handed. There was no exclusion criterion for participating in this
study.
3.3
Materials
Four different tasks are used in combination with a short questionnaire interview section at
the end. The tasks were the Duncan Loop knot, Origami, Buzz Wire and a Drawing task.
Furthermore, there are instructions specifically created for the researchers and for the
3.3.1 Duncan Loop
The Duncan Loop task consisted of a 1.7-meter-long white cord with a width of three
millimetres. The ends of the cord were closed so that the cord would not get open and loose.
Otherwise the participant could get distracted and annoyed by a broken cord. An illustration is
used to instruct the participants on the method and technique to knot the Duncan Loop (see
Figure 3). A finished knot is shown to the participants before the trials begin to give them an
idea what the knot should look like.
Figure 3. Duncan Loop instruction
3.3.2 Origami
For the Origami task 20 white squared papers, with a size of 21cm x 21cm, were used per
participant. Per trial a new sheet of paper was used to diminish the effect of the previous
folded edges. We chose this specific size of the paper because this way it was not too big (so
it would be unpractical to fold it) and also not too small (so the measurements would depend
on the size of the participant’s hands). We chose a fox as a figure because this figure seemed to be on a basic level so that it was possible for almost everyone to follow the instructions but
also not too difficult that it would take a long time to understand the procedure and extra help
would be needed. The instructions consisted of eight coloured pictures that each described
one folding step (see Figure 4). The folding line was shown by a grey dashed line in the
instructions. The instructions were printed on an A4 paper and then were handed out to the
Figure 4. Fox Origami instruction
3.3.3 Buzz Wire
The Buzz Wire task is set up with different materials and can be dissembled for
transportation. The base consists of a wooden plank with two small extra planks that hold the
ends of the wire. The wire is formed with different sized curves and also has two
three-dimensional aspects. The wire is stable enough so there is no extreme shaking if it is touched.
A handle with an open loop of two centimetres is attached with a cable to the right side of the
apparatus. Also the wire is connected to a cable on the right side which leads to a 9V-battery.
A red LED light is interposed in this circle so every time the wire gets touched the red light
will blink. The wire can be dissembled so the curves have a lower risk of deforming when
transported and therefore are most likely to stay the same for every participant.
3.3.4 Drawing
The Drawing task consists of four different parts. A printed figure is used for Drawing. This
figure displays a circle and square combined into one figure (see Figure 5). The figure is
printed in two different sizes so a space of five millimetres can be used to trace a line
in-between. The printed papers are numbered from one till 20 so the progress of the task can be
followed afterwards. The participant uses a pen to draw this line. Because the goal of the task
is to draw according to the reflected image in a mirror, a cardboard box is used. This box is
used to hide the paper from the participant. The box has a round opening with a width of 20
centimetres. The site that is directed to the mirror is open. From the outside the box is
coloured in white not to distract the participant with the original print of the box. The mirror
Figure 5. Fill out template for Drawing task
3.3.5 Measures and other materials
Furthermore, other materials were used during this study. An informed consent was used that
assured that the participant understands the conditions of the study and their permission to
take part in the study. Also four different sets of instructions were handed out to the
participants per task. Each set explained what needed to be done. An instructional guide was
established for the researchers. By directing the study with fixed instructions it could be made
sure that the procedure per task stays the same with every participant. The guide presented the
utilities that are used during the task, the procedure of the tasks and extra notification for the
researcher to fill in the observational form (see Appendix). This form was made to capture
and record observations during the study such as strategy changes, motivation of the
participants, questions/difficulties of the participants. The needed time per trial is also noted
down. Furthermore, the trial numbers 10 and 17 had red marks to remind the researcher to
announce the amount of trials left. The time per trial was measured using a stop watch. Also
the performance per trial was noted down.
Three options were possible for recording the performance of the tasks Drawing and
Origami. A ‘V’ was noted down if the performance was good. A ‘X’ was given if the
performance was not completed or sufficient enough. Also the possibility exists that the
performance was sufficient but not good. Then a ‘V/X’ was noted down. There were also
three options for the researcher to record the motivation per trial. An ‘O’ meant that the
motivation of the participant was not clear to the researcher during the trial. An ‘M’ was noted
down if the participants seemed motivated and on the opposite an ‘F’ if the participant seemed
frustrated. With these records it would later be possible to track changings in the learning
3.4
Procedure
3.4.1 Data collection
After testing the different tasks during the pilot study and improving them further, we sent the
study to the ethical commission of the University of Twente for approval. After approval was
given we invited the participants and asked if they wanted to take part in the study. These
participants were then evenly divided between the four researchers.
Before the study, a randomized order of tasks per participants was established to
assure that not every participant followed the same order of tasks. After every 10th participant
the first task was changed so that only 10 participants began with the same task. The order of
the following tasks was different with every participant. With this structure we could assure
that there are no effects because of the structure (same task at the end, no learning effect
because of missing concentration). The scheme of the order of tasks also presented the
participant number so every form could be traced back to the participant but the data could be
handled anonymously afterwards.
The experiments took place in different settings. Most settings were chosen by the
participants themselves (at home) or took place in cubicles at the University of Twente. We
began the study by instructing the participant about general aspects of the study that could be
found back on the informed consent. Before the actual start of the experiment this informed
consent was signed by the participant and the researcher. Then the experiment began by
asking the participant general questions. A few questions dealt with the demographic
background of the participant (age, gender, nationality, job/study). Then we followed these
questions with more specific questions that are important for the analysis of the dataset
afterwards. Aspects such as left- or right handedness were asked to determine the preference
of the participant.
Afterwards the actual tasks began. Per task we handed out a set of instructions to the
participant (see materials for specific details). After letting the participant read those
instructions we asked them if anything was not clear and if they needed further explanations.
Then the trials began. The participant announced when he or she was ready and the clock
should be started.
During the experiment the researchers observed the participants. Depending on the
task we counted the amount of mistakes, we noted down any strategy changes, an impression
of the motivation of the participant was also made and any other extra aspects were marked
during the trials, we could trace special occurrences in the data set later on and explain them
in more detail.
After the tenth and the 17th trial the researcher announced the number of trials left to
the participants to motivate them to improve themselves for the last few trials. By
generalizing this comment, there are no differences in motivational effects per participant
caused by the researcher. If the participant was finished with the trial the clock was stopped
and the time was noted down in the form. Directly after every task, we asked the participant
about their experience with the task. These answers are also noted down for further analysis
of the dataset. Between every task we gave the participant a five-minute break, so that the
participant would not get frustrated and had time to fuel up.
After completing all four tasks we interviewed the participant with a questionnaire to
record their personal experience in general. The collected data (trial times, observations) that
was noted down by each researcher, was then transferred to an excel document where all data
from the 40 participants was grouped together. This data set was then used for further
analysis.
3.4.2 Data analysis
The results of each trial are then used to estimate learning curves. Before, the data set was
cleaned. No major cleaning needed to be done, only mistakes in the documentation of the data
were corrected and changed. To estimate the curves a non-linear mixed effects model with
exponential is used as a regression model for learning curves. According to Heathcote,
Brown, & Mewhort (2000) the main function of such a model is:
The parameter Asymptote means the level of maximum performance which is reached
asymptotically with continued practice. The Amplitude parameter describes the amount of
improvement. It shows the difference between the performance before the first trial and the
Asymptote. The last parameter is the Rate parameter which displays the overall speed of
learning.
Due to this formula above the problem arises that the amplitude parameter is
ambiguous. If the amplitude is low this might indicate that there is a low potential for good
maximum performance. Furthermore, this might suggest that the amount of learning is little
parametrization of the exponential model, that models (virtual) previous experience. The
alternative parameter Previous experience is shifted on the x axis in the new reparametrized
model. The learning curve of a participant with a high amount of previous experience is
shifted to the left, which makes it appear flatter in the observed range.
Three different parameters need to be analysed. First the virtual previous experience
parameter that indicates the entry performance. Second the learning parameter that
summarizes the rise of the learning curve. The last parameter is the asymptote parameter that
shows the estimated maximum performance. The learning curves of all four tasks were
divided into these three parameters. The statistical program SPSS 22 was then used to analyse
these variables in more detail. To assess the relations between all scale variables a pairwise
Pearson correlation was calculated for all three variables.
4
Results
4.1
Descriptive statistics
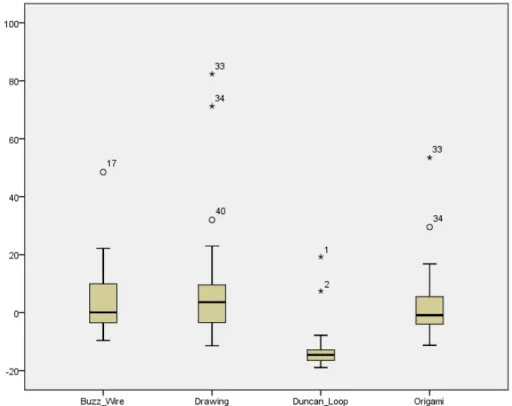
4.1.1 Virtual previous experience
The boxplot shows that the virtual initial performance was the lowest with the Duncan Loop
task. Two participants seemed to already have experience and had therefore a high
performance in comparisons with the others. The tasks Origami and Drawing are on the same
level in previous learning, although the Drawing task has a wider spectrum from minimum
and maximum previous learning. Furthermore, those two tasks had the highest initial
Figure 6. Boxplot of the parameter Virtual previous experience
Table 1.
Descriptive Statistics virtual previous training
M SD Minimum Maximum
Buzz Wire 0,52 2,56 -7,10 3,42
Drawing -1,38 2,91 -7,99 3,75
Duncan Loop 2,21 2,23 -5,12 5,05
Origami -1,34 2,62 -8,65 2,25
4.1.2 Learning
The learning parameter indicates an estimated slope of the learning curve. It can be said that
the smaller the value of this parameter the faster the participant was able to learn the task. It
seems that in general the Buzz Wire task was learned the quickest. This task is followed by
Drawing, then Origami and finally the Duncan Loop task. The lower and upper bounds of the
standard deviation are on the same level for every task with the exception of the Duncan Loop
Figure 7. Descriptive statistics boxplot of the parameter learning
Table 2.
Descriptive statistics learning parameter
M SD Minimum Maximum
Buzz Wire -.15 .07 -.32 .04
Drawing -.05 .11 -.19 .33
Duncan Loop .19 .24 -.13 .84
Origami .01 .13 -.24 .32
4.1.3 Asymptote
The lower the value the higher is the estimated maximum performance (Asymptote). This
means that the best mean performance can be detected with the Duncan Loop task. The other
three tasks are approximately on the same level. The lowest end-performance can be seen
with the Drawing task. Also there are a few outliers that had a lower end performance. These
Figure 8. Descriptive statistics boxplot of the Asymptote parameter
Table 3.
Descriptive Statistics asymptote
M SD Minimum Maximum
Buzz Wire 3,84 11,01 -9,61 48,50
Drawing 7,75 18,85 -11,43 82,34
Duncan Loop -13,30 6,85 -18,95 19,26
Origami 2,21 11,52 -11,26 53,46
4.2 Correlation analysis
A Pearson correlation coefficient was calculated to assess the relationship between each of the
three different tasks. For each parameter (virtual previous experience, learning, asymptote) a
pairwise correlation was exercised between the four different tasks.
4.2.1 Virtual previous experience parameter
No strong correlation could be detected for virtual previous experience (see Table 4). Three
correlations are in-between a confidence interval that has an upper end that can be defined as
moderate correlations. These possible moderate correlations can be seen between the
(see Table 4). This means that these correlations might be higher and therefore speak for a
relation between those variables. But these correlations could also lie on the lower end of the
interval and therefore be not meaningful. Contrary one moderate negative correlation can be
detected between the tasks Duncan Loop and Buzz Wire (r = -.29, n = 40) 95% CI [-.52, .02].
This negative correlation might describe that the previous experiences between those two
tasks are not related.
Table 4.
Pearson Correlation Coefficient of virtual previous experience variables between four tasks
Correlation Coefficients
Buzz Wire Drawing Duncan Loop Origami
Buzz Wire 1 - - -
Drawing 0 [-.43,.40] 1 - -
Duncan Loop -.29 [-.52, .02] .03 [-.16, .29] 1 -
Origami -.06 [-.39, .17] .17 [-.13, .43] .03 [-.25, .45] 1
4.2.2 Learning parameter
There was also no strong correlation visible of the learning parameter between the four tasks
(see Table 5). Also with this parameter some correlation lay in between a confidence interval
that has an upper bound that indicates a higher correlation that can be described as moderate.
These confidence intervals are between the tasks Drawing and Buzz Wire, Duncan Loop and
Buzz Wire, Drawing and Duncan Loop, Drawing and Origami, Duncan Loop and Origami. In
comparison to the confidence intervals these upper bounds are higher than with the
confidence intervals of virtual previous experience.
Table 5.
Pearson Correlation Coefficient of learning variables between four tasks
Correlation Coefficients
Buzz Wire Drawing Duncan Loop Origami
Buzz Wire 1 - - -
Drawing .39 [.13, .62] 1 - -
Origami .02 [-.22, .25] .16 [-.11, .46] .08 [-.38, .52] 1
4.2.3 Asymptote parameter
In contrast to the other parameters a strong correlation between the asymptote parameter of
Origami and Drawing could be detected (r = 0.852, n = 40) 95% CI [0.68, 1.02]. A scatterplot
summarizes this result (see Figure 9). A talent in Origami is correlated with a talent in
Drawing. Also a moderate correlation with the upper bound of the confidence interval
between the tasks Origami and Duncan Loop can be detected.
Table 6.
Pearson Correlation Coefficient of maximum performances between four tasks
Correlation Coefficients
Buzz Wire Drawing Duncan Loop Origami
Buzz Wire 1 - - -
Drawing .07 [.18, .36] 1 - -
Duncan Loop .04 [-.26, .26] .03 [-.12, .28] 1 -
Origami .03 [-.17, .38] .85 [.44, .93] .17 [-.06, .42] 1
Correlation between the Origami maximum performance and the Drawing maximum
performance
5
Discussion
The aim of this research has been to study if one dexterity task has predictive power for
learning another dexterity task. Moreover, the question was asked if these predictions are
more accurate if the skills are viewed holistically rather than viewed as specified cognitive
abilities. The tasks that were chosen in this study were Origami, Drawing, Duncan Loop and
Buzz Wire. The results indicated different correlations with every variable (virtual previous
experience, learning, asymptote). Only one pair showed a strong correlation in the maximum
performance. It seemed that Drawing and Origami are connected. If the connection was seen
in the maximum performance, it means that a person that performed high in the Drawing task
also had a talent for Origami and vice versa.
Also another correlation was seen between Drawing and Buzz Wire when it comes to
the learning parameter. According to Bolboaca & Jäntschi (2006) a correlation can be
described as strong if it is above 0.8. The correlation between those variables was only 0.39.
Correlations lower than 0.5 are defined as weak correlations (Bolboaca & Jäntschi, 2006).
That is the reason why only the correlation between Drawing and Origami is chosen as a
strong correlation and should be further worked on. Furthermore, these differences in
correlation can have grave consequences. If the correlation is only moderate, this might
influence the practical use in different areas later on. If this correlation is used as a basis in
tests for future surgeons it is important that the correlation the test is based on is strong
enough. Otherwise surgeons might be wrongly chosen as suited because the test was based on
random noise in the study. This might resolve in dangerous incidents during surgery with the
possibility of death. Moreover, there is also the possibility that surgeons have a talent and are
suitable for MIS but are disregarded because of misguided tests. Both possibilities result in
high costs that could be prevented.
The question arises if these results can still display a holistic view to predict MIS skills
with dexterity tasks rather than with specific cognitive ability tasks and tests. The results
showed that only one correlation was strong enough between two tasks. The other tasks did
not seem to be related with each other. This might speak for at least three underlying factors.
The correlating tasks could have one factor or more than one factor in common, whereas the
related tasks as holistic because the correlation might be based on only one common factor.
This one common factor might not display a holistic view.
The Pearson correlations were calculated between three different aspects of the
learning curves. First the correlations were studied within the four different task variables of
the virtual previous experience aspect. These variables present the balanced entrance level for
each task. Only weak correlations were detected between the tasks. This implies that the
virtual starting level was different with every task and cannot be associated. This means that
every participant had a different initial performance level that was not related to any other
initial performance level. For MIS this might mean that the previous experience does not play
a role in estimating the future performance. Therefore, a repetition of tasks is needed (not only
during the assessment tests) to detect the potential of future surgeons. This resolves in higher
costs for the training/test because more time is needed for repeating the tasks.
Furthermore, the correlations for the learning parameters were calculated. The results
displayed weak to moderate correlations that spoke against a holistic view. For further
research it might be interesting to study why these tasks are not related/correlated. It might be
possible that the motivation of the participants and/or the variety of strategies used had an
influence and explains these results. In general, the learning variables indicate the rise in each
learning curve for different tasks. If there is no correlation detectable, that might indicate that
it is not possible to estimate the time needed to learn a task like MIS. It might be that surgeons
in training acquire the skills fast. This means that the training will be cheaper. But also the
opposite can be true that future surgeons have a talent for MIS but acquiring those skills takes
a longer training time and therefore results in higher costs. Based on the results it can be
stated that repetition of task is an essential factor, not only for the training later on but also for
future ability tests. The perfect level of repetition needs to be found that is high enough but
also not too high and exhausting (time and money consuming) to serve as an optimal model
that estimates the maximum performance.
The last variables that were studied were the maximum performances. The maximum
performance represents the highest level that could be reached in a task. As described above
one strong correlation was detected (Drawing/ Origami). It can be said that the maximum
performance remains stable and does not change much. Therefore, this variable can be related
to the future maximum performance of surgeons. The correlation between those four variables
indicates an important aspect. If a person has a talent in one task (Origami) the person also
If only the correlation between Drawing and Origami is strong enough to be used later
on it is important to consider further developments for this study. Only one strong correlation
was found. This means that only two tasks are correlated. It may be possible that other tasks
exist that are also related to this task. In this study only four tasks were tested. But more
dexterity tasks exist that might show a correlation and therefore support the holistic view.
If there are no other dexterity tasks that are connected to Drawing and Origami, the
underlying factors should be analysed in more detail. An exploratory factor analysis might
present the amount of underlying factors. This factor analysis could be based on the general
performance of the participants. A mean performance could be calculated that shows the
average performance of each participant. Then it should be looked into the common aspects to
find out what the underlying factor/s between Origami and Drawing might be. It might be
possible that mental rotation is one underlying aspect (of a combination of different
underlying skills) that might be important in both tasks. For Origami the participants had to
rotate the instructions in their mind to build a figure in 3D. Also the Drawing task displays
aspects of mental rotation. To follow the line, the reflection in the mirror has to be rotated.
Furthermore, it could be tested if a person scores high on both, a mental rotation task and the
two dexterity tasks. Other studies also could be used to determine possible underlying factors
that might be associated with these tasks.
Previous studies focused more on specific cognitive abilities rather than on tasks that
determined MIS skills as holistic. As described in the introduction the results of these studies
were ambiguous (Anastakis et al., 2000; Wanzel, Hamstra, Anastakis, & Matsumoto, 2002).
But it seems that some factors might account for part of the variance in MIS skills. According
to the systematic review by Maan, Maan, & Darzi, (2012) the abilities visual-spatial and
psychomotor seem to be suited for the usage of assessing candidates for future surgeons.
Moreover, Kramp, Det, Hoff, & Veeger, (2016) suggested also perceptual ability to be an
important factor. Also the systematic review by Langlois, Bellemare, & Toulouse, (2015)
considered spatial ability to be important for assessing future candidates.
Therefore, it might be possible that these factors are related to the dexterity tasks used
in this study. The cognitive aspect spatial-ability describes the capacity of someone to reason,
remember and mentally manipulate spatial relations. Mental rotation tests are, for example,
used to assess this specific cognitive ability. In a mental rotation test it needs to be decided if
an image is a rotated copy of the original image. Mental rotation is also needed for the
Drawing task to be able to rotate the reflected image in the mirror to follow the figure in the
Furthermore, according to Boakes, (2009); ÇAKMAK, (2009) it seems that Origami
tasks are not only related to spatial abilities but Origami instructions are able to improve
spatial abilities in students. If spatial ability is connected to Origami and also to MIS skills,
this cognitive factor might be the underlying factor in both tasks that partly determines
someone’s skills for MIS.
In the article by Kaufman, Wiegand, & Tunick, (1987) the psychomotor skill is
described as mix out of different components such as manual dexterity, balance and limb
speed. Manual dexterity accounts for a part of all dexterity tasks in this study. Especially the
Buzz Wire task can be described by this definition. To perform well on this task not only
manual dexterity is needed but also balance not to touch the wire, and speed to score high on
the performance trial time.
According to Kaufman et al., (1987) spatial perception is a skill that is related to
psychomotor skills. This perception skill can be described as an ability to judge the relations
between and within objects in space and make statements about their size. This skill also
includes someone to be able to manipulate an object mentally and visualize the effects
(Kaufman et al., 1987). Almost every task needs to be mentally manipulated. The instructions
of the Duncan Loop task need to be transformed to fit in the real situation. The same goes for
the Origami instructions. Two dimensional images need to be manipulated to the real three
dimensional situations. It follows that all three factors that might account for some variance of
MIS skills can also be seen in this study. The dexterity tasks might all include some aspect of
these cognitive skills. But it still might be possible that the predictive value of the cognitive
abilities as well as the predictive value of the dexterity task is strongly enough related to the
real MIS skills.
Maan et al., (2012) indicated thata simulator- based assessment includes the strongest
predictive value to determine if someone is suited for MIS surgery. Therefore, another aspect
that could be further studied is if the tasks are really related to the performance of MIS.
Therefore, laparoscopic simulators could be used that measure the performance. Then these
results could be compared to results of the performance of the dexterity tasks. If these results
correlate it can be assured that the dexterity tasks are valid and predict the correct skills. This
chance might be small because the tasks are not correlated with each other. So if the results
suggest that there is no relation between those tasks and the simulator, a simulator-based
assessment might be the only option to really assess someone’s skills for MIS. This would
speak for the possibility that these specific skills can only be predicted by testing the skills
There are also aspects that should be taken into account that may have jeopardized the
results of this study. The tasks and instructions were very specific. It might be possible that
the performance measurements are influenced by the instructions themselves. It might be
possible that the instructions were not clear enough or too difficult/easy/specific for the
participant. Furthermore, different types of persons have different preferences for the kind of
instructions. According to Jonassen & Grabowski, (2012) individuals are different in
processing new information and applying it. This leads to different kinds of preferences for
different kinds of instructions. This also means that the result and outcome of a task depends
on the kind of instructions (Jonassen & Grabowski, 2012). It might be that the kinds of
instructions used in the study were not best suited for the participants. Therefore, they
performed not as well as they could have and the results present a different aspect than the
skills themselves. For example, some participants might develop skills more quickly if they
can read the instructions rather than follow an instructional figure (Duncan Loop, Origami).
Moreover, it can be seen that the confidence intervals are relatively wide. This might
be because this study included a lot of noise because of little control over the experiment
itself. Some aspects could not be controlled during the task. Although an observational
scheme was used and an instructional handbook was established there was still variance
between the participants. Some participants needed extra help or were not motivated to fulfil
the tasks and therefore completed them superficially. All these aspects influenced the results
of the tasks and should be kept in mind for further analyses and usage of these results.
6
Conclusion
In conclusion it can be seen that it is only partly possible to predict the ability of a person to
learn complex motor procedures by letting them perform dexterity tasks. It can be seen that
the maximum performance of two tasks seemed to be associated. If a person has a talent in
Drawing the person will also score high on the Origami task. It should be worked on these
results in more detail to examine if there are other tasks connected, or any specific underlying
factors that might determine those tasks. Furthermore, it is important to have a general look at
the association with the real MIS skills with a simulator-based assessment. It should be
always kept in mind that a possible future assessment test is valid and reliable to pick only
those candidates that are suited for MIS. Otherwise the consequences might be fatal and
people might die because of surgeons not being able to perform MIS correctly. If it is not
possible to detect any relation, it could be possible that MIS skills are only predictable by MIS
7
References
Anastakis, D. J., Hamstra, S. J., & Matsumoto, E. D. (2000). Visual-spatial abilities in
surgical training. American Journal of Surgery, 179(6), 469–471.
http://doi.org/10.1016/S0002-9610(00)00397-4
Boakes, N. (2009). The Impact of Origami-Mathematics Lessons on Achievement and Spatial
Ability of Middle-School Students. Origami4: Fourth International Meeting of Origami.
Retrieved from
https://books.google.nl/books?hl=en&lr=&id=kOPqBgAAQBAJ&oi=fnd&pg=PA471&
dq=Origami+spatial+ability&ots=_Lg3WDL8zv&sig=_QuzhREkfJPawrRTKq5Pkcfbfk
0
Bolboaca, S., & Jäntschi, L. (2006). Pearson versus Spearman, Kendall’s tau correlation
analysis on structure-activity relationships of biologic active compounds. Leonardo
Journal of Sciences. Retrieved from http://ljs.academicdirect.org/A09/179_200.htm
Buckley, C., Kavanagh, D., Nugent, E., & Ryan, D. (2014). The impact of aptitude on the
learning curve for laparoscopic suturing. The American Journal of. Retrieved from
http://www.sciencedirect.com/science/article/pii/S000296101300682X
ÇAKMAK, S. (2009). AN INVESTIGATION OF THE EFFECT OF ORIGAMI-BASED
INSTRUCTION ON ELEMENTARY STUDENTS’SPATIAL ABILITY IN
MATHEMATICS. Retrieved from
http://etd.lib.metu.edu.tr/upload/3/12610864/index.pdf
Cao, C., MacKenzie, C., & Payandeh, S. (1996). Task and motion analyses in endoscopic
surgery. Proceedings ASME Dynamic. Retrieved from
http://citeseerx.ist.psu.edu/viewdoc/download?doi=10.1.1.48.2894&rep=rep1&type=pdf
Fried, M., Satava, R., & Weghorst, S. (2004). Identifying and reducing errors with surgical
simulation. Quality and Safety in. Retrieved from
http://qualitysafety.bmj.com/content/13/suppl_1/i19.short
Gallagher, A., & Smith, C. (2003). Human-factors lessons learned from the minimally
invasive surgery revolution. Surgical Innovation. Retrieved from
http://sri.sagepub.com/content/10/3/127.short
Groenier, M., & Schraagen, J. (2014). The role of cognitive abilities in laparoscopic simulator
http://link.springer.com/article/10.1007/s10459-013-9455-7
Heathcote, A., Brown, S., & Mewhort, D. J. K. (2000). The power law repealed: The case for
an exponential law of practice. Psychonomic Bulletin & Review, 7(2), 185–207.
Jonassen, D., & Grabowski, B. (2012). Handbook of individual differences, learning, and
instruction. Retrieved from
https://books.google.nl/books?hl=en&lr=&id=pJVa4v3Syb0C&oi=fnd&pg=PR1&dq=in
structions+types+affects+learning&ots=-oazMaevZs&sig=-upyuRv-PkUk7HLeptU1hipKHvg
Kaufman, H., Wiegand, R., & Tunick, R. (1987). Teaching surgeons to operate—principles of
psychomotor skills training. Acta Neurochirurgica. Retrieved from
http://link.springer.com/article/10.1007/BF02076007
Keehner, M., Lippa, Y., Montello, D., & Tendick, F. (2006). Learning a spatial skill for
surgery: How the contributions of abilities change with practice. Applied Cognitive.
Retrieved from http://www.opl.ucsb.edu/~montello/pubs/medical_skills.pdf
Kramp, K., Det, M., Hoff, C., & Veeger, N. (2016). The predictive value of aptitude
assessment in laparoscopic surgery: a meta‐analysis. Medical. Retrieved from
http://onlinelibrary.wiley.com/doi/10.1111/medu.12945/full
Langlois, J., Bellemare, C., & Toulouse, J. (2015). Spatial abilities and technical skills
performance in health care: a systematic review. Medical. Retrieved from
http://onlinelibrary.wiley.com/doi/10.1111/medu.12786/full
Luursema, J., Buzink, S., & Verwey, W. (2010). Visuo-spatial ability in colonoscopy
simulator training. Advances in Health. Retrieved from
http://link.springer.com/article/10.1007/s10459-010-9230-y
Maan, Z., Maan, I., & Darzi, A. (2012). Systematic review of predictors of surgical
performance. British Journal of. Retrieved from
http://onlinelibrary.wiley.com/doi/10.1002/bjs.8893/full
Matern, U., & Waller, P. (2014). Instruments for minimally invasive surgery. Surgical
Endoscopy, 13(2), 174–182. http://doi.org/10.1007/s004649900934
Palep, J. H. (2009). Robotic assisted minimally invasive surgery. Journal of Minimal Access
Ponsky, J. (1991). Complications of laparoscopic cholecystectomy. The American Journal of
Surgery. Retrieved from
http://www.sciencedirect.com/science/article/pii/000296109190605D
Wanzel, K., Hamstra, S., Anastakis, D., & Matsumoto, E. (2002). Effect of visual-spatial
ability on learning of spatially-complex surgical skills. The Lancet. Retrieved from
8
Appendix
8.1
Appendix A: Rulebook/ Instruction
GENERAL QUESTIONS:
General Question (at the begin of the study): Age:
Gender: Nationality: Study/Profession:
Ben je links- of rechtshandig of wisselt dit? (denk aan: schrijven, knippen, snijden, gooien) Are you left- or righthanded or does that change? (think about: writing, using sciccors, cutting, throwing)
Bist du Links- oder Rechtshänder oder wechselt? (denke an: schreiben, schneiden, werfen) Hoe vind jij het om met je handen te werken? (denk aan knutselen/ reperaties)
How do you feel about working with your hands? (think about crafts/repairs)
Wie findest du es mit den handwerklich zu arbeiten/ handarbeiten? (basteln/ etwas reparieren) Beleef je frustratie momenten als jij met je handen werk?
Do you get easily frustrated while working with your hands? Bist du schnell frustriert wenn du Handarbeiten machst?
Experience Question (directly after task):
Heb je ervaring met (afgelopen taak)? Geef eventueel voorbeelden
Do you have previous experience with (this task)? If needed, give examples
Hast du schon vorher Erfahrungen gesammelt die mit dieser Aufgabe zusammenhängen?
Questions at end of the test (pay attention to the order of the tasks the participant got during the study):
Welke taken vond je leuk? Welke taken vond je moeilijk? Which task did you like? Which tasks were hard?
Welche Aufgabe hast du als schwierigste empfunden?
Ask about the performance (this question should be answered after every task).
How would you estimate your performance at the beginning? (on a scale from 1-7, 7 is good performance, 1 is bad performance)