Original Article
Selection of key genes and regulators associated with
Treacher Collins syndrome based on expression
profiling analysis
Miao Xu1, Aiguo Xie2
1Department of Plastic and Reconstructive Surgery, Xinhua Hospital, School of Medicine, Shanghai Jiao Tong
Uni-versity, Shanghai, China; 2Department of Plastic and Reconstructive Surgery, Shanghai Ninth People’s Hospital,
School of Medicine, Shanghai Jiao Tong University, Shanghai, China
Received February 5, 2017; Accepted March 17, 2017; Epub May 15, 2017; Published May 30, 2017
Abstract: Objectives: Treacher Collins syndrome (TCS) is a rare congenital craniofacial defect characterized by facial dysplasia, cleft lip and cleft palate. This study aimed to explore the pathogenesis of TCS and select the key genes and regulators associated with TCS as specific molecular targets. Methods: In this study, a dataset GSE10167 was utilized containing 3 Tcof1+/- mutant and 3 wide-type. Following pretreatments, the differentially expressed genes (DEGs) between Tcof1+/- mutant and wide-type were screened using limma package. Then, these DEGs were en -riched in function and pathway clusters by DAVID online tool. The protein-protein interaction (PPI) network was con-structed using STRING database and miRNA-TF-target integrated network was visualized using the iRegulon plugin of Cytoscape software. Results: Totally, 353 DEGs between Tcof1+/- mutant and wide-type were obtained, including 142 up-regulated genes and 211 down-regulated genes. The DEGs were significantly correlated with p53 signaling pathway. In addition, by constructing PPI network of the DEGs, 4 hub nodes were selected in the network, including
CCNG1, TUBB3, HSPD1 and ACTG1. Moreover, in the integrated miRNA-TF-target network, 4 hub TFs were identified including E2f2, Onecut1, Wdr83 and Zbtb14. Conclusions: DEGs such as CCNG1, TUBB3, HSPD1, ACTG1 and TFs of E2f2, Onecut1, Wdr83and Zbtb14 might be used as specific therapeutic molecular targets for TCS diagnosis. However, further experiments are still needed to confirm our results.
Keywords: Treacher Collins syndrome, differentially expressed gene, protein-protein interaction network, miRNA-TF-target integrated network
Introduction
Treacher Collins syndrome (TCS, OMIM: 15- 4500) is a congenital craniofacial defect, which is an autosomal-dominant disease [1]. The inci-dence of TCS is estimated as 1/50,000, and it is characterized by facial dysplasia, cleft lip and cleft palate [2, 3]. TCS is associated with respi-ratory failure at birth [4]. Besides, most cranio-facial deformities in their childhood and adoles-cence require multiple rounds of surgery to repair [5].
The most common cause of TCS is the TCOF1 gene mutation (encoding the treacle protein)
[6]. TCOF1 is extensively expressed throughout
embryos at all stages of development and the levels in the neuroepithelium and neural crest
were elevated [7]. Studies have shown that inhi-bition of p53 (pharmacological or genetic) could partially rescue facial abnormalities. More recently, a potential new treatment, N-acety- lcysteine (NAC) has been administered by intra-peritoneal injection in a pregnant mother to inhibit DNA damage. The method could partially rescue the facial phenotype [8]. Recently, an
alternative target for the modification of ribo
-some biogenesis has been developed, such as targeting deubiquitinase (DUB), which could
serve as a potential treatment benefited to TCS
[9].
Although the craniofacial phenotype may be alleviated by p53 inhibition or anti-oxidative
therapy experiments, the definitive mechanism
8482 Int J Clin Exp Med 2017;10(5):8481-8491 had analyzed the possible pairwise
compari-sons between the three wild-type and three Tcof1+/- mutant embryos, but the relationship
of these differentially expressed genes (DEGs)
and the protein-protein interaction (PPI)
net-work were not studied [6]. Moreover, they did not mention miRNA data. In order to find more
effective targeted therapies associated with
TCS, DEGs between Tcof1+/- mutant and
wild-type embryos were determined in our study, which were mainly concentrated in the p53 sig-naling pathway. Besides, a PPI network was constructed to screen associated key proteins
based on the DEGs. Furthermore, a miRNA-the
transcription factor (TF)-target network was visualized by Cytoscape software to predicted hub TFs. Through these comprehensive bioin-formatics methods, the study aimed to explore the pathogenesis of TCS and select key genes
and regulators associated with TCS as specific
molecular targets.
Materials and methods
This article does not contain any studies with human participants or animals performed by any of the authors. The ethics approval is unnecessary for our study.
Affymetrix microarray data
The transcription profile of GSE10167 [6] and its annotation files were got from Gene Ex-pression Omnibus (GEO, http://www.ncbi.nlm.
nih.gov/geo/) database. In this dataset, a to-
tal of 6 samples were available, including 3
Tcof1+/- mutants and 3 wild-type embryos. The platform for gene expression detection was
GPL1261 [Mouse430_2] Affymetrix Mouse Genome 430 2.0 Array.
Data preprocessing
The raw data in the .CEL format were prepro
-cessed with background correction, normaliza-tion and expression calculanormaliza-tion by affy package in R [10] (Version 1.50.0, http://www.biocon-ductor.org/packages/release/bioc/html/affy. html), based on robust multi-array average
(RMA) algorithm [11, 12]. The annotation files
of this platform were used to obtain the probe value. The probes that did not match any gene symbol were removed and if one gene corre-sponded to several probes, the mean value of
all probes was calculated and served as the
final gene expression level.
Identification of DEGs between Tcof1+/- mu-tant and wild-type embryos
The t-test implemented in the Linear Models for
Microarray (limma) package (Version 3.10.3, http://www.bioconductor.org/packages/2.9/ bioc/html/limma.html) was used to identify the
DEGs between Tcof1+/- mutant and wild-type
embryos. The genes with adjusted P value less
than 0.01 were regarded as DEGs.
Functional enrichment analysis of DEGs
The Gene Ontology (GO) database [13] stores
broader information of gene sets, and the Kyoto
Encyclopedia of Genes and Genomes (KEGG)
[14] database provides informative pathways for substantial genes. Depended on these two databases, functional enrichment analysis of
DEGs was performed using the online software
DAVID [15]. The adjusted P value <0.05 were
chosen as cut-off for significant function or
pathway category selection.
To directly visualize the function of the DEGs, the ClueGO [16] plugin (Version 2.2.6, http:// apps.cytoscape.org/apps/ClueGO) of
Cytosca-pe software [17] (Version 3.4.0) was used to
draw the cross-talk of enrichment results of GO
biological processes (BP) and the pathway of
KEGG for up-regulated and down-regulated
DEGs, respectively, with the threshold of adjust
-ed P<0.05. The CyKEGGParser plugin [18]
(Ve-rsion 1.2.7, http://apps.cytoscape.org/apps/
CyKEGGParser) was used to draw significantly
enriched pathways. PPI network construction
PPI analysis was performed for DEGs depend
-ed on protein information in the search tool for the retrieval of interacting genes/proteins
(STRING) database [19] (Version: 10.0, http:// www.string-db.org/), with required confidence
level (combined score) more than 0.4 as the threshold.
The network was constructed using Cytoscape
software after obtaining the PPIs of DEGs. A
node in the network represents a protein
encoded by a DEG. The topological properties
of the nodes in the network were analyzed by
apps.cytoscape.org/apps/cy- tonca), and the parameter was set as “without weight”. Then the Degree Centrality (DC), Betweenness centrality (BC) and Closeness centrality (CC) of the nodes were ob- tained. The important nodes
were identified based on their
ranking scores in the above
three items, and were defined
as hub nodes in the PPI net-work [21].
Prediction of TCS-associated miRNAs
The validated miRNA-target interactions in the miRWalk 2.0 (http://zmf.umm.uni-hei-delberg.de/apps/zmf/mirwa- lk2/) database were down-loaded [22, 23], and the com-mon genes between the kn-
own targets and the DEGs
were overlapped, to predict potential miRNA-target inter-actions related to TCS path- ogenesis.
Transcription factor predic-tion and the construcpredic-tion of integrated miRNA-TF-target network
The TFs of the regulatory gene set can be predicted using the iRegulon [24] plugin (Version 1.3, http://apps.cy- toscape.org/apps/iRegulon) of Cytoscape software which predicts the regulatory net-work by calculating the motif enrichment analysis. Based on genes in the PPI network and miRNA-target gene
net-work, TFs of the DEGs were
[image:3.612.94.373.68.681.2]predicted, and the three net-works were integrated to dr- aw a miRNA-TF-target net-work. The topological proper-ties of nodes in the integrat-ed network were analyzintegrat-ed using the CytoNCA, with the same parameters in the PPI network analysis.
8484 Int J Clin Exp Med 2017;10(5):8481-8491
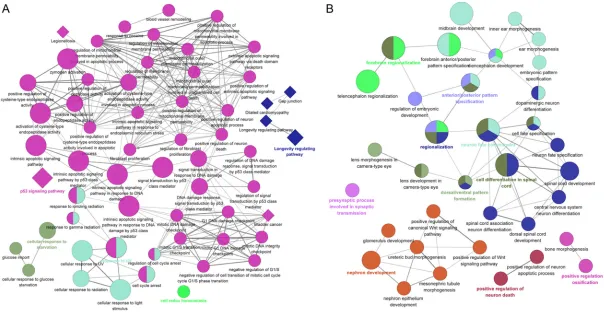
Figure 2. Cross-talk of GO functional and KEGG pathway enrichment results for up- and down-regulated DEGs. Round nodes represent GO BP categories, the
8485 Int J Clin Exp Med 2017;10(5):8481-8491
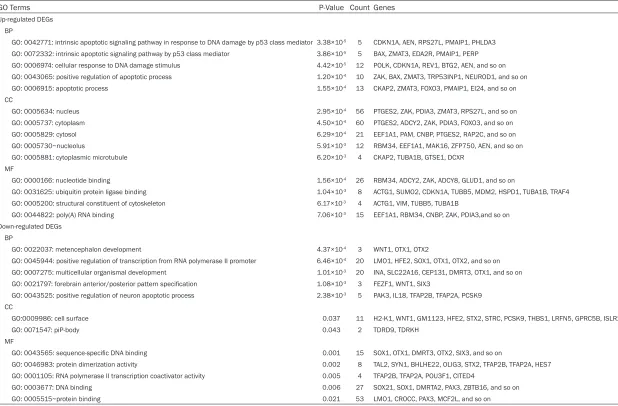
Table 1. Top 5 significantly enriched function of up- and down-regulated DEGs
GO Terms P-Value Count Genes
Up-regulated DEGs BP
GO: 0042771: intrinsic apoptotic signaling pathway in response to DNA damage by p53 class mediator 3.38×10⁻⁵ 5 CDKN1A, AEN, RPS27L, PMAIP1, PHLDA3
GO: 0072332: intrinsic apoptotic signaling pathway by p53 class mediator 3.86×10⁻⁵ 5 BAX, ZMAT3, EDA2R, PMAIP1, PERP
GO: 0006974: cellular response to DNA damage stimulus 4.42×10⁻⁵ 12 POLK, CDKN1A, REV1, BTG2, AEN, and so on
GO: 0043065: positive regulation of apoptotic process 1.20×10⁻⁴ 10 ZAK, BAX, ZMAT3, TRP53INP1, NEUROD1, and so on
GO: 0006915: apoptotic process 1.55×10⁻⁴ 13 CKAP2, ZMAT3, FOXO3, PMAIP1, EI24, and so on
CC
GO: 0005634: nucleus 2.95×10⁻⁴ 56 PTGES2, ZAK, PDIA3, ZMAT3, RPS27L, and so on
GO: 0005737: cytoplasm 4.50×10⁻⁴ 60 PTGES2, ADCY2, ZAK, PDIA3, FOXO3, and so on
GO: 0005829: cytosol 6.29×10⁻⁴ 21 EEF1A1, PAM, CNBP, PTGES2, RAP2C, and so on
GO: 0005730~nucleolus 5.91×10⁻³ 12 RBM34, EEF1A1, MAK16, ZFP750, AEN, and so on
GO: 0005881: cytoplasmic microtubule 6.20×10⁻³ 4 CKAP2, TUBA1B, GTSE1, DCXR
MF
GO: 0000166: nucleotide binding 1.56×10⁻⁴ 26 RBM34, ADCY2, ZAK, ADCY8, GLUD1, and so on
GO: 0031625: ubiquitin protein ligase binding 1.04×10⁻³ 8 ACTG1, SUMO2, CDKN1A, TUBB5, MDM2, HSPD1, TUBA1B, TRAF4
GO: 0005200: structural constituent of cytoskeleton 6.17×10⁻³ 4 ACTG1, VIM, TUBB5, TUBA1B
GO: 0044822: poly(A) RNA binding 7.06×10⁻³ 15 EEF1A1, RBM34, CNBP, ZAK, PDIA3,and so on
Down-regulated DEGs BP
GO: 0022037: metencephalon development 4.37×10⁻⁴ 3 WNT1, OTX1, OTX2
GO: 0045944: positive regulation of transcription from RNA polymerase II promoter 6.46×10⁻⁴ 20 LMO1, HFE2, SOX1, OTX1, OTX2, and so on
GO: 0007275: multicellular organismal development 1.01×10⁻³ 20 INA, SLC22A16, CEP131, DMRT3, OTX1, and so on
GO: 0021797: forebrain anterior/posterior pattern specification 1.08×10⁻³ 3 FEZF1, WNT1, SIX3
GO: 0043525: positive regulation of neuron apoptotic process 2.38×10⁻³ 5 PAK3, IL18, TFAP2B, TFAP2A, PCSK9
CC
GO:0009986: cell surface 0.037 11 H2-K1, WNT1, GM1123, HFE2, STX2, STRC, PCSK9, THBS1, LRFN5, GPRC5B, ISLR2 GO: 0071547: piP-body 0.043 2 TDRD9, TDRKH
MF
GO: 0043565: sequence-specific DNA binding 0.001 15 SOX1, OTX1, DMRT3, OTX2, SIX3, and so on
GO: 0046983: protein dimerization activity 0.002 8 TAL2, SYN1, BHLHE22, OLIG3, STX2, TFAP2B, TFAP2A, HES7 GO: 0001105: RNA polymerase II transcription coactivator activity 0.005 4 TFAP2B, TFAP2A, POU3F1, CITED4
GO: 0003677: DNA binding 0.006 27 SOX21, SOX1, DMRTA2, PAX3, ZBTB16, and so on GO: 0005515~protein binding 0.021 53 LMO1, CROCC, PAX3, MCF2L, and so on
8486 Int J Clin Exp Med 2017;10(5):8481-8491
Results
DEGs screening
The dataset contained 45,101 probes, which
were finally mapped to 20,708 genes after pre
-treatments. Based on aforementioned criteria,
a total 353 DEGs were screened out, 142 of
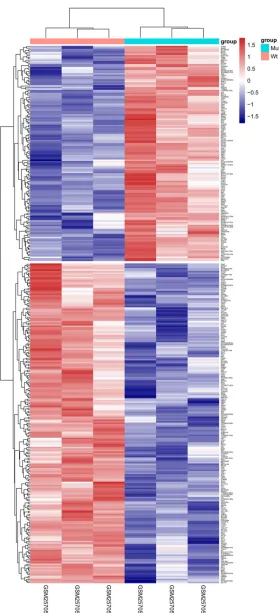
which were up-regulated and 211 were down-regulated. Two-way hierarchical clustering heat
map of DEGs were shown in Figure 1, and these
DEGs could well distinguish the two kinds of
samples.
GO function and KEGG pathway enrichment analysis of DEGs
To explore potential function and pathways
for these DEGs, GO function and KEGG pathway
enrichment from both up- and down-regulated
DEGs were analyzed. As shown in Figure 2,
up-regulated DEGs were mainly enriched in func
-Table 2. KEGG pathway enrichment analysis of DEGs
Terms P-Value Count Genes
Up-regulated DEGs
mmu04115: p53 signaling pathway 5.71×10⁻¹¹ 11 CDKN1A, EI24, BAX, ZMAT3, MDM2, PMAIP1, APAF1, CCNG1, SESN2, PERP, GTSE1
mmu05414: Dilated cardiomyopathy 0.028 4 ACTG1, ADCY2, ADCY8, ITGA8 mmu04540: Gap junction 0.030 4 ADCY2, ADCY8, TUBB5, TUBA1B mmu04921: Oxytocin signaling pathway 0.036 5 ACTG1, CDKN1A, ADCY2, ADCY8, PRKAA1 Down-regulated DEGs
mmu05166: HTLV-I infection 0.033 6 H2-K1, MSX3, WNT1, ADCY7, RRAS, WNT2B mmu05205: Proteoglycans in cancer 0.041 5 WNT1, PLCE1, RRAS, THBS1, WNT2B
[image:6.612.87.528.87.189.2]KEGG: Kyoto Encyclopedia of Genes and Genomes; DEGs: differentially expressed genes.
[image:6.612.90.517.220.521.2]tional or pathway categories such as “regula-tion of cell cycle”, “p53 signaling pathway (e.g. CCNG1)”, “positive regulation of apoptotic pro-cess (e.g. HSPD1)”, “ATP binding”, “dilated car-diomyopathy and oxytocin signaling pathway (e.g. ACTG1)”; while down-regulated DEGs were
significantly related to categories such as “pro
-tein binding”, “neuron differentiation (e.g. TUBB3)”. Top 5 (ranked by P-value) of these functional categories were shown in Table 1,
and KEGG pathway categories were shown in
Table 2.
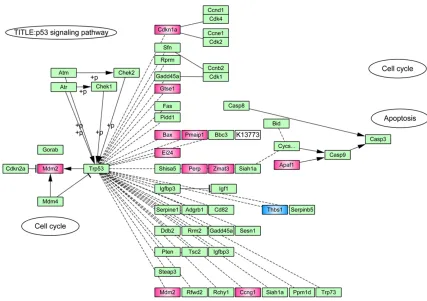
Cross-talk of function and pathway enrichment
results showed these DEGs were significantly
associated with p53 signaling pathway. The
DEGs enriched in the pathway were 11 up-reg
-ulated genes and 1 down-reg-ulated gene (Figure 3).
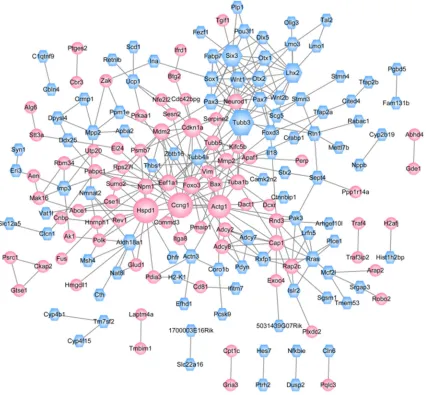
PPI network
According to predefined criterion, a PPI network was established, containing a total of 176
nodes (including 79 up-regulated and 97
down-regulated DEGs) and 307 interactions (Figure
4). As shown in the PPI network, the proteins of
CCNG1, TUBB3, HSPD1 and ACTG1 had high
degrees (15, 15, 15, 14, respectively). miRNA-TF-target integrated network analysis
Totally, 103 miRNA-DEG interactions were
obtained based on the validated miRNA infor-mation in mice in miRWalk2.0 database,
[image:7.612.95.521.74.469.2]8488 Int J Clin Exp Med 2017;10(5):8481-8491
ing 36 miRNA and 103 target genes. Four TFs,
such as E2f2, Onecut1, Wdr83 and Zbtb14, and their 154 target genes were predicted based on miRNA-target genes and PPI net- work.
By integrating the TF, DEG, miRNA information,
a miRNA-TF-target network was constructed,
consisted of 248 nodes (including 96 up-regu
-lated DGEs, 112 down-regu-lated DEGs, 36
miRNAs and 4 TFs), 723 relationship pairs (307 PPI interactions, 103 miRNA-target interac-tions and 313 TF-target interacinterac-tions) (Figure 5). And the TFs including Onecut1, Zbtb14, E2f2,
and Wdr83 had high degrees (122, 114, 40, 37, respectively).
Discussion
Craniofacial malformations account for about one-third of all congenital birth defects, and TCS is a serious congenital craniofacial disease
[1]. In this study, a total of 353 DEGs were
obtained, including 142 up-regulated genes
and 211 down-regulated genes. These DEGs were significantly correlated with p53 signaling
[image:8.612.95.516.77.489.2]pathway, which indicated that this pathway might play a key role in the pathogenesis of
TCS. In agreement with the previous statement, inhibition of p53 could partially rescue facial
abnormities [6]. In addition, by constructing PPI
network of the DEGs, 4 hub nodes were select
-ed in the network, including CCNG1, TUBB3, HSPD1 and ACTG1. Moreover, by integrating
miRNA-TF-DEGs network, 4 hub TFs were iden
-tified including E2f2, Onecut1, Wdr83 and
Zbtb14.
CCNG1 (CyclinG1) which has high expression level in embryonic germ (EG) and embryonic
stem (ES) cells is a member of the cyclin family [25]. Transcriptional activation of CCNG1 can be induced by tumor protein p53, and it is the only cyclin that has positive or negative effects
on cell growth [26]. Previous studies have
shown that CCNG1 frequently appears in malig-nant tumors [25]. TCOF1 encodes a treacle protein, which localizes to the nucleus during interphase, but disperses into the cytoplasm [27] and re-localizes at the centrosomes and kinetochores during mitosis [28]. Thus, TCOF1 plays an important role in the process of mito-sis. Besides, knockdown of TCOF1 affects the process of mitosis, thereby interferes with the balance between expansion and differentiation of neural progenitor cells [8]. Both of TCOF1 and CCNG1 can affect the cell cycle. Our find -ings suggest that CCNG1 is differentially expressed between Tcof1+/- mutant and wide-type. Thus, CCNG1 may cause TCS by blocking
the cell cycle of EG and ES.
TUBB3 encodes the beta tubulin family, which is mainly expressed in neurons, and can partici-pate in neurogenesis, axon guidance and maintenance [29]. Treacleis typically associat-ed with microtubule binding and it has shown that the loss of TCOF1 will delay cell mitosis [8], and microtubules is very important in the for-mation of the central granule during mitosis. In our study, TUBB3 was differentially expressed between Tcof1+/- mutant and wide-type, sug-gesting that this gene is essential for the occur-rence of TCS. Precise regulation of nerve cells
at specific times can prevent facial deformities.
This gene may inhibit the cell cycle by altering the microtubule structure of nerve cells. HSPD1, also known as HSP60, encodes a mito-chondrial chaperone protein, which is a signal molecule in the innate immune system [30]. In addition to energizing cells, mitochondria are involved in processes such as cell
differentia-tion, cell signaling, and apoptosis, as well as the ability to regulate cell growth and cell cycle progression. TCOF1 plays an important role in the inhibition of oxidative stress-induced apop-tosis, and loss of TCOF1 results in a higher level of ROS in the body. The high level of ROS in neu-roepithelium is the root cause of TCS [8]. In our study, HSPD1 was differentially expressed between Tcof1 mutant and wide-type, indicat-ing that HSPD1 plays a key role in TCS. ACTG1 encodes γ-actin, which is one of six high -ly conserved actin proteins in human. It is a cytosolic actin found in the non-muscle cells, acting as a component of the cytoskeleton and a mediator of internal cellular motility [31]. This gene mutation may cause a non-syndromic hearing loss phenotype [31]. Neural crest cell formation, migration defects are considered as the basis of many craniofacial deformities. TCS is an autosomal dominant birth defect and its clinical features include damage to the middle ear and the outer ear. In our study, the differen-tial expression of ACTG1 which is an oxytocin signaling pathway gene was shown to play a key role in TCS.
E2f2 encodes one of the E2F family of TFs which is an important factor in controlling the cell cycle and the role of tumor suppressor teins and is also a target for transforming pro-teins of small DNA tumor viruses [32]. E2f2 regulates a wide range of BPs, including cell cycle, apoptosis and DNA damage [32], which are associated with the occurrence of TCS. Consistent with it, our study also found E2f2
closely related to the DEGs between Tcof1
mutant and wide-type. Onecut1 is responsible
for the maintenance of specific cell fate and
8490 Int J Clin Exp Med 2017;10(5):8481-8491
interacts with a GC-rich nucleotide sequences
in the 5’-regulatory region of many mammalian genes [35]. ZF5 is necessary for Zn-reactive
transcription [36]. This study predicted that
Zbtb14 may serve as a TCS-associated TF, sug-gesting that Zbtb14 may relate to TCS by
regu-lated these DGEs’ expression.
In conclusion, we found that CCNG1, TUBB3, HSPD1 and ACTG1 may have a great influence
on the progression of TCS. Besides, we also found thatE2f2, Onecut1, Wdr83 and Zbtb14 may be the important TFs in the process of
TCS. Thus, they may be used as specific thera
-peutic molecular targets for TCS prognosis. However, further experiments are still needed
to confirm our results.
Disclosure of conflict of interest
None.
Address correspondence to: Aiguo Xie, Department of Plastic and Reconstructive Surgery, Shanghai Ninth People’s Hospital, School of Medicine, Sh- anghai Jiao Tong University, 639 Zhizaoju Road, Shanghai 200011, China. Tel: +86-21-23271699-5122; E-mail: [email protected]
References
[1] Sequence AA. Positional cloning of a gene in-volved in the pathogenesis of Treacher Collins syndrome. The Treacher Collins syndrome col-laborative group. Nat Genet 1996; 12: 130-136.
[2] Rovin S, Dachi SF, Borenstein DB and Cotter WB. Mandibulofacial dysostosis: a familial study of five generations. J Pediatr 1964; 65: 215-221.
[3] Fazen LE, Elmore J and Nadler HL. Mandibulo-facial dysostosis. (Treacher-Collins syndrome). Am J Dis Child 1967; 113: 405-410.
[4] Schlump JU, Stein A, Hehr U, Karen T, Moller-Hartmann C, Elcioglu NH, Bogdanova N, Woike HF, Lohmann DR, Felderhoff-Mueser U, Linz A and Wieczorek D. Treacher Collins syndrome: clinical implications for the paediatrician-a new mutation in a severely affected newborn and comparison with three further patients with the same mutation, and review of the lit-erature. Eur J Pediatr 2012; 171: 1611-1618. [5] Lau MC, Kwong EM, Lai KP, Li JW, Ho JC, Chan
TF, Wong CK, Jiang YJ and Tse WK. Pathogen -esis of POLR1C-dependent Type 3 Treacher Collins Syndrome revealed by a zebrafish mod -el. Biochim Biophys Acta 2016; 1862: 1147-1158.
[6] Jones NC, Lynn ML, Gaudenz K, Sakai D, Aoto K, Rey JP, Glynn EF, Ellington L, Du C, Dixon J, Dixon MJ and Trainor PA. Prevention of the neurocristopathy Treacher Collins syndrome through inhibition of p53 function. Nat Med 2008; 14: 125-133.
[7] Dixon J, Hovanes K, Shiang R and Dixon MJ. Sequence analysis, identification of evolution -ary conserved motifs and expression analysis of murine tcof1 provide further evidence for a potential function for the gene and its human homologue, TCOF1. Hum Mol Genet 1997; 6: 727-737.
[8] Sakai D and Trainor PA. Face off against ROS: Tcof1/Treacle safeguards neuroepithelial cells and progenitor neural crest cells from oxida-tive stress during craniofacial development. Dev Growth Differ 2016; 58: 577-585.
[9] Werner A, Iwasaki S, McGourty CA, Medina-Ruiz S, Teerikorpi N, Fedrigo I, Ingolia NT and Rape M. Cell-fate determination by ubiquitin-dependent regulation of translation. Nature 2015; 525: 523-527.
[10] Gautier L, Cope L, Bolstad BM and Irizarry RA. Affy-analysis of Affymetrix GeneChip data at the probe level. Bioinformatics 2004; 20: 307-315.
[11] Bolstad BM, Irizarry RA, Astrand M and Speed TP. A comparison of normalization methods for high density oligonucleotide array data based on variance and bias. Bioinformatics 2003; 19: 185-193.
[12] Irizarry RA, Hobbs B, Collin F, Beazer-Barclay YD, Antonellis KJ, Scherf U and Speed TP. Ex -ploration, normalization, and summaries of high density oligonucleotide array probe level data. Biostatistics 2003; 4: 249-264.
[13] Ashburner M, Ball CA, Blake JA, Botstein D, Butler H, Cherry JM, Davis AP, Dolinski K, Dwight SS, Eppig JT, Harris MA, Hill DP, Issel-Tarver L, Kasarskis A, Lewis S, Matese JC, Richardson JE, Ringwald M, Rubin GM and Sherlock G. Gene ontology: tool for the unifica -tion of biology. The Gene Ontology Consortium. Nat Genet 2000; 25: 25-29.
[14] Kanehisa M and Goto S. KEGG: kyoto encyclo -pedia of genes and genomes. Nucleic Acids Res 2000; 28: 27-30.
[15] Huang DW, Sherman BT, Tan Q, Collins JR, Al-vord WG, Roayaei J, Stephens R, Baseler MW, Lane HC and Lempicki RA. The DAVID gene functional classification tool: a novel biological module-centric algorithm to functionally ana-lyze large gene lists. Genome Biol 2007; 8: R183.
[17] Shannon P, Markiel A, Ozier O, Baliga NS, Wang JT, Ramage D, Amin N, Schwikowski B and Ideker T. Cytoscape: a software environ-ment for integrated models of biomolecular interaction networks. Genome Res 2003; 13: 2498-2504.
[18] Nersisyan L, Samsonyan R and Arakelyan A. CyKEGGParser: tailoring KEGG pathways to fit into systems biology analysis workflows. F1000Res 2014; 3: 145.
[19] von Mering C, Huynen M, Jaeggi D, Schmidt S, Bork P and Snel B. STRING: a database of pre -dicted functional associations between pro-teins. Nucleic Acids Res 2003; 31: 258-261. [20] Tang Y, Li M, Wang J, Pan Y and Wu FX. CytoN
-CA: a cytoscape plugin for centrality analysis and evaluation of protein interaction networks. Biosystems 2015; 127: 67-72.
[21] He X and Zhang J. Why do hubs tend to be es-sential in protein networks? PLoS Genet 2006; 2: e88.
[22] Dweep H, Sticht C, Pandey P and Gretz N. miR -Walk-database: prediction of possible miRNA binding sites by “walking” the genes of three genomes. J Biomed Inform 2011; 44: 839-847.
[23] Dweep H and Gretz N. miRWalk2.0: a compre -hensive atlas of microRNA-target interactions. Nat Methods 2015; 12: 697.
[24] Janky R, Verfaillie A, Imrichova H, Van de Sande B, Standaert L, Christiaens V, Hulsel -mans G, Herten K, Naval Sanchez M, Potier D, Svetlichnyy D, Kalender Atak Z, Fiers M, Ma-rine JC and Aerts S. iRegulon: from a gene list to a gene regulatory network using large motif and track collections. PLoS Comput Biol 2014; 10: e1003731.
[25] Sorrentino E, Nazzicone V, Farini D, Campag-nolo L and De Felici M. Comparative transcript profiles of cell cycle-related genes in mouse primordial germ cells, embryonic stem cells and embryonic germ cells. Gene Expr Patterns 2007; 7: 714-721.
[26] Liu F, Gao X, Yu H, Yuan D, Zhang J, He Y and Yue L. Effects of expression of exogenous cy -clin G1 on proliferation of human endometrial carcinoma cells. Chin J Physiol 2013; 56: 83-89.
[27] Marsh KL, Dixon J and Dixon MJ. Mutations in the Treacher Collins syndrome gene lead to mislocalization of the nucleolar protein trea-cle. Hum Mol Genet 1998; 7: 1795-1800.
[28] Sakai D, Dixon J, Dixon MJ and Trainor PA. Mammalian neurogenesis requires Treacle-Plk1 for precise control of spindle orientation, mitotic progression, and maintenance of neu-ral progenitor cells. PLoS Genet 2012; 8: e1002566.
[29] Whitman MC, Andrews C, Chan WM, Tischfield MA, Stasheff SF, Brancati F, Ortiz-Gonzalez X, Nuovo S, Garaci F, MacKinnon SE, Hunter DG, Grant PE and Engle EC. Two unique TUBB3 mu -tations cause both CFEOM3 and malforma-tions of cortical development. Am J Med Genet A 2016; 170A: 297-305.
[30] Landstein D, Ulmansky R and Naparstek Y. HSP60: a double edge sword in autoimmunity. Oncotarget 2015; 6: 32299-32300.
[31] Miyagawa M, Nishio SY, Ichinose A, Iwasaki S, Murata T, Kitajiri S and Usami S. Mutational spectrum and clinical features of patients with ACTG1 mutations identified by massively paral -lel DNA sequencing. Ann Otol Rhinol Laryngol 2015; 124 Suppl 1: 84S-93S.
[32] Chen L, Yu JH, Lu ZH and Zhang W. E2F2 induc -tion in related to cell prolifera-tion and poor prognosis in non-small cell lung carcinoma. Int J Clin Exp Pathol 2015; 8: 10545-10554. [33] Espana A and Clotman F. Onecut factors
con-trol development of the Locus Coeruleus and of the mesencephalic trigeminal nucleus. Mol Cell Neurosci 2012; 50: 93-102.
[34] Lee SH, Hu LL, Gonzalez-Navajas J, Seo GS, Shen C, Brick J, Herdman S, Varki N, Corr M, Lee J and Raz E. ERK activation drives intesti -nal tumorigenesis in Apc(min/+) mice. Nat Med 2010; 16: 665-670.
[35] Obata T, Yanagidani A, Yokoro K, Numoto M and Yamamoto S. Analysis of the consensus binding sequence and the DNA-binding do-main of ZF5. Biochem Biophys Res Commun 1999; 255: 528-534.