University of Warwick institutional repository: http://go.warwick.ac.uk/wrap
A Thesis Submitted for the Degree of PhD at the University of Warwick
http://go.warwick.ac.uk/wrap/67166
This thesis is made available online and is protected by original copyright.
Please scroll down to view the document itself.
M A
E
G
NS I
T A T MOLEM
U N
IV
ER
SITAS WARWICEN
SIS
Pattern Formation and Persistence in Spatial Plant
Ecology
by
Michael Alastair Irvine
Thesis
Submitted to the University of Warwick
for the degree of Mathematical Ecology and Complexity
Science
Doctor of Philosophy
Complexity Science
Contents
List of Tables vi
List of Figures vii
Acknowledgments x
Declarations xii
Abstract xiii
Chapter 1 Introduction 1
1.1 Motivation . . . 2
1.2 Related efforts . . . 3
1.3 Summary of main development of thesis . . . 6
1.4 Outline of remainder of thesis . . . 7
Chapter 2 Background 15 2.1 Introduction . . . 16
2.2 Pattern formation . . . 17
2.2.1 Semi-arid ecosystems . . . 20
2.3 Critical phenomena . . . 22
2.4 Scaling . . . 24
2.5 Conclusion . . . 30
Chapter 3 Seagrass 38 3.1 Introduction . . . 39
3.2 Biology & ecology . . . 39
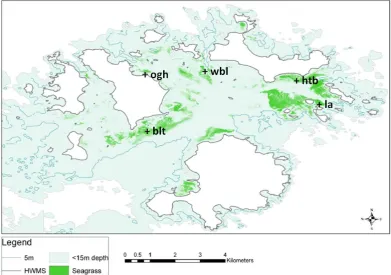
3.3 Isles of Scilly . . . 42
3.4 Mapping . . . 43
3.5.1 Banding survey . . . 47
3.6 Modelling . . . 49
3.7 Conclusion . . . 50
Chapter 4 Spatial analysis 57 4.1 Introduction . . . 58
4.2 Monofractal . . . 58
4.2.1 Measuring monofractality from data . . . 61
4.3 Fractional Brownian motion . . . 62
4.4 Lacunarity . . . 65
4.5 Multifractality . . . 65
4.5.1 The multifractal spectrum: density against occupancy data . 69 4.5.2 Pattern anisotropy . . . 70
4.6 Results . . . 73
4.6.1 Box-counting dimension . . . 73
4.6.2 Lacunarity . . . 74
4.6.3 Anisotropy . . . 75
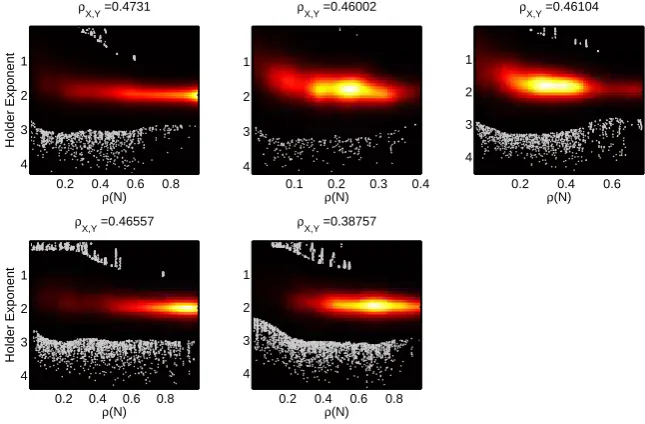
4.6.4 H¨older exponent . . . 77
4.7 Discussion . . . 78
Chapter 5 Modelling 86 5.1 Introduction . . . 87
5.2 Reaction-diffusion equations . . . 88
5.2.1 A Short deviation into the literature . . . 95
5.2.2 Conclusion . . . 96
5.3 Integro-differential equations . . . 97
5.3.1 Derivation . . . 98
5.3.2 Kernels . . . 100
5.3.3 Anisotropy . . . 101
5.4 Probabilistic cellular automata . . . 101
5.5 Simulation . . . 103
5.6 Results . . . 103
5.6.1 Geometry . . . 106
5.7 Conclusion . . . 106
Chapter 6 Fractal heuristics of return rate 110 6.1 Introduction . . . 111
6.2.1 Fractal growth and boundaries . . . 114
6.2.2 Relative patchiness . . . 120
6.3 Models . . . 121
6.3.1 Introduction . . . 121
6.3.2 Two-state model . . . 121
6.3.3 Three-state model . . . 122
6.4 Method . . . 125
6.4.1 Calculation of fractal dimensions . . . 125
6.4.2 Calculation of the return rate . . . 127
6.4.3 Comparison to data . . . 133
6.4.4 Simulations . . . 134
6.5 Results . . . 135
6.5.1 Disturbance & recovery in a homogeneous environment . . . 135
6.5.2 Invading cluster with environmental noise . . . 137
6.5.3 Properties of a vegetation boundary along an environmental gradient . . . 138
6.6 Conclusion . . . 140
Chapter 7 Parameter estimation from a snapshot of regular vegeta-tion spatial patterns 154 7.1 Introduction . . . 155
7.2 Density as an observable . . . 156
7.2.1 Method . . . 156
7.2.2 Minimising for one parameter . . . 157
7.2.3 Minimising for two parameters . . . 158
7.2.4 Searching over parameter space . . . 159
7.3 Spatial correlations as an observable . . . 160
7.3.1 Derivation of the variational correlation for spatial pattern inference . . . 161
7.3.2 Non-spatial birth death process . . . 166
7.4 Inference . . . 169
7.4.1 Simulated annealing . . . 169
7.4.2 Approximate Bayesian computation . . . 173
7.4.3 Synthetic likelihood . . . 174
7.4.4 Derivation of the likelihood . . . 175
7.4.5 Priors . . . 178
7.5 Results . . . 182
7.5.1 Simulated data . . . 182
7.5.2 Real data . . . 185
7.6 Conclusion . . . 185
Chapter 8 Aggregation 195 8.1 Introduction . . . 196
8.2 Introduction to equations . . . 197
8.3 An ecological interpretation of the aggregation kernel . . . 199
8.4 An analogue for the return rate . . . 200
8.5 Constant aggregation with linear death . . . 202
8.6 Comparison to explicit spatial modelling of vegetation growth . . . . 204
8.7 Empirical analysis of patch-size distribution using the aggregation-fragmentation equation . . . 206
8.7.1 Developing the likelihood . . . 207
8.7.2 Results . . . 207
8.8 Conclusion . . . 208
Chapter 9 Vegetation disease on spatial pattern formation 214 9.1 Introduction . . . 215
9.1.1 Modelling the spread of a species in a disordered environment 216 9.1.2 The Multiplicative cascade model . . . 217
9.1.3 Methods . . . 221
9.1.4 Observables . . . 221
9.1.5 Results . . . 222
9.1.6 Discussion . . . 225
9.2 Disease diffusion in a changing environment . . . 225
9.2.1 Disease model . . . 226
9.2.2 Competition in regulating disease spread . . . 227
9.3 Evolutionary model for pattern formation in reaction to disease . . . 230
9.3.1 Evolutionary model for competition that is transmitted . . . 232
9.4 Results . . . 236
9.4.1 Altruistic competition . . . 236
9.4.2 Selfish competition . . . 239
Chapter 10 Conclusion 245
List of Tables
4.1 Density, box-counting dimension and range for surveyed sites. . . 73
7.1 Measurement of correlation distributions for various system sizes. . . 178
8.1 Bayes factor comparison for all three models over the five sites. . . . 208 8.2 Inferred parameters and 95% confidence intervals for all three models
List of Figures
2.1 Reaction-Diffusion mechanism . . . 16
2.2 Examples of regular pattern formation . . . 17
2.3 Semi-arid patch-size distribution . . . 26
3.1 Global seagrass distribution . . . 40
3.2 Old Grimsby Harbour (2013) . . . 42
3.3 Isles of Scilly survey sites . . . 44
3.4 Seagrass surveying methods . . . 46
3.5 Time-series of quadrat-based survey . . . 47
3.6 Seagrass banding sites . . . 48
3.7 grey seal . . . 51
4.1 Simulating fractional Brownian motion . . . 62
4.2 Clipping in box-counting . . . 66
4.3 Lacunarity of survey sites . . . 74
4.4 Comparison of lacunarity to null model . . . 76
4.5 Anisotropy analysis . . . 77
4.6 Anisotropy analysis . . . 80
4.7 Boundary dimension of survey sites . . . 81
4.8 local scaling of survey sites . . . 82
4.9 correlations between density and local scaling . . . 83
5.1 Hydrological scouring . . . 87
5.2 spectral analysis of offset parameter . . . 104
5.3 spectral analysis of ambient birth parameter . . . 105
5.4 impact of geometry on banding . . . 106
6.1 Eden model . . . 115
6.3 Calculation of return rate for the birth-death process . . . 131
6.5 Growth rate and Hurst exponent in three-state model. . . 137
6.9 Korcak - return rate relationship for surveyed and simulated data. . 140
6.4 Comparison between dynamic heuristics and average time to equilib-rium in two-state model. . . 143
6.6 Comparison of boundary dimension and return rate for three-state model. . . 144
6.7 Comparison of boundary and Korcak dimension for three-state model. 145 6.8 Comparison of Korcak dimension and return rate for three-state model.146 6.10 Varying environmental parameters in two-state model. . . 147
6.11 Varying dynamic parameters in two-state model. . . 148
7.1 Expected change in density varying offset. . . 157
7.2 Expected change in density varying two parameters. . . 158
7.3 Expected change in density varying three parameters. . . 159
7.4 Change in expected correlation for birth-death process. . . 168
7.5 Change in correlation for simulated data. . . 170
7.6 Calculatingζ2 over a two parameter subset of parameter space. . . . 171
7.7 Simulated annealing for four parameters . . . 172
7.8 Scaling of expected number ofXY pairs. . . 177
7.9 Distribution of errors for increasing system size. . . 179
7.10 Example posterior for simulated data. . . 186
7.11 Marginals of posterior for simulated data . . . 187
7.12 Change in correlation structure for changing competitionk. . . 188
7.13 Posterior for seagrass data. . . 191
7.14 Posterior for tiger bush data. . . 192
8.1 Plausible Korcak-return rate relationship. . . 201
8.2 Exponents of patch-size distribution compared to simulations. . . 206
9.1 Equilibrium distribution for Poisson point process. . . 217
9.2 Summary of diffusion for Poisson point process. . . 222
9.3 Summary of growth rate for multiplicative cascade model. . . 224
9.4 Schematic diagram for disease model. . . 226
9.5 Mean and variance for population in disease model. . . 227
9.6 Example of dynamics of disease model with no banding. . . 229
Acknowledgments
I am firstly grateful to my two supervisors Matt Keeling and Jim Bull for their
constant support throughout the whole process, keeping me pointing in the right direction and for interesting discussions throughout. I would like to thank the
En-gineering and Physical Sciences Research Council (EPSRC) for funding me and allowing me the opportunity to work on this project. I am grateful to everyone
involved with the Complexity Science Doctoral Training Centre (DTC) for the sup-port, training and generally being my home for the past four years. The people
of the Warwick Infectious Disease and Epidemiology Research (WIDER) group, for their ideas and feedback. I am also thankful to Emma Jackson and Natural England
for providing the seagrass mapping data. Also to the Isles of Scilly Zostera group for their data and allowing me the opportunity to visit the islands; conduct field work
and swim with grey seals. I’d like to thank my thesis proof-readers, Jim Bull, Matt Keeling, Liz Buckingham-Jeffrey, Peter Dawson, Tom Rafferty and Merve Alanyali
for getting through my sometimes obfuscated writing.
Finally, I’d like to thank my family for their unwavering support, encouragement
and reminding me to keep my feet on the ground. To my awesome partner Jenny Lo, whose stuck with me through all the peaks and troughs during the PhD. Also to
all the friends and colleagues I have made during my time at Warwick. Including, but not limited to: Ben Collyer, Daniel Sprague, Mike Maitland, Peter Dawson,
Jenny Webb, Jonathan Skipp, Arran Tamsett, Quentin Caudron, Sergio Morales, Marcus Ong, Martine Barons, Chris Oates, Jamie Harris, Anthony Woolcock and
Declarations
This thesis is submitted to the University of Warwick in support of my application
for the degree of Doctor of Philosophy. It has been composed by myself and has not been submitted in any previous application for any degree.
The survey work discussed in chapter 3 was carried out as part of an on-going 18 year study into the health of zostera beds in the Isles of Scilly with the volunteer
group IOS zostera. I personally took part in the study in the summer of 2013, where I was involved with the collection of data and assistance in the survey work. I also
devised and participated in the study of regular spatial banding of the seagrass beds mentioned. The calculation of the return rate on the Isles of Scilly Zostera data
conducted in chapter 6 was performed by James C. Bull. Every effort has been made to credit the authors of the peer-reviewed literature which lay the foundations
Abstract
The main aim of the thesis is to explore the interaction between pattern and process in vegetation ecology using a variety of mathematical and statistical methods. Of particular interest is what information about the dynamics of the underlying system can be gained through a single spatial snapshot, such as an aerial photograph or satellite image. The hypotheses are related to seagrass ecology, whose growth is primarily clonal and broadly exists as a monoculture and thus makes it an ideal candidate to study these interactions. The thesis broadly concerns two forms of spatial pattern and the underlying dynamics that give rise to them. The first concerns regular pattern formation, where the pattern has a characteristic length scale. Examples are abundant in natural systems, such as mussel beds, semi-arid ecosystems as well as seagrass. The developments concerned with regular pattern formation include methods of detection in a large spatial dataset, a novel stochastic model of vegetation that produces regular pattern with plausible mechanisms, the development of a new methodology to fit regular spatial pattern data to the model and the impact as well as evolutionary mechanisms of regular patterning in the presence of disease.
Chapter 1
Introduction
[W]e must find ways to quantify patterns of variability in space and time, to understand how patterns change with scale. . . , and to understand the causes and consequences of pattern. . .
1.1
Motivation
Traditional survey techniques of a marine vegetation systems involve longitudi-nal studies with local sampling techniques such as quadrat sampling [Duarte and Kirkman, 2001; Pringle, 1984; Shears and Babcock, 2002]. These techniques rely on the assumption that the relevant scale of reference is of the order of the size of the quadrat (normally 1m2) and will often miss processes occurring at larger scales, such at the scale of whole ecosystems. The time-scale over which longitudinal, quadrat sampling occurs is also an issue. For a perennial plant species that has a turn-over rate greater than 2 years a study could typically last decades in order to collect sufficient data to answer questions on the dynamics of the ecosystem [Bull et al., 2012].
Often the assumption of spatial homogeneity is used to simplify mathematical analysis. Vegetation ecosystems are rarely completely homogeneous, often forming patchy landscapes with non-smooth boundaries [Adler et al., 2001; Wiens, 1989]. Processes such as dispersal of organisms, disease spread, persistence and coloni-sation depend on the form of these spatial patterns that the vegetation exhibits [Bertness and Callaway, 1994; Jolles et al., 2002; Nathan and Muller-Landau, 2000; Tilman, 1994]. For the management of ecosystems, it is therefore important to have techniques that can describe vegetation spatial patterns as well as techniques to understand their formation and their underlying dynamics. In order to probe the relationship between pattern and process, ecosystems where a single vegetation species dominates can be explored. One such species is seagrass [Hemminga and Duarte, 2000].
Seagrass exists largely as a monoculture exhibiting both clonal and sexual repro-duction in the form of shooting and seeding respectively [Kendrick et al., 2012]. It exhibits long and short-range feedback processes in the form of sedimentation; retardation of currents; crowding and anchoring from the growth of clonal mats [Ab-delrhman, 2003; Larkum et al., 2006]. It forms a number of different spatial patterns at a range of scales including banding and can display fractal meadow boundaries as well as scale-free patch-size distributions [Cunha and Santos, 2009; Van Der Heide et al., 2010]. As such it is an ideal species candidate to test the relationship between spatial pattern and dynamics.
stabilisation, by raising the seabed relative to the baseline level [Wright and Jones, 2006]. This breaks the wave before the coastline, thus reducing erosion from wave action. It can engineer its own environment, meaning it’s able to reduce currents significantly whilst also increasing deposition of sand giving protection and more access to light. The rhizome structure is an important carbon sink and recycles or-ganic nitrogen [Duarte et al., 2005; Touchette and Burkholder, 2000]. The meadows themselves provide an ecosystem for a large number of organisms and biodiversity is typically high with species of many different phyla including molluscs, fish and waterfowl [Beck et al., 2001]. Due to the economic and ecological importance and their rapid loss in recent years it is of pressing concern to study and understand the extent of seagrass losses, their ability to persist as meadows and their general efficacy as ecosystem service providers.
In recent years there has been a huge increase in the amount of spatial data obtained from remote sensing techniques available for ecological analysis [Kerr and Ostrovsky, 2003]. Data in the form of satellite imagery and aerial photographs have been used to identify species habitat, spatial extent and variability and how cofactors such as anthropogenic influences can change the resulting distribution [Buermann et al., 2008; Hansen et al., 2010; Lefsky et al., 2002]. This relatively new form of data in ecology requires new methodologies that will allow it to supplement more traditional data sources such as quadrat-based surveys. In particular the main hypothesis is that information on the dynamics of a vegetation system can be gained through analysing a single spatial snapshot. The gain in knowledge from the spatial pattern alone would represent a significant improvement over current surveying techniques.
1.2
Related efforts
grow in length the smaller you make the measurements. The development of this is to observe how the length of the object being studied grows as the length of the measurements decreases. This produces a power law, with an exponent that defines theFractal Dimension of an object [Falconer, 2013].
Fractal Theory has had a number of applications in vegetation ecology [Sugihara and M May, 1990]. Questions arising from studying patchy landscapes such as the size of habitat that can sustain a species population and the length of interfaces between two forms of vegetation have a natural setting in fractal theory. Often processes can dominate over a finite range of scales leading to processes that domi-nate for a different range of scales. This is why the term scaling theory has become more popular in recent years, circumventing some of the strict formalism laid out by Fractal theory [Halley et al., 2004]. The local scaling dimension of vegetation has been shown to affect species distributions, but relatively little work has been done on discerning the underlying mechanisms of what gives rise to these species distributions [Green et al., 2003; Wilson et al., 2004].
How the dynamics of a vegetative process gives rise to its shape has been discussed and originally proposed by Sugihara and M May [1990]. Vegetation is viewed broadly as a diffusion process with both dynamic and spatial scaling that are inter-related. This is quantified using a modified Brownian diffusion process with a tunable pa-rameter representing the persistence or anti-persistence of the process [Mandelbrot, 1979]. This parameter, known as theHurst Exponent has then been used to charac-terise different vegetative spatial patterns and used as a heuristic for dynamics such as succession [Hastings et al., 1982]. Being a phenomenological model however, it still remains unclear where the mechanistic link is between the dynamics and the resulting spatial pattern.
The Korcak exponent has been applied to several ecological processes including: correlating with grazing pressure on a landscape [Xin et al., 1999]; providing an estimate of patchiness and re-forestation [Imre et al., 2011]; relating to the cover between two species [Erlandsson et al., 2011] and providing a measure of persistence [Pascual et al., 2002]. There has been tantalising glimpses that varying Korcak exponents can give different vegetative dynamics and hence the Korcak exponent can be used as a measure of the vegetative dynamics and in particular its persistence [Cunha and Santos, 2009]. However, up to now there has been no research to demonstrate this relationship between dynamics and the Korcak exponent in situ.
A patch-size distribution displaying scale-free behaviour intuitively has fractal properties. As the distribution is a power law there is no relevant scale at which to observe the patches and hence there is a self-similar property over certain length scales. This has lead to discussion over how the patch-size scale free property can be related to the self-affine properties of the boundary of the patches. Various authors have looked at this relationship, but as yet there is no clear picture as to how they do relate if at all in a vegetative process [Hastings and Sugihara, 1993; Imre et al., 2012; Sugihara and M May, 1990].
The origin of such vegetation distributions has also gained much interest recently. Pattern formation concerns the emergence of regular patterns from homogeneous starting conditions and has broadly been studied using reaction-diffusion type sys-tems to characterise the necessary symmetry-breaking bifurcations needed for pat-tern formation to occur. In sessile ecology there are numerous examples of patpat-tern formation in semi-arid ecosystems [Lejeune and Tlidi, 1999], mussel beds [van de Koppel et al., 2005], coral reefs [Mistr and Bercovici, 2003] etc.
As a vegetative system evolves, certain parameters have a stronger influence over the nature of the dynamics than others. In semi-arid ecosystems, parameters such as rainfall determine whether the system is driven to a steady-state of high vegetation density or a steady-state of low vegetation density [Schwinning et al., 2004]. As a system approaches this point through variation of its parameters it undergoes a tipping point or bifurcation, where there is a qualitative change in the system dynamics. Often vegetative systems will display hysteresis, with the barren state persisting even if rainfall is increased [Von Hardenberg et al., 2001].
[Scheffer et al., 2009]. These measures can then be used as an indicator of whether a system is close to a catastrophe or not and hence can inform ecosystem managers to prevent a complete collapse of the system [Guttal and Jayaprakash, 2009]. These measures are applicable when the system is close to a bifurcation point, however if a system is far from equilibrium or not close to a tipping point then it is not clear what spatial indicators are suitable in order to establish the persistence of the ecosystem.
Indicators of bifurcation in vegetative spatial patterns have recently received much attention [Dakos et al., 2010, 2011; K´efi et al., 2014]. If the underlying mechanisms of a vegetative process are well understood then the system undergoes a predictable series of changes to the the spatial pattern as it moves from the vegetative state to the barren state [Rietkerk et al., 2004]. These spatial indicators could then provide a way of rapidly assessing how close an ecosystem is to a bifurcation. It remains unclear, however, whether spatial indicators can be detected in a real system and what the nature of them would be for a system with many scales of interaction.
The related efforts naturally lead to a number of hypotheses that shall be explored in this thesis. The primary of which is what the relationship is between temporal and spatial persistence. This can be broken down into a number of further hypothe-ses. Specifically, can the Korcak exponent, boundary dimension and other fractal measures of a spatial vegetation distribution be used as an effective heuristic in measuring the dynamic persistence in a real or simulated ecological system. What is the theoretical origin of the power-law scaling of the patch-size distribution and how does this exponent relate to underlying physical and ecological processes. Does the Korcak exponent change continuously with parameters of a system or is there an abrupt transition. Further hypotheses that shall be explored shall be whether a mechanistic model can both reproduce regular pattern formation and scale-free pat-tern formation. Is it possible to fit parameters to a single spatial snapshot using this model. Finally, how does the heterogeneity and pattern of a vegetation landscape impact other processes that may be occurring on said landscape, such as species dispersion or disease spread.
1.3
Summary of main development of thesis
A key finding has been the exploration of the relationship between persistence in the form of the return rate and spatial pattern in the form of the Korcak exponent. These results are a combination of analysis of seagrass datasets as well as from numerical simulation.
Current modelling of regular spatial pattern in vegetation is done using continuous deterministic models such as reaction diffusion. These models provide a good quali-tative description of how certain underlying mechanisms lead to pattern formation, however are difficult to apply directly to data. A novel model of regular pattern formation in vegetation is explored where the vegetation is modelled as individual units occupying a lattice. This allows direct comparison between the simulated spa-tial pattern and data. A novel technique of performing Bayesian model inference on vegetation spatial pattern data has also been constructed and explored in this thesis. This technique provides a way of taking a single snapshot of a spatial pattern and inferring a plausible model of vegetation growth with competition to it.
The spatial work has been supplemented by viewing vegetation as an aggregation process. This leads to a theoretical origin for the power law tail of the patch-size distribution as well as an explanation for the onset of an exponential tail observed in multiple spatial ecological systems such as mussel beds and semi-arid ecosystems.
Finally the role of pattern on process was explored by analysing how fractal and regular pattern properties of a vegetation affect the spread of disease through the vegetation. Heterogeneity of the distribution was found to slow down the progres-sion of the disease. While regular patterns in the form of banding was also found to regulate the progression and persistence of the disease and vegetation. The hypoth-esis explored was then whether regular patterns could have evolved in the presence of disease. It was found that under a wide-range of conditions, in particular when the disease has a high level of virulence, then the regular pattern trait dominates.
1.4
Outline of remainder of thesis
Bibliography
Mohamed A Abdelrhman. Effect of eelgrass zostera marina canopies on flow and transport. Marine Ecology Progress Series, 248:67–83, 2003.
P Adler, D Raff, and W Lauenroth. The effect of grazing on the spatial heterogeneity of vegetation. Oecologia, 128(4):465–479, 2001.
Michael W Beck, Kenneth L Heck Jr, Kenneth W Able, Daniel L Childers, David B Eggleston, Bronwyn M Gillanders, Benjamin Halpern, Cynthia G Hays, Kaho Hoshino, Thomas J Minello, et al. The identification, conservation, and man-agement of estuarine and marine nurseries for fish and invertebrates: A better understanding of the habitats that serve as nurseries for marine species and the factors that create site-specific variability in nursery quality will improve conser-vation and management of these areas. Bioscience, 51(8):633–641, 2001.
Mark D Bertness and Ragan Callaway. Positive interactions in communities.Trends in Ecology & Evolution, 9(5):191–193, 1994.
Wolfgang Buermann, Sassan Saatchi, Thomas B Smith, Brian R Zutta, Jaime A Chaves, Borja Mil´a, and Catherine H Graham. Predicting species distributions across the amazonian and andean regions using remote sensing data. Journal of Biogeography, 35(7):1160–1176, 2008.
James C Bull, Emma J Kenyon, and Kevan J Cook. Wasting disease regulates long-term population dynamics in a threatened seagrass. Oecologia, 169(1):135–142, 2012.
AH Cunha and RP Santos. The use of fractal geometry to determine the impact of inlet migration on the dynamics of a seagrass landscape. Estuarine, Coastal and Shelf Science, 84(4):584–590, 2009.
Vasilis Dakos, Egbert H van Nes, Ra´ul Donangelo, Hugo Fort, and Marten Scheffer. Spatial correlation as leading indicator of catastrophic shifts.Theoretical Ecology, 3(3):163–174, 2010.
Vasilis Dakos, Sonia K´efi, Max Rietkerk, Egbert H van Nes, and Marten Scheffer. Slowing down in spatially patterned ecosystems at the brink of collapse. The American Naturalist, 177(6):E153–E166, 2011.
C Middelburg Duarte, Jack J Middelburg, N Caraco, et al. Major role of marine vegetation on the oceanic carbon cycle. Biogeosciences, 2(1):1–8, 2005.
Carlos M Duarte and Hugh Kirkman. Methods for the measurement of seagrass abundance and depth distribution. Global seagrass research methods, pages 141– 153, 2001.
Johan Erlandsson, Christopher D McQuaid, and Martin Sk¨old. Patchiness and co-existence of indigenous and invasive mussels at small spatial scales: the interaction of facilitation and competition. PloS one, 6(11):e26958, 2011.
Kenneth Falconer. Fractal geometry: mathematical foundations and applications. John Wiley & Sons, 2013.
Jessica L Green, John Harte, and Annette Ostling. Species richness, endemism, and abundance patterns: tests of two fractal models in a serpentine grassland.Ecology Letters, 6(10):919–928, 2003.
Vishwesha Guttal and Ciriyam Jayaprakash. Spatial variance and spatial skew-ness: leading indicators of regime shifts in spatial ecological systems. Theoretical Ecology, 2(1):3–12, 2009.
JM Halley, S Hartley, AS Kallimanis, WE Kunin, JJ Lennon, and SP Sgardelis. Uses and abuses of fractal methodology in ecology. Ecology Letters, 7(3):254–271, 2004.
Harold M Hastings and George Sugihara. Fractals. a user’s guide for the natu-ral sciences. Oxford Science Publications, Oxford, New York: Oxford University Press,— c1993, 1, 1993.
Harold M Hastings, Richard Pekelney, Richard Monticciolo, David Vun Kannon, and Diane Del Monte. Time scales, persistence and patchiness. BioSystems, 15 (4):281–289, 1982.
Marten A Hemminga and Carlos M Duarte. Seagrass ecology. Cambridge University Press, 2000.
Attila R Imre, D´aniel Cseh, Markus Neteler, and Duccio Rocchini. Korcak dimension as a novel indicator of landscape fragmentation and re-forestation. Ecological indicators, 11(5):1134–1138, 2011.
Attila R Imre, Josef Novotn`y, and Duccio Rocchini. The korcak-exponent: a non-fractal descriptor for landscape patchiness. Ecological complexity, 12:70–74, 2012.
Anna E Jolles, Patrick Sullivan, Alisa P Alker, and C Drew Harvell. Disease trans-mission of aspergillosis in sea fans: inferring process from spatial pattern.Ecology, 83(9):2373–2378, 2002.
Sonia K´efi, Max Rietkerk, Manojit Roy, Alain Franc, Peter C De Ruiter, and Mer-cedes Pascual. Robust scaling in ecosystems and the meltdown of patch size distributions before extinction. Ecology letters, 14(1):29–35, 2011.
Sonia K´efi, Vishwesha Guttal, William A Brock, Stephen R Carpenter, Aaron M Ellison, Valerie N Livina, David A Seekell, Marten Scheffer, Egbert H van Nes, and Vasilis Dakos. Early warning signals of ecological transitions: Methods for spatial patterns. PloS one, 9(3):e92097, 2014.
Gary A Kendrick, Michelle Waycott, Tim JB Carruthers, Marion L Cambridge, Renae Hovey, Siegfried L Krauss, Paul S Lavery, Donald H Les, Ryan J Lowe, Oriol Mascar´o i Vidal, et al. The central role of dispersal in the maintenance and persistence of seagrass populations. BioScience, 62(1):56–65, 2012.
Jeremy T Kerr and Marsha Ostrovsky. From space to species: ecological applications for remote sensing. Trends in Ecology & Evolution, 18(6):299–305, 2003.
Michael A Lefsky, Warren B Cohen, Geoffrey G Parker, and David J Harding. Lidar remote sensing for ecosystem studies lidar, an emerging remote sensing technology that directly measures the three-dimensional distribution of plant canopies, can accurately estimate vegetation structural attributes and should be of particular interest to forest, landscape, and global ecologists. BioScience, 52(1):19–30, 2002.
Olivier Lejeune and Mustapha Tlidi. A model for the explanation of vegetation stripes (tiger bush). Journal of Vegetation Science, 10(2):201–208, 1999.
Bai-Lian Li. Fractal geometry applications in description and analysis of patch patterns and patch dynamics. Ecological Modelling, 132(1):33–50, 2000.
BB Mandelbrot. Fractals: form, chance and dimension. WH Freeman & Co., 1979.
Benoit B Mandelbrot. How long is the coast of britain. Science, 156(3775):636–638, 1967.
Benoit B Mandelbrot.The fractal geometry of nature, volume 173. Macmillan, 1983.
Susannah Mistr and David Bercovici. A theoretical model of pattern formation in coral reefs. Ecosystems, 6(1):0061–0074, 2003.
Ran Nathan and Helene C Muller-Landau. Spatial patterns of seed dispersal, their determinants and consequences for recruitment. Trends in ecology & evolution, 15(7):278–285, 2000.
Mercedes Pascual, Manojit Roy, Fr´ed´eric Guichard, and Glenn Flierl. Cluster size distributions: signatures of self–organization in spatial ecologies. Philosophical Transactions of the Royal Society of London. Series B: Biological Sciences, 357 (1421):657–666, 2002.
JD Pringle. Efficiency estimates for various quadrat sizes used in benthic sampling.
Canadian Journal of Fisheries and Aquatic Sciences, 41(10):1485–1489, 1984.
Max Rietkerk, Stefan C Dekker, Peter C de Ruiter, and Johan van de Koppel. Self-organized patchiness and catastrophic shifts in ecosystems. Science, 305(5692): 1926–1929, 2004.
Susan Schwinning, Osvaldo E Sala, Michael E Loik, and James R Ehleringer. Thresholds, memory, and seasonality: understanding pulse dynamics in arid/semi-arid ecosystems. Oecologia, 141(2):191–193, 2004.
Laurent Seuront. Fractals and multifractals in ecology and aquatic science. CRC Press, 2009.
Nick T Shears and Russell C Babcock. Marine reserves demonstrate top-down control of community structure on temperate reefs. Oecologia, 132(1):131–142, 2002.
George Sugihara and Robert M May. Applications of fractals in ecology. Trends in Ecology & Evolution, 5(3):79–86, 1990.
David Tilman. Competition and biodiversity in spatially structured habitats. Ecol-ogy, 75(1):2–16, 1994.
Brant W Touchette and JoAnn M Burkholder. Review of nitrogen and phosphorus metabolism in seagrasses. Journal of Experimental Marine Biology and Ecology, 250(1):133–167, 2000.
Johan van de Koppel, Max Rietkerk, Norbert Dankers, and Peter MJ Herman. Scale-dependent feedback and regular spatial patterns in young mussel beds. The American Naturalist, 165(3):E66–E77, 2005.
Tjisse Van Der Heide, Tjeerd J Bouma, Egbert H Van Nes, Johan Van De Koppel, Marten Scheffer, Jan GM Roelofs, Marieke M Van Katwijk, and Alfons JP Smol-ders. Spatial self-organized patterning in seagrasses along a depth gradient of an intertidal ecosystem. Ecology, 91(2):362–369, 2010.
J Von Hardenberg, E Meron, M Shachak, and Y Zarmi. Diversity of vegetation patterns and desertification. Physical Review Letters, 87(19):198101, 2001.
John A Wiens. Spatial scaling in ecology. Functional ecology, 3(4):385–397, 1989.
Robert J Wilson, Chris D Thomas, Richard Fox, David B Roy, and William E Kunin. Spatial patterns in species distributions reveal biodiversity change. Nature, 432 (7015):393–396, 2004.
Chapter 2
Background
. . . when he sees in a snail, or nautilus, or tiny foraminiferal or radiolarian shell a close approach to sphere or spiral, he is prone of old habit to believe that after all it is something more than a spiral or a sphere, and that in this “something more” there lies what neither mathematics nor physics can explain.
2.1
Introduction
Ecosystems such as marine, semi-arid and tropical are predominantly defined via the composition and distribution of their vegetation. Vegetation can colonise barren land and through successional species lead to a composition of species that appear in equilibrium with their environment. The vegetation species of many ecosystems therefore are pivotal in the sustainability and resilience of the overall system and an understanding of their dynamics is vital.
Resource increase Stress decrease
Community
Resource decrease Stress increase
Short-range activation
Long-range inhibition Autocatalysis
Figure 2.1: General mechanism for an activator-inhibitor system in vegetation. Lo-cally positive interaction occurs due to increase in resources and decrease stress. On larger spatial scales inhibition occurs through resource depletion and increase in stress (Adapted from [Rietkerk and Van de Koppel, 2008]).
characteristic length or if it is operating over a range of scales.
This chapter contains an outline of the modelling and theoretical research carried out to address the hypotheses outlined here. An outline of regular pattern formation in vegetation is carried out in the next section. This is where processes between vegetation and its environment create spatial patterns at a characteristic length scale. Patterns where there is no characteristic length scale, such as power law patch-size distributions are then reviewed. This leads on to stochastic patterns of vegetation with rough boundaries that are indicative of fractal phenomena. A review of the explanations of these phenomena are then given.
[image:32.595.326.515.327.597.2]2.2
Pattern formation
Figure 2.2: Various examples of regu-lar pattern formation in vegetation. Ex-amples are (a) semi-arid vegetation (b) shrubs & trees in Siberia (c) spotted vege-tation in Niger (d) mussel beds (e) reef is-lands (f) ribbon forests (g) marine benthic diatoms and (h) sedge (Reproduced from [Rietkerk and Van de Koppel, 2008]). In order to understand how
to a stable fixed point with a non-zero concentration of activator and inhibitor. However, when space is introduced, via a diffusion operator on the inhibitor and activator, small spatial perturbations can lead to the system moving away from the homogeneous fixed point to one of stable spatial patterns (when the diffusion con-stant of the inhibitor is sufficiently larger than the diffusion operator of the activator ).
The resulting patterns are due to the separation of scales between activator and inhibitor. On small scales, the activator is able to diffuse to reinforce the local high concentration of activator. On larger scales the inhibitor prevents the further diffusion of the activator leading to patterns of a fixed length scale such a spots, stripes and labyrinths. This activator-inhibitor mechanism provides an allegory for vegetation and its environment, where vegetation is dominated by positive local feedback on small scales, but negative feedback on larger spatial scales.
These regular patterns have been found in a number of ecosystems including wetlands [Foster et al., 1983; Sakaguchi, 1980; Swanson and Grigal, 1988], Savanna [Lejeune et al., 2002], Mussel beds [Bertness and Grosholz, 1985; Okamura, 1986; van de Koppel et al., 2005], coral reefs [Mistr and Bercovici, 2003] and intertidal mudflats [Blanchard et al., 2000; De Brouwer et al., 2000] (See Fig. 2.2). For marine systems such as mussel beds, intertidal mudflats and coral reefs mechanisms that induce spatial patterning are associated with the interplay between currents; the density of vegetation and other species; and the environment by way of nutrients, sediment and algae concentrations. The resulting spatial patterns give an indication as to the underlying model parameters that gave rise to such patterns.
Another type of non-Turing pattern was introduced by D’Odorico et al. [2007]. They considered a model of vegetation in the presence of random fire events where the vegetation has logarithmic growth and spatial diffusion. In the presence of no stochastic term, this is the regular Fisher equation, which produces no Turing bifurcation. An added stochastic term in the form of a Poisson process was used to model disturbances due to fires. The resulting spatial patterns produced are transient in nature and do not have a regular length-scale. This provides caution that although if a particular spatial pattern is observed, it is not necessarily the case that the pattern forming process can be immediately identified from the spatial pattern alone and the underlying mechanisms must also be discerned.
Regular spatial patterns are one class of patterning that is ubiquitous in vegetation ecosystems. Another type are scale-free spatial patterns, which in contrast to regular patterns do not have a characteristic length-scale. Usually there is some property of the pattern, such as the roughness of cluster boundaries or the size distribution of clusters that has a scale free or power-law distribution where the cluster sizesis related to its frequency via the relationship
N(s)∼s−γ, (2.1)
where γ is the exponent of the power-law distribution. An explanation for the formation of these scale-free patterns comes from the the idea put forward by Bak et al. [1987], known as self-organised criticality. This is where, without fine-tuning of parameters or starting from a particular initial state, an extended spatial system with many degrees of freedom evolves towards a critical state. In this critical state, the system is barely stable and small perturbations can lead to dissipations on all length-scales. A concrete, relevant example of a system that displays self-organised criticality is the forest fire model [Drossel and Schwabl, 1992]. The model is an abstraction of a forest that can be colonised with a single species and is subject to random disturbances in the form of fire that can burn through the vegetation leading to barren states that can be occupied again. The model is specified as a probabilistic cellular automata on a square lattice, where each cell can either be empty, occupied or burning. The model is updated at each time-step using four rules
1. A burning site becomes an empty site with probability 1.
3. An empty site becomes occupied with probabilityp.
4. An occupied site can become burning with probabilityf.
Time can be rescaled so there is a single parameter on which the dynamics depends p/f. For a suitable parameter range, there is a cascade of fire events, where the total size of a forest fire has a power-law distribution. This critical state is reached regardless of initial conditions and for a large range of the parameter. The model dynamics evolve the system to a state where disturbance cascades of any size can occur (if the system size is suitably larger than the range of scales considered).
2.2.1 Semi-arid ecosystems
Semi-arid ecosystems have produced a large amount of research into regular pat-tern formation, where the competition for water dominates growth of vegetation. Modelling has taken two forms. Thiery et al. [1995] introduces a model of pattern formation in arid ecosystems via a deterministic cellular automata model. Space is divided up into a lattice and each lattice site contains the quantity Si,j,t represent-ing the quantity of vegetation at sitei, j at timet. The deterministic dynamics are then updated according to a convolution, which mediates the local and long-range cooperation and competition effects. The dynamics are then summarised as
Si,j,t+1=Si,j,t+ max{−1,min{1,(A∗S)i,j}}, (2.2)
∗ is the convolution operator and A is a matrix representing the cooperation and competition between plants. Thiery considers a simplified interaction matrix with two parameters representing interactions in the presence of a gentle slope and the resulting spatial patterns are qualitatively consistent with observations from aerial photographs. The interaction being locally positive and negative at long-range is again important for vegetation bands to occur. Although the spatial patterns pro-duced are striking, the model is purely phenomenological in its description and no quantitative parameter fitting was performed.
Lefever and Lejeune [1997] also consider a deterministic model of vegetation growth with long-range spatial competition that induces regular spatial patterns. The kinetic equation has three componentsF1 represents the growth of vegetation
densitycdue to facilitation and local dispersal. F2 is a competition term that limits
the growth of the c term. The final term, F3 represents mortality and leads to a
The interaction between vegetation and its environment producing regular pat-terns is particularly well-studied in the field of ecohydrology, where there is competi-tion between vegetacompeti-tion units for ground water inducing spatial pattern. Borgogno et al. [2009] reviews the main mechanisms proposed to pattern formation in ecohy-drology including both deterministic and stochastic models. They conclude with a set of open challenges in the field. These include under what conditions pattern can form in a noisy environment and what form of model validation can occur purely on observations of spatial pattern when many mechanisms are known to generate similar spatial patterns.
2.3
Critical phenomena
neighbours is greater than one then the sand particle jumps into the lower site. The new site, where the sand has jumped to, is again checked to see if the difference in particles between itself and its neighbours is greater than one and the relaxation dynamics continue until this inequality is satisfied. After a certain relaxation period it is found that the length of these relaxation events or avalanches that occur can be arbitrary in size; the distribution of avalanche sizes is in fact a power law. The system is thus one that has freely evolved into a state of criticality. Other models that exhibit SOC have also been produced such as an evolutionary model, where extinction events have a power law distribution [Sneppen et al., 1995]. The final form of criticality proposed is robust criticality, where there is scale-invariance and long-range correlations for a wide-range of parameters in the system (for an exam-ple see [Guichard et al., 2003]). The review also states that three or more states are required for robust criticality to occur. Obvious questions arise about why this number of states is necessary for robust criticality to emerge and how the power-law observations depend upon the parameters in the critical region.
spatial patterns can form near a critical bifurcation [Rietkerk et al., 2004]. However, [Scheffer et al., 2009] notes that these change in spatial pattern are model-specific and thus the conclusions of how the spatial pattern predicts the critical transition is only true insofar as the underlying model is an adequate description of the system in question.
The work on detection of criticality in the observations of natural systems has mainly focused on the temporal characteristics of the system. Guttal and Jayaprakash [2009] proposes a methodology where the spatial characteristics of a signal spatial snapshot can be used to detect when an ecological system is close to criticality. They consider a vegetation with logistic growth, various dispersal mechanisms including local diffusion and heavy-tailed spatial kernels as well as a stochastic grazing pres-sure that leads to the vegetation being bistable between the barren and vegetated states. Spatial variance was shown to increase and spatial skewness spikes near the critical point. They also demonstrate that intervention based on use of these spatial statistics can lead to recovery of the ecosystem that would otherwise collapse under constant grazing pressure. Although a wide variety of models were proposed where variance and skewness were good indicators of crititical transitions in the sense that acting on them was able to avert the collapse of a population, Hastings and Wysham [2010] shows this is not always the case. They constructed two models based on the Ricker equation of population growth in order to demonstrate the limitations of these indicators. Whereas Guttal and Jayaprakash [2009] had model equations with smooth potentials around the critical transition points, the Hastings and Wysham model does not and thus the general argument of population fluctuations near a transition point do not hold. This leads to no warning of a dramatic population shift from the fluctuation statistics. Thus model-specific assumptions are vital to understand when applying general theory to real ecological data.
2.4
Scaling
Scaling in spatial ecology has been recognised as an important link between pattern and process [Levin, 1995]. The idea that an underlying generative process can lead to patterns that hold a particular scaling that are invariant began with fractals.
connection between the patterns generated by an underlying process and the process itself. They give an example of the fractional Brownian motion (fBm) to highlight this claim. Standard Brownian motion was originally proposed as a model for how grains of pollen diffuse in a liquid being buffeted by random forces. The motion of the particle is described in one dimension by a displacement X(t). For standard Brownian motion the root mean squared of the particle distance scales as
p
E[(X(t)−X(0))2]∼t1/2. (2.3)
In fractional Brownian motion this relationship is generalised where the scaling of root mean squared is replaced by an exponentH, known as the Hurst exponent. i.e.
p
E[(X(t)−X(0))2]∼tH. (2.4)
There are three main domains for the Hurst parameter: 0< H <1/2,H= 1/2 and 1/2< H <1. When 0< H <1/2 the trajectory is known as anti-persistent, where the future trajectory of the particle is anti-correlated with its current displacement. For 1/2< H <1 the fBm is described as persistent; the trajectory is correlated with its past displacements and a realisation of the process is smoother than for lower values of the Hurst exponent. H= 1/2 is the classical Brownian motion where the process is memoryless and the future trajectory is uncorrelated with its past. This model is traditionally used to detect the presence of memory in time-series analysis. The process can also be generalised to more than one dimension, in three dimensions level-sets of the process have been employed as neutral models of patchy landscapes [Hastings et al., 1982; Keitt, 2000]. These patches have a resulting fractal dimension defined by the parameter H. This is a tantalising clue that spatial pattern can be analysed to determine the underlying process.
Figure 2.3: Measuring the Korcak exponent k from an aerial photograph of vege-tation clusters in the Kalahari. The image is converted into counts of patch sizes, which is used to estimate the patch-size distribution,P(A≥a), the probability that a randomly chosen patch is greater than size a. On a log-log scale the distribution is approximately linear and can be fitted using linear regression. The gradient of the fitted line is the estimate of the Korcak exponent. Reproduced from Scanlon et al. [2007].
Another widely used fractal measure used in spatial ecology to characterise the patchiness of landscapes is the Korcak dimension. Originally, it was introduced by Korˇc´ak [1938] studying the size distribution of Aegean islands. Mandelbrot [1983] further developed the theory of the dimension and how it could be applied to analyse certain fractal models. If the sizes of patches follows the distribution
N(A≥a) =na−k. (2.5)
Then the Korcak dimensionDk is defined to be
Dk= 2k. (2.6)
Mandelbrot [1983] explored the possibilities of using this as a measure of fragmen-tation in a vegefragmen-tation landscape. The Korcak dimension was proposed as a first degree measure of succession for a vegetation species [Hastings et al., 1982]. More recently it has been used to measure patchiness and reforestation [Imre et al., 2011, 2012].
rainfall varied in different locations. A binary cellular automata model was used to explain this distribution where there was a global term based on overall rainfall and a local positive feedback term. It was found that the positive feedback term was necessary to induce power-law behaviour, but the behaviour was robust to a range of local feedback parameters. Although the model does reproduce the distribution well, the relationship between the scaling exponent of the power-law distribution and the ability of the system to persist still remains an open problem.
K´efi et al. [2007a] analysed patch-size distributions in the presence of various graz-ing pressures. Under high grazgraz-ing pressure the patch-size distribution deviated from a power law characterised by a distribution with exponential cut-off. They propose a model of vegetation growth where growth has a local positive feedback mechanism and grazing is modelled as a spatially homogeneous rate at which cells die. The model was found to reproduce the broad features of the observed vegetation patches including the power-law meltdown for increased grazing pressure. Maestre and Es-cudero [2009] tested whether deviations from a power-law patch-size distribution are indicative of immediate desertification. They found that deviations as measured by fitting a truncated power law were not positively correlated with desertification variables, but vegetation cover was. K´efi et al. [2011] provides further restrictions on when the meltdown of power-law structures in robust critical systems occurs when the system is under an increased amount of stress. They analysed four models that display robust criticality from an arid ecosystem model [K´efi et al., 2007b], a mussel bed model [Guichard et al., 2003] , predator-prey model [Durrett and Levin, 1994; Pascual et al., 2002] and a null model where there is no spatial dependency. Although there is a certain universality to the meltdown of the power-law patch size distribution near a critical transition, no single indicator provides an overall picture of the distance to a critical transition and measurements must be taken relevant to each other. Also no experimental work on real ecosystems has been used to ver-ify these claims, hence there are still gaps in the knowledge of how the patch-size distribution can be used in the practical application of measuring extinction risk.
depen-dence. The disturbed sites are also assumed to have a density dependent feedback, where the disturbance can spread locally. The resulting dynamics leads to robust criticality, where there is a large region of parameter space where power-law scal-ing of the patch-size distribution is observed. The exponent of the distribution was found to almost be independent of the parameters however. This raises the question as to what conditions the exponent is indicative of the underlying parameters and ultimately the dynamics.
One particular application of fractal theory is in invasion fronts of vegetation. Cannas et al. [2006] introduce a model of vegetation growth with long-range dispersal and show that the fractal boundary of the front increases with increasing dispersal length under certain model assumptions. This indicates that it is theoretically possible to capture some broad features of an invasion front from the underlying dynamics. How general this relationship is in the presence of environmental feedback is still an open problem, however. Recent evidence suggests that fractal roughening of a vegetation invasion front can be detected in an experimental system [Allstadt et al., 2014].
The concept of scale and spatial variability in vegetation spatial patterns leads naturally to the idea of multifractals. Intuitively we can consider multifractals as a description of a spatial pattern with scale-invariance like in the standard fractal case, but the scale-invariance changes locally in space. This extends the standard definition of a fractal dimension to include a range of fractal dimensions or R´enyi Dimensions with parameter q. Multifractal methodology has had some applica-tion in vegetaapplica-tion patterns, including the use of it to classify the varying dispersal length-scales for two competing vegetation species Scheuring and Riedi [1994]. A multifractal distribution of vegetation has also been interpreted as evidence for self-organised criticality in the system [Sol´e and Manrubia, 1995a]. Theoretically, the multifractal measure seems to be an elegant solution to the problem of characteris-ing both scale and variability in a vegetation landscape. However, there has been some criticism surrounding how the measure can be applied to noisy ecological data and the validity of the results based on these measurements [Zamir, 2003].
whereas cellular automata are discrete. The Ising model considers a state space where each lattice site is in one of two states{+1,−1}. The total latticeStherefore has 2N×N configurations, where each configuration is denoted asσ. The probability of a configuration being in statex is given by
P(σ =x) = 1 Z exp
β
X
i∼j
xixj+h
X
i xi
, (2.7)
where i ∼ j denotes the neighbours of j. β is the interaction strength between neighbours andhis a forcing term that represents the tendency to favour the occu-pied (+1) state. When the parametersh and β are fine-tuned, critical phenomena occurs such as algebraic decay of spatial correlation and power-law size distributions of the +1 and−1 state, which is indicative of a phase transition.
2.5
Conclusion
In this review a wide variety of spatial mechanisms that induce pattern formation in vegetation ecology have been explored, with the focus on the relationship between spatial pattern and persistence. The types of spatial pattern belong roughly to two classes: scale-free and regular. Although there have been many models proposed to explain these phenomena in various ecosystems there are some similarities between them. Regular spatial patterns are often seen as a sign of local positive feedback pro-cesses along with long-range inhibition mediated by the environment either through competition for resources or some other long-range mechanism. Regular spatial patterns can also be viewed as transient states as a system moves towards either a barren or vegetated equilibrium. This can also occur where the system is somehow kept far from equilibrium, hence although it appears the system is moving towards an equilibrium point it may take an arbitrarily long time in order to reach it.
Scale-free patterning in the form of power law patch-size distributions are also a ubiquitous characteristic of vegetation ecosystems. The meltdown of the power-law distribution has been found to be a robust indicator as to whether a system is close to a tipping point. Although questions remain over what systems this form of behaviour is exhibited and indeed if there are other indicators that can be used on single spatial snapshots to determine if a system is close to criticality. The other indicators proposed include the exponent of the patch-size distribution itself, which is often referred to as the Korcak exponent. It is not clear what the origin of this scale-free behaviour is in these systems or whether the exponent is related to the dynamic persistence of the system (although it does provide a measure of the spatial persistence).
Both scale-free and regular patterns are exhibited in seagrass ecosystems. Seagrass exists as a monoculture and has strong feedback loops with its environment. As such it is an ideal candidate to study the interaction between pattern and process. Although a certain amount of modelling research has been performed on seagrass ecosystems, models have not been produced that exhibit both types of pattern phenomena and can be used to determine how spatial pattern impacts persistence.
Bibliography
Andrew J Allstadt, Jonathan A Newman, Jonathan A Walter, G Korniss, and Thomas Caraco. Dispersal limitation and roughening of the ecological interface.
arXiv preprint arXiv:1403.4574, 2014.
Per Bak. How nature works. Oxford university press Oxford, 1997.
Per Bak, Chao Tang, and Kurt Wiesenfeld. Self-organized criticality: An explana-tion of the 1/f noise. Physical review letters, 59(4):381, 1987.
Mark D Bertness and Edwin Grosholz. Population dynamics of the ribbed mussel, geukensia demissa: the costs and benefits of an aggregated distribution.Oecologia, 67(2):192–204, 1985.
GF Blanchard, DM Paterson, LJ Stal, P Richard, R Galois, V Huet, J Kelly, C Hon-eywill, J De Brouwer, K Dyer, et al. The effect of geomorphological structures on potential biostabilisation by microphytobenthos on intertidal mudflats. Con-tinental Shelf Research, 20(10):1243–1256, 2000.
Fabio Borgogno, P D’Odorico, Francesco Laio, and Luca Ridolfi. Mathematical models of vegetation pattern formation in ecohydrology. Reviews of Geophysics, 47(1), 2009.
Sergio A Cannas, Diana E Marco, and Marcelo A Montemurro. Long range dispersal and spatial pattern formation in biological invasions. Mathematical biosciences, 203(2):155–170, 2006.
JFC De Brouwer, S Bjelic, EMGT De Deckere, and LJ Stal. Interplay between biol-ogy and sedimentolbiol-ogy in a mudflat (biezelingse ham, westerschelde, the nether-lands). Continental shelf research, 20(10):1159–1177, 2000.
Barbara Drossel and Franz Schwabl. Self-organized critical forest-fire model. Phys-ical Review Letters, 69(11):1629, 1992.
Richard Durrett and Simon Levin. The importance of being discrete (and spatial).
Theoretical population biology, 46(3):363–394, 1994.
Kenneth Falconer. Fractal geometry: mathematical foundations and applications. John Wiley & Sons, 2013.
DR Foster, GA King, PH Glaser, and HE Wright. Origin of string patterns in boreal peatlands. 1983.
Fr´ed´eric Guichard, Patti M Halpin, Gary W Allison, Jane Lubchenco, and Bruce A Menge. Mussel disturbance dynamics: signatures of oceanographic forcing from local interactions. The American Naturalist, 161(6):889–904, 2003.
Vishwesha Guttal and Ciriyam Jayaprakash. Spatial variance and spatial skew-ness: leading indicators of regime shifts in spatial ecological systems. Theoretical Ecology, 2(1):3–12, 2009.
JM Halley, S Hartley, AS Kallimanis, WE Kunin, JJ Lennon, and SP Sgardelis. Uses and abuses of fractal methodology in ecology. Ecology Letters, 7(3):254–271, 2004.
Alan Hastings and Derin B Wysham. Regime shifts in ecological systems can occur with no warning. Ecology Letters, 13(4):464–472, 2010.
Harold M Hastings, Richard Pekelney, Richard Monticciolo, David Vun Kannon, and Diane Del Monte. Time scales, persistence and patchiness. BioSystems, 15 (4):281–289, 1982.
Reinier HilleRisLambers, Max Rietkerk, Frank van den Bosch, Herbert HT Prins, and Hans de Kroon. Vegetation pattern formation in semi-arid grazing systems.
Ecology, 82(1):50–61, 2001.
Attila R Imre, D´aniel Cseh, Markus Neteler, and Duccio Rocchini. Korcak dimension as a novel indicator of landscape fragmentation and re-forestation. Ecological indicators, 11(5):1134–1138, 2011.
Sonia K´efi, Max Rietkerk, Concepci´on L Alados, Yolanda Pueyo, Vasilios P Papanas-tasis, Ahmed ElAich, and Peter C De Ruiter. Spatial vegetation patterns and imminent desertification in mediterranean arid ecosystems. Nature, 449(7159): 213–217, 2007a.
Sonia K´efi, Max Rietkerk, Minus van Baalen, and Michel Loreau. Local facilitation, bistability and transitions in arid ecosystems. Theoretical Population Biology, 71 (3):367–379, 2007b.
Sonia K´efi, Maarten B Eppinga, Peter C de Ruiter, and Max Rietkerk. Bistability and regular spatial patterns in arid ecosystems.Theoretical Ecology, 3(4):257–269, 2010.
Sonia K´efi, Max Rietkerk, Manojit Roy, Alain Franc, Peter C De Ruiter, and Mer-cedes Pascual. Robust scaling in ecosystems and the meltdown of patch size distributions before extinction. Ecology letters, 14(1):29–35, 2011.
Timothy H Keitt. Spectral representation of neutral landscapes. Landscape Ecology, 15(5):479–494, 2000.
Shinya Kizaki and Makoto Katori. Analysis of canopy-gap structures of forests by ising-gibbs states-equilibrium and scaling property of real forests. Journal of the Physical Society of Japan, 68(8):2553–2560, 1999.
Christopher A Klausmeier. Regular and irregular patterns in semiarid vegetation.
Science, 284(5421):1826–1828, 1999.
Jarom´ır Korˇc´ak. Deux types fondamentaux de distribution statistique. Comit´e d’organisation, 1938.
Takuya Kubo, Yoh Iwasa, and Naoki Furumoto. Forest spatial dynamics with gap expansion: total gap area and gap size distribution.Journal of theoretical Biology, 180(3):229–246, 1996.
Ren´e Lefever and Olivier Lejeune. On the origin of tiger bush. Bulletin of Mathe-matical Biology, 59(2):263–294, 1997.
Olivier Lejeune and Mustapha Tlidi. A model for the explanation of vegetation stripes (tiger bush). Journal of Vegetation Science, 10(2):201–208, 1999.
Simon A Levin. The problem of pattern and scale in ecology. Springer, 1995.
Fernando T Maestre and Adri´an Escudero. Is the patch size distribution of vegeta-tion a suitable indicator of desertificavegeta-tion processes? Ecology, 90(7):1729–1735, 2009.
Benoit B Mandelbrot.The fractal geometry of nature, volume 173. Macmillan, 1983.
Susanna C Manrubia and Ricard V Sol´e. Self-organized criticality in rainforest dynamics. Chaos, Solitons & Fractals, 7(4):523–541, 1996.
Susannah Mistr and David Bercovici. A theoretical model of pattern formation in coral reefs. Ecosystems, 6(1):0061–0074, 2003.
JD Murray. Mathematical biology: I. An introduction. Springer, 2001.
B Okamura. Group living and the effects of spatial position in aggregations of mytilus edulis. Oecologia, 69(3):341–347, 1986.
Mercedes Pascual and Fr´ed´eric Guichard. Criticality and disturbance in spatial ecological systems. Trends in ecology & evolution, 20(2):88–95, 2005.
Mercedes Pascual, Manojit Roy, Fr´ed´eric Guichard, and Glenn Flierl. Cluster size distributions: signatures of self–organization in spatial ecologies. Philosophical Transactions of the Royal Society of London. Series B: Biological Sciences, 357 (1421):657–666, 2002.
Max Rietkerk and Johan Van de Koppel. Regular pattern formation in real ecosys-tems. Trends in Ecology & Evolution, 23(3):169–175, 2008.
Max Rietkerk, Maarten C Boerlijst, Frank van Langevelde, Reinier HilleRisLambers, Johan van de Koppel, Lalit Kumar, Herbert HT Prins, and Andr´e M de Roos. Self-organization of vegetation in arid ecosystems. The American Naturalist, 160 (4):524–530, 2002.
Max Rietkerk, Stefan C Dekker, Peter C de Ruiter, and Johan van de Koppel. Self-organized patchiness and catastrophic shifts in ecosystems. Science, 305(5692): 1926–1929, 2004.
Todd M Scanlon, Kelly K Caylor, Simon A Levin, and Ignacio Rodriguez-Iturbe. Positive feedbacks promote power-law clustering of kalahari vegetation. Nature, 449(7159):209–212, 2007.
Marten Scheffer, Jordi Bascompte, William A Brock, Victor Brovkin, Stephen R Carpenter, Vasilis Dakos, Hermann Held, Egbert H van Nes, Max Rietkerk, and George Sugihara. Early-warning signals for critical transitions.Nature, 461(7260): 53–59, 2009.
Istv´an Scheuring and Rudolf H Riedi. Application of multifractals to the analysis of vegetation pattern. Journal of Vegetation Science, 5(4):489–496, 1994.
Robert Schlicht and Yoh Iwasa. Forest gap dynamics and the ising model. Journal of theoretical biology, 230(1):65–75, 2004.
Laurent Seuront. Fractals and multifractals in ecology and aquatic science. CRC Press, 2009.
Jonathan A Sherratt. An analysis of vegetation stripe formation in semi-arid land-scapes. Journal of mathematical biology, 51(2):183–197, 2005.
NM Shnerb, P Sarah, H Lavee, and S Solomon. Reactive glass and vegetation patterns. Physical review letters, 90(3):038101, 2003.
Kim Sneppen, Per Bak, Henrik Flyvbjerg, and Mogens H Jensen. Evolution as a self-organized critical phenomenon. Proceedings of the National Academy of Sciences, 92(11):5209–5213, 1995.
Ricard V Sol´e and Susanna C Manrubia. Are rainforests self-organized in a critical state? Journal of Theoretical Biology, 173(1):31–40, 1995a.
Ricard V Sol´e and Susanna C Manrubia. Self-similarity in rain forests: evidence for a critical state. Physical review E, 51(6):6250, 1995b.
H Eugene Stanley. Introduction to phase transitions and critical phenomena. Intro-duction to Phase Transitions and Critical Phenomena, by H Eugene Stanley, pp.
336. Foreword by H Eugene Stanley. Oxford University Press, Jul 1987. ISBN-10: 0195053168. ISBN-13: 9780195053166, 1, 1987.
David K Swanson and David F Grigal. A simulation model of mire patterning.
Oikos, pages 309–314, 1988.
JM Thiery, J-M d’Herbes, and Christian Valentin. A model simulating the genesis of banded vegetation patterns in niger. Journal of Ecology, pages 497–507, 1995.
Alan Mathison Turing. The chemical basis of morphogenesis. Philosophical Trans-actions of the Royal Society of London. Series B, Biological Sciences, 237(641): 37–72, 1952.
Johan van de Koppel, Max Rietkerk, Norbert Dankers, and Peter MJ Herman. Scale-dependent feedback and regular spatial patterns in young mussel beds. The American Naturalist, 165(3):E66–E77, 2005.
Chapter 3
Seagrass
Stretch’d on her mossy couch, in trackless deeps, Queen of the coral groves,Zostera sleeps;
The silvery sea-weed matted round her bed, And distant surges murmuring o’er her head.
3.1
Introduction
Vegetation-based ecosystems, where an ecosystem is described by a single or assem-blage of sessile species, represent a large class of vital communities that are found globally. Examples of these ecosystems dominated by an assemblage include wet woodland [Peterken, 1996], temperate bogs [Scheffer et al., 2001], coral reefs [Hus-ton, 1985] and tropical mangrove swamps [Lugo and Snedaker, 1974]. In chapter 2, we considered the variety of pattern formation processes that have been observed and the modelling efforts that have been performed in order to understand the ori-gins of pattern formation in vegetation-based ecosystems. The efforts shall be to understand how pattern and dynamics are linked through modelling work that will be introduced in chapter 5 and further developed in chapters 6 & 7. In order to assess the validity of this modelling work, we shall refer to a test case of a marine vegetation ecosystem. This test case allows us to apply hypotheses directly to a real ecosystem for which we have data in order to test their validity.
The system that shall be considered is Seagrass, which is a class of marine flow-ering plants that are found globally in coastal areas and contribute a significant number of ecosystem services. In this chapter their biology and ecology will be described with specific reference to how they relate to pattern formation and per-sistence. A set of field studies taken from seagrass habitats in the Isles of Scilly, UK will then be described along with specific field work carried out to confirm the nature of the observed spatial patterns. The author personally participated in the field study in the summer of 2013 and was involved with data collection, assisting survey work as well as devising and participating the the banding study. These field studies shall be used to test key hypotheses laid out in the introduction on the nature of dynamic and temporal persistence in a vegetation community as well as the various observed spatial patterns taken from an aerial photographic survey conducted in conjunction with the longitudinal study.
![Figure 2.2:Various examples of regu-lar pattern formation in vegetation. Ex-amples are (a) semi-arid vegetation (b)shrubs & trees in Siberia (c) spotted vege-tation in Niger (d) mussel beds (e) reef is-lands (f) ribbon forests (g) marine benthicdiatoms and (h) sedge (Reproduced from[Rietkerk and Van de Koppel, 2008]).](https://thumb-us.123doks.com/thumbv2/123dok_us/9561637.460658/32.595.326.515.327.597/various-formation-vegetation-vegetation-siberia-benthicdiatoms-reproduced-rietkerk.webp)
![Figure 3.1: The global distribution of Seagrass species. Reproduced from Orth et al.[2006].](https://thumb-us.123doks.com/thumbv2/123dok_us/9561637.460658/55.595.124.519.107.322/figure-global-distribution-seagrass-species-reproduced-orth-et.webp)