Original citation:
Bolton, Louise, Reiman, Anne, Lucas, Katie, Timms, Judith and Cree, Ian A.. (2015) KRAS mutation analysis by PCR : a comparison of two methods. PLoS One, Volume 10 (Number 1). Article number e0115672. ISSN 1932-6203
Permanent WRAP url:
http://wrap.warwick.ac.uk/65590
Copyright and reuse:
The Warwick Research Archive Portal (WRAP) makes this work of researchers of the University of Warwick available open access under the following conditions.
This article is made available under the Creative Commons Attribution 4.0 International license (CC BY 4.0) and may be reused according to the conditions of the license. For more details see: http://creativecommons.org/licenses/by/4.0/
A note on versions:
The version presented in WRAP is the published version, or, version of record, and may be cited as it appears here.
KRAS Mutation Analysis by PCR: A
Comparison of Two Methods
Louise Bolton1, Anne Reiman2, Katie Lucas2, Judith Timms2, Ian A. Cree2*
1Department of Pathology, Queen Alexandra Hospital, Portsmouth, United Kingdom,2Department of Pathology and Warwick Medical School, University Hospitals Coventry and Warwickshire, Coventry, United Kingdom
Abstract
Background
KRAS mutation assays are important companion diagnostic tests to guide EGFR anti-body treatment of metastatic colorectal cancer. Direct comparison of newer diagnostic methods with existing methods is an important part of validation of any new technique. In this this study, we have compared the Therascreen (Qiagen) ARMS assay with Competitive Allele-Specific TaqMan PCR (castPCR, Life Technologies) to determine equivalence for KRAS mutation analysis.
Methods
DNA was extracted by Maxwell (Promega) from 99 colorectal cancers. The ARMS-based Therascreen and a customized castPCR assay were performed according to the manufac-turer’s instructions. All assays were performed on either an Applied Biosystems 7500 Fast Dx or a ViiA7 real-time PCR machine (both from Life Technologies). The data were collect-ed and discrepant results re-testcollect-ed with newly extractcollect-ed DNA from the same blocks in both assay types.
Results
Of the 99 tumors included, Therascreen showed 62 tumors to be wild-type (WT) for KRAS, while 37 had KRAS mutations on initial testing. CastPCR showed 61 tumors to be wild-type (WT) for KRAS, while 38 had KRAS mutations. Thirteen tumors showed BRAF mutation in castPCR and in one of these there was also a KRAS mutation. The custom castPCR plate included several other KRAS mutations and BRAF V600E, not included in Therascreen, ex-plaining the higher number of mutations detected by castPCR. Re-testing of discrepant re-sults was required in three tumors, all of which then achieved concordance for KRAS. CastPCR assay Ct values were on average 2 cycles lower than Therascreen.
Conclusion
There was excellent correlation between the two methods. Although castPCR assay shows lower Ct values than Therascreen, this is unlikely to be clinically significant.
OPEN ACCESS
Citation:Bolton L, Reiman A, Lucas K, Timms J, Cree IA (2015) KRAS Mutation Analysis by PCR: A Comparison of Two Methods. PLoS ONE 10(1): e0115672. doi:10.1371/journal.pone.0115672
Academic Editor:Jorg Tost, CEA - Institut de Genomique, FRANCE
Received:September 4, 2013
Accepted:November 26, 2014
Published:January 8, 2015
Copyright:© 2015 Bolton et al. This is an open access article distributed under the terms of the
Creative Commons Attribution License, which permits unrestricted use, distribution, and reproduction in any medium, provided the original author and source are credited.
Funding:The authors are grateful to Life Technologies Ltd for their assistance and to Merck Serono for funding the testing of colorectal cancer for KRAS mutations in both Portsmouth and Coventry. The funders had no role in study design, data collection and analysis, decision to publish, or preparation of the manuscript.
Introduction
Colorectal carcinogenesis involves multiple steps with accumulation of numerous acquired genetic and epigenetic events [1,2]. Only a small fraction of these alterations actually drive tumorigenesis initiating the transformation of normal colonic epithelium and lead to the de-velopment of malignant carcinomas and eventually advanced metastatic disease. The under-standing of colorectal cancer (CRC) biology is rapidly growing and several molecular pathways including Wnt-β-catenin, TGF—βand epidermal growth factor receptor (EGFR) signalling have been identified that are deregulated at different stages of colon carcinogenesis [2,3]. Genetic alterations in CRC show promise as potential biomarkers for early cancer di-agnosis as well as in selection of patients for treatment [4–8]. In recent years targeted thera-pies inhibiting EGFR signalling have been introduced into clinical practice resulting in improvement of overall survival of a subset of patients with advanced metastatic disease. Mu-tations in theKRASproto-oncogene are now widely recognized to be predictive for primary as well as acquired resistance to tailored therapy with anti-EGFR antibodies in colorectal can-cer [9–11]. Approximately 40% of CRCs harbour mutations ofKRASthat occur at early stages of the disease and are present throughout tumor progression to metastatic stages [1,12–14].KRASmutations are usually in exon 2 with approximately 80% missense muta-tions in codon 12 and 20% in codon 13. The functional consequence of mutamuta-tions in these two codons is activation of EGRF-Ras-Raf-MAPK-pathway (Fig. 1) that impairs the response of cancer cells to anti-EGFR antibody therapies. Likewise, rareKRAS-activating mutations in codons 61 and 146 [9,15] may be also associated with attenuated response to therapy with targeted drugs [16].
KRASmutation assays are important companion diagnostic tests to guide the use of anti-EGFR antibody treatment of metastatic colorectal cancer. U.S. Food and Drug Administration (FDA) and the European Medicines Evaluation Agency require thatKRASmutation status is determined prior to anti-EGFR treatment. As a high proportion of late stage colorectal cancers will relapse, it is common to perform these tests on the primary tumor. In many pathology lab-oratories the diagnosis of a cancer with high metastatic potential or which has spread triggers an automatic request forKRAStesting. Such‘reflex testing’by the pathology laboratory has the advantage that results are available immediately if metastatic disease occurs and more quickly in those cases with metastases.
The primary tumor usually has ample material for assay, in the form of formalin-fixed par-affin-embedded (FFPE) blocks, from which samples with high neoplastic cell content can be obtained [17]. Small biopsies of inoperable or metastatic disease are more challenging, and may contain few neoplastic cells. The current assays forKRASgenotyping in tumor samples in-clude direct sequencing of genomic DNA and PCR based assays [18]. Although sequencing of-fers better coverage of the coding sequence and identifies specific locations of genetic
alterations in the gene, it is relatively time consuming and its diagnostic sensitivity depends on the mutant/wild-type allele ratio present in the tumor that makes the detection of point muta-tions particularly challenging. PCR based methods are more sensitive but do not test for less frequently occurring mutations with as yet uncertain clinical implications. The present study compares Therascreen (Qiagen) assay with in house Taqman Mutation Detection Assays pow-ered by castPCR technology (Life Technologies), hereafter called‘castPCR’, to determine equivalence forKRASmutation analysis. The Therascreen assay was chosen as the comparator as it was the method in use in the laboratory, and is widely used in both clinical and
trial settings.
Figure 1. Diagram showing the contribution of KRAS and BRAF to the EGFR pathway.Activating mutations in both BRAF and KRAS will result in EGFR independent cell proliferation and hence resistance to anti-EGFR antibody treatment.
Methods
Samples
A total of 99 tumors were included in the study from those submitted for routine histopatholo-gy to either of the two centres involved. Inclusion criteria were a diagnosis of colorectal cancer following surgical resection, with sufficient tissue blocks taken to select one for assay. All were obtained from patients with written consent for use of tissue surplus to diagnostic require-ments according to tissue bank ethics approval. Samples from Portsmouth were drawn from the Portsmouth Molecular Pathology Tissue Bank, approved by the UK National Research Eth-ics Service (NRES), North West Research EthEth-ics Committee, and Coventry samples were drawn from the Arden Tissue Bank, approved by the UK NRES South Central Research Ethics Committee. There were no exclusion criteria. For each case, the histology was reviewed to con-firm colorectal cancer, a block selected by the histopathologist, and areas identified on an H&E slide from which cores should be taken for KRAS mutation detection. Cores were taken using a manual tissue arrayer (MTA1; Beecher Instruments Inc., Sun Prairie, WI, USA) fitted with a punch stylet 1.0 mm in diameter was aligned over the desired area of interest (AOI), which was punched out from the block. The stylet was decontaminated (DNA Zap, Life Technologies) and cleaned (70% alcohol) between each FFPE block. In Coventry, punches were taken using a disposable 1mm skin punch with an ejection mechanism (Meditech Systems Ltd, Shaftesbury, Dorset, UK). A minimum of two 1.0 mm diameter cores were obtained from each block and placed in a sterile labelled 1.5 ml microcentrifuge tube.
Mutational analysis of
KRAS
and
BRAF
Genomic DNA was extracted from two cores obtained from areas of colorectal cancer (>50% neoplastic cells) identified by a pathologist in blocks of formalin-fixed paraffin-embedded (FFPE) tissue in 99 tumors. DNA extraction was performed using the automated Maxwell 16 Instrument with the Maxwell 16 FFPE Plus LEV DNA Purification Kit (Promega), following the manufacturer’s instructions. DNA content was determined by Nanodrop sphectrophoto-metry. Samples were subjected to mutation analysis using ARMS-based Therascreen assay and castPCR method according to manufacturer’s recommendations. In Portsmouth both assays were performed in 96-well plates, on an Applied Biosystems 7500 Fast Dx real-time PCR ma-chine (Life Technologies), while in Coventry, the Therascreen assays was performed in tubes in a Rotorgene PCR machine, and the castPCR assays in 96 well plates in a ViiA7 PCR machine (Life Technologies). All assays were performed without knowledge of the results of the other assay by trained biomedical scientists (LB, AR and KL). The data were collected and discrepant results re-tested with newly extracted DNA from the same blocks in both assay types.
Therascreen
KRAS
PCR
analysis matrix defined by the manufacturer. The control assay, labelled with FAM, is used to assess the total DNA in a sample and amplifies a region of exon 4 of theKRASgene, avoiding known polymorphisms. Reported sensitivity for mutations in Therascreen is 1% (www.qiagen.com).
Competitive Allele-Specific TaqMan PCR (CastPCR)
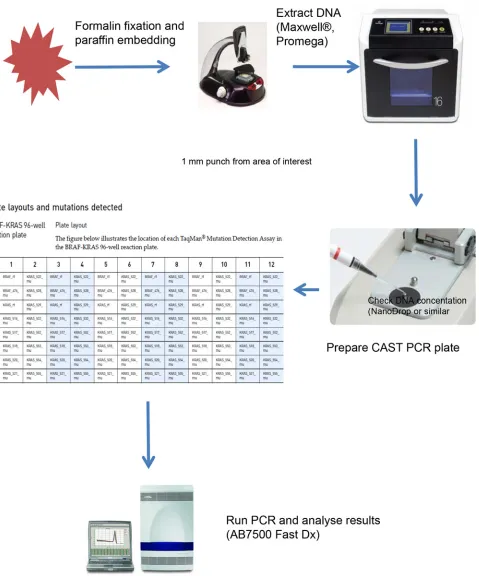
The sample flow of castPCR is illustrated inFig. 2. The mutation detection assay for all 99 tumor samples was performed in 96-well plates, each containing 6 replicates of the custom BRAF-KRAS panel. Each replicate detects 1 wild typeBRAFand 1 wild typeKRASgene refer-ence sequrefer-ence within exon 3 ofBRAFandKRASrespectively, theBRAFV600E mutation and 13 distinctKRASmutations (Life Technologies, Paisley, UK) as shown inTable 1. 50 ng of gDNA was used per reaction and the reaction volume was 20 µl. Cycling conditions were 95⁰ for 10 min followed by 5 cycles of 92⁰for 15 sec and 58⁰for 1 min and 40 cycles of 92⁰for 15 sec and 60⁰for 1 min. Reported sensitivity for mutations is down to 0.1% mutation in a back-ground of wild type DNA [22].
Data analysis
Both tests identify assay failure or success based on reference gene Ct values, and the presence or absence of a mutation based onΔCt values according to criteria defined by the manufactur-er. The results were tabulated (Table 1) and discordant results identified. These tumors were re-tested by both assays using newly extracted DNA from further cores from the same or an ad-jacent tissue block from the tumor. Statistically, sensitivity was calculated as the proportion of tumors withKRASmutation identified by castPCR/proportion of tumors withKRASmutation identified by Therascreen, ignoring those mutations present in castPCR that are not tested by Therascreen. Specificity was defined as the proportion of wild-type tumors identified by castPCR/proportion of wild-type tumors identified by Therascreen. The primary measure of concordance (p) was also determined, as used by Changet al.[23] as the proportion of the
KRASwild-type (Therascreen assay) patients who were also identified as KRAS wild-type by the comparator: p = [a/(a + b)]. An alternative method is to use Cohen Kappa statistics, where κ= (p(a)—p(e))/(1-p(e), where p(a) is the observed agreement, and p(e) is the probability of chance agreement. If there is complete agreement thenκ= 1, while is there is no agreement other than that expected by chance,κ= 0.
For analysis of KRAS Ct values, which are not normally distributed, between the two meth-ods we have quoted median values and the range. Statistical comparison was performed by paired non-parametric statistics (Wilcoxon rank sum test) using SPSS, ver 22 (IBM).
Results
In order to compare two PCR based mutation detection methods, a total of 99 colorectal cancer samples were tested forKRASand/orBRAFstatus by castPCR and Therascreen. Tables1and2
summarise the genotyping results for both methods, whileTable 3shows the detailed results for each tumor tested. Both methods gave results in all patients, with no failed assays. Of the tu-mors included, 37 harbouredKRASmutation confirmed by both methods with re-testing of discrepant results (37%) and 13BRAFp.V600E mutation by castPCR (13%).BRAFV600E mu-tation was not included in the Therascreen KRAS kit used. The most frequently detectedKRAS alterations were codon 12 missense mutations c35G>T, p.G12V and c35G>A, p.G12D (both in 10 samples). Codon 13 mutations were also detected but at a lower rate (6 samples).
Figure 2. Sample flow for CAST PCR using automated extraction to allow results to be generated in<24 hours.
mutations occurred together in a further tumor sample. Therascreen identified 37/38KRAS mu-tations found by castPCR, though this is explicable on the basis of a mutation (KRASc.182A>G) not present in Therascreen.
There were three discordant results between the two assay types on initial testing, with com-plete concordance from initial testing in 96/99 tumors (96%). This equates toκ= 0.94, showing excellent agreement. The number ofKRASwild-type (therascreen assay) patients who were also identified asKRASwild-type by the castPCR was 61/62, giving a primary measure of con-cordance (p) of 0.984. Statistical sensitivity and specificity were 95% and 98% respectively.
[image:8.612.37.584.89.333.2]Discordant tumors were then re-tested (Tables1and3). One sample was negative in Therasc-reen and borderline positive (ΔCt = 9.41) by castPCR, however on re-testing it was considered wild-type in both assays. One tumor was called mutant initially by Therascreen and wild-type by castPCR, but was wild-type on re-testing by both assays. The third sample was initially tested mutant in Therascreen and borderline wild-type in castPCR but subsequent re-testing showed mutations with both methods.
Table 1. Summary of results.
Mutation Amino Acid Change Cast PCR Therascreen
BRAF c.1799T>A p.V600E 13
-KRAS c.34G>T p.G12C 5 5
KRAS c.34G>A p.G12S 1 (2) 1
KRAS c.34G>C p.G12R 3 3
KRAS c.35G>T p.G12V 10 10
KRAS c.35G>A p.G12D 10 10
KRAS c.35G>C p.G12A 2 (1) 2 (3)
KRAS c.37G>A p.G13S 0
-KRAS c.37G>C p.G13R 0
-KRAS c.38G>A p.G13D 6 6
KRAS c.182A>G p.Q61R 1
-KRAS c.182A>T p.Q61L 0
-KRAS c.183A>C p.Q61H 0
-KRAS c.183A>T p.Q61H 0
-Total of KRAS mutant 38 (38) 37 (38)
Total BRAF mutant 13
-Total wild-type 48 62
Total Patients 99 99
Therascreen does not include Q61 mutations orBRAF. One tumor hadKRASp.G13D and p.Q61R mutations, while a further tumor hadBRAFp.V600E andKRASp.G12V mutations. This table includes re-testing results in three tumors (orginal results in brackets), and dual mutations in two tumors. One tumor was called wild-type by castPCR, and mutant by Therascreen, with a mutation by both methods on re-testing. Two further tumors were called mutant by either castPCR or Therascreen: both were wild-type on re-testing.
doi:10.1371/journal.pone.0115672.t001
Table 2. A concordance matrix forKRASfor mutations included in both the Therascreen and castPCR assays.
KRAS only castPCR
WT Mutant
WT 61 1
Mutant 2 37
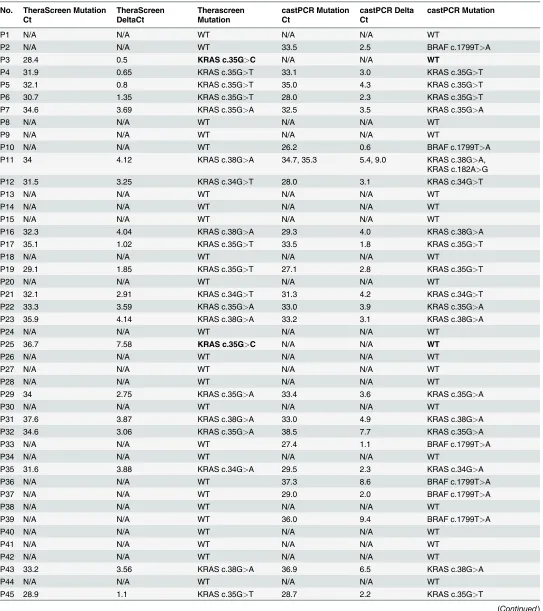
[image:8.612.199.577.644.697.2]Table 3. Results for castPCR and Therascreen for each case included in the study.
No. TheraScreen Mutation Ct
TheraScreen DeltaCt
Therascreen Mutation
castPCR Mutation Ct
castPCR Delta Ct
castPCR Mutation
P1 N/A N/A WT N/A N/A WT
P2 N/A N/A WT 33.5 2.5 BRAF c.1799T>A
P3 28.4 0.5 KRAS c.35G>C N/A N/A WT
P4 31.9 0.65 KRAS c.35G>T 33.1 3.0 KRAS c.35G>T
P5 32.1 0.8 KRAS c.35G>T 35.0 4.3 KRAS c.35G>T
P6 30.7 1.35 KRAS c.35G>T 28.0 2.3 KRAS c.35G>T
P7 34.6 3.69 KRAS c.35G>A 32.5 3.5 KRAS c.35G>A
P8 N/A N/A WT N/A N/A WT
P9 N/A N/A WT N/A N/A WT
P10 N/A N/A WT 26.2 0.6 BRAF c.1799T>A
P11 34 4.12 KRAS c.38G>A 34.7, 35.3 5.4, 9.0 KRAS c.38G>A, KRAS c.182A>G
P12 31.5 3.25 KRAS c.34G>T 28.0 3.1 KRAS c.34G>T
P13 N/A N/A WT N/A N/A WT
P14 N/A N/A WT N/A N/A WT
P15 N/A N/A WT N/A N/A WT
P16 32.3 4.04 KRAS c.38G>A 29.3 4.0 KRAS c.38G>A
P17 35.1 1.02 KRAS c.35G>T 33.5 1.8 KRAS c.35G>T
P18 N/A N/A WT N/A N/A WT
P19 29.1 1.85 KRAS c.35G>T 27.1 2.8 KRAS c.35G>T
P20 N/A N/A WT N/A N/A WT
P21 32.1 2.91 KRAS c.34G>T 31.3 4.2 KRAS c.34G>T
P22 33.3 3.59 KRAS c.35G>A 33.0 3.9 KRAS c.35G>A
P23 35.9 4.14 KRAS c.38G>A 33.2 3.1 KRAS c.38G>A
P24 N/A N/A WT N/A N/A WT
P25 36.7 7.58 KRAS c.35G>C N/A N/A WT
P26 N/A N/A WT N/A N/A WT
P27 N/A N/A WT N/A N/A WT
P28 N/A N/A WT N/A N/A WT
P29 34 2.75 KRAS c.35G>A 33.4 3.6 KRAS c.35G>A
P30 N/A N/A WT N/A N/A WT
P31 37.6 3.87 KRAS c.38G>A 33.0 4.9 KRAS c.38G>A
P32 34.6 3.06 KRAS c.35G>A 38.5 7.7 KRAS c.35G>A
P33 N/A N/A WT 27.4 1.1 BRAF c.1799T>A
P34 N/A N/A WT N/A N/A WT
P35 31.6 3.88 KRAS c.34G>A 29.5 2.3 KRAS c.34G>A
P36 N/A N/A WT 37.3 8.6 BRAF c.1799T>A
P37 N/A N/A WT 29.0 2.0 BRAF c.1799T>A
P38 N/A N/A WT N/A N/A WT
P39 N/A N/A WT 36.0 9.4 BRAF c.1799T>A
P40 N/A N/A WT N/A N/A WT
P41 N/A N/A WT N/A N/A WT
P42 N/A N/A WT N/A N/A WT
P43 33.2 3.56 KRAS c.38G>A 36.9 6.5 KRAS c.38G>A
P44 N/A N/A WT N/A N/A WT
P45 28.9 1.1 KRAS c.35G>T 28.7 2.2 KRAS c.35G>T
Table 3. (Continued)
No. TheraScreen Mutation Ct
TheraScreen DeltaCt
Therascreen Mutation
castPCR Mutation Ct
castPCR Delta Ct
castPCR Mutation
P46 N/A N/A WT N/A N/A WT
P47 32.7 6.38 KRAS c.34G>T 30.4 4.2 KRAS c.34G>T
P48 N/A N/A WT N/A N/A WT
P49 32.4 6.97 KRAS c.35G>A 28.2 2.7 KRAS c.35G>A
P50 N/A N/A WT N/A N/A WT
P51 N/A N/A WT N/A N/A WT
P52 N/A N/A WT 39.4 9.4 KRAS c.34G>A
P53 32 4.35 KRAS c.35G>A 30.9 3.6 KRAS c.35G>A
P54 N/A N/A WT N/A N/A WT
P55 N/A N/A WT N/A N/A WT
P56 31.4 3.21 KRAS c.34G>T 30.4 3.7 KRAS c.34G>T
P57 N/A N/A WT N/A N/A WT
P58 32.5 4.04 KRAS c.35G>A 32.8 4.3 KRAS c.35G>A
P59 30 3.12 KRAS c.35G>T 29.6 4.4 KRAS c.35G>T
P60 N/A N/A WT N/A N/A WT
P61 N/A N/A WT N/A N/A WT
P62 30.1 2.73 KRAS c.34G>C 27.7, 3.89, KRAS c.34G>C
P63 N/A N/A WT N/A N/A WT
P64 N/A N/A WT N/A N/A WT
P65 N/A N/A WT N/A N/A WT
P66 N/A N/A WT 27.3 1.6 BRAF c.1799T>A
P67 31.6 3.97 KRAS c.35G>A 28.6 3.6 KRAS c.35G>A
P68 32.2 4.26 KRAS c.35G>A 30.2 4.4 KRAS c.35G>A
P69 N/A N/A WT N/A N/A WT
P70 N/A N/A WT N/A N/A WT
P71 N/A N/A WT 26.9 1.4 BRAF c.1799T>A
P72 N/A N/A WT N/A N/A WT
P73 N/A N/A WT N/A N/A WT
P74 29.5 2.16 KRAS c.34G>C 28.1 3.2 KRAS c.34G>C
P75 29.7 1.68 KRAS c.35G>T 28.5 2.5 KRAS c.35G>T
P76 30.5 2.02 KRAS c.35G>T 29.8 4.5 KRAS c.35G>T
P77 N/A N/A WT N/A N/A WT
P78 N/A N/A WT N/A N/A WT
P79 N/A N/A WT N/A N/A WT
P80 N/A N/A WT N/A N/A WT
P81 34.1 2.33 KRAS c.34G>C 33.1 4.0 KRAS c.34G>C
P82 N/A N/A WT N/A N/A WT
P83 N/A N/A WT N/A N/A WT
P84 N/A N/A WT 27.1 1.6 BRAF c.1799T>A
P85 36.6 4.58 KRAS c.38G>A 34.3 5.1 KRAS c.38G>A
N/A N/A WT 28.8 2.7 BRAF c.1799T>A
P86 30.8 2.3 KRAS c.35G>T 30.0, 35.1 4.1, 8.9 KRAS c.35G>T, BRAF c.1799T>A
P87 N/A N/A WT N/A N/A WT
P88 N/A N/A WT N/A N/A WT
P89 N/A N/A WT N/A N/A WT
The median mutation detection Ct values forKRASmutations detected by both methods were 32.1 (range 27.9–37.6) for Therascreen and 30.4 (range 27.1–38.5) for castPCR (Wilcoxon p<0.012). The deltaCt values were 3.09 (range 0.65–6.97) and 3.79 (range 1.75–7.65) for Ther-ascreen and castPCR respectively (Wilcoxon p<0.002). The castPCR Ct values for KRAS were therefore 2 cycles lower than Therascreen.
Discussion
This study evaluates two PCR based assays forKRASmutation detection in formalin-fixed par-affin-embedded CRC tissue samples. We observed three discrepancies between two mutation detection methods, which were solved by re-testing. Discrepancies are to be expected as most methods use cutoff values determined by relation to controls and have differing PCR efficiency. In tumors with little mutant DNA present, this will lead to differences in mutation detection. Similar small differences between methods using Therascreen as a comparator have been re-ported by others [18,24–29]. Changet al. [23] conducted a retrospective study of the CRYS-TAL trial samples with Therasceen and LNA, showing excellent concordance, while Gonzalez de Castroet al. [18] showed similarly good concordance of 98% between Therascreen and cobas (Roche). Altimari et al. [27] showed reasonable concordance between Therascreen, pyro-sequencing and Roche 454 pyro-sequencing, but noted the poor diagnostic sensitivity of Sanger se-quencing. Therascreen has also been used to validate other PCR assays [25,28], including high resolution melt analysis [29]. It should be noted that the diagnostic sensitivity of sequencing methods is dependent on the size of PCR products: FFPE tissue samples have fragmentation of their DNA and products>150 bp suffer loss of diagnostic sensitivity [30].
In addition, it is increasingly accepted that intra-tumoral heterogeneity [31] can lead to the dilution of small proportions of mutant DNA by wild-type DNA despite high neoplastic cell numbers within the sample. It is unclear what proportion of mutation-containing neoplastic cells is required to produce clinical resistance: such considerations require very large datasets, which are not available. Although not a recommended by the manufacturers of either test, it is our practice to re-test results using further punches from another block when the Ct values are within one cycle of the threshold.
[image:11.612.36.578.93.233.2]KRASmutations were detected in 38% of CRC samples, which is in agreement with the fre-quency observed in previous reports [32,33]. Interestingly, one tumor sample harbored two Table 3. (Continued)
No. TheraScreen Mutation Ct
TheraScreen DeltaCt
Therascreen Mutation
castPCR Mutation Ct
castPCR Delta Ct
castPCR Mutation
N/A N/A WT N/A N/A WT
P90 N/A N/A WT 27.0 1.5 BRAF c.1799T>A
W1 27.85 2.14 KRAS c.35G>C 30.5 3.4 KRAS c.35G>C
W2 30.53 2.26 KRAS c.35G>A 29.7 2.6 KRAS c.35G>A
W3 28.57 2.86 KRAS c.34G>T 31.4 4.0 KRAS c.34G>T
W4 N/A N/A WT N/A N/A WT
W5 N/A N/A WT 28.7 1.3 BRAF c.1799T>A
W7 N/A N/A WT N/A N/A WT
W8 N/A N/A WT N/A N/A WT
Ct values for each reference gene are given with theΔCt. An analysis matrix is used to determine the assay result (mutant or wild-type) according to thresholds defined by the manufacturer. There were three discrepant results (shown in bold): P3 showedKRASc.35G>C by both methods on retesting, while P25 and P52 were both wild-type. Two cases (P11 and P86) showed amplification for more than one mutation. N/A, not applicable; WT, wild-type.
differentKRASmutations (p.G13D and p.Q61R) whilst another tumor wasKRAS/BRAF dou-ble mutant. Both results probably reflect clonality within a tumor sample, or a collision tumor derived from two different initiating adenomas. Genetic heterogeneity within tumor samples is becoming increasingly evident as diagnostic tests with high sensitivity are able to detect sub-clones in tumor that have acquired additional mutations over time. Double mutations inKRAS in colorectal cancer have been reported before, however their clinical relevance is not known [34,35]. In addition, it is becoming clear that not allKRASmutations are equal: data are emerging to suggest that patients harboring the codon 13 c.38 G>A mutation may actually benefit from anti-EGFR treatment, suggesting incomplete activation of KRAS by this mutation [12,36]. The effect of rareKRAS-activating mutations in codon 61 and 146 is also a matter of debate.
An oncogenic missense mutation p.V600E inBRAF, a downstream signalling molecule of
KRAS, has been identified in around 5% of colorectal cancer tumors, though somewhat higher in this series at 10%, and results in activation of the MAPK signalling pathway [14].BRAF p.V600E missense mutation is associated with poor prognosis in colorectal cancer and accord-ing to some recent reports, it has negative predictive value in anti-EGFR antibody therapy [18], though this has yet to reach sufficient levels of evidence to update clinical guidance [9–11,37]. Thus it is likely that combined testing forKRASmutations andBRAFp.V600E in CRC will be required for clinical practice in the near future [37]. Mutations in other genes, such asPIK3CA andNRASmay also influence anti-EGFR treatment efficacy in colorectal cancer [37]. This has recently led to the requirement that laboratories should test forNRASas well asKRAS muta-tions with amended product labels for anti-EGFR antibody therapy [38].
Advantages of the custom castPCR plates used here is that they include Q61KRASmutation and also provide potentially valuable information onBRAFstatus in CRC samples. These can be further customised to suit the needs of individual laboratories. It is feasible to include these and other mutation hotspots in user customised castPCR plates, allowing larger numbers of clinically relevant mutations to be included and providing a real alternative to next generation sequencing, particularly for laboratories without this facility.
In conclusion, a good correlation was observed between the two methods. CastPCR shows slightly lower Ct values than Therascreen, however this is unlikely to be clinically significant. Our results show that castPCR is a reproducible and reliable assay that can be used as a diag-nostic test for KRAS genotyping in formalin-fixed paraffin-embedded colorectal
cancer samples.
Acknowledgments
We are grateful to the colorectal multidisciplinary teams in Portsmouth and Coventry those who contributed samples for this study, and to the tissue banks at both sites that provided expert support.
Author Contributions
Conceived and designed the experiments: IC. Performed the experiments: LB AR KL. Analyzed the data: KL JT IC. Wrote the paper: LB AR IC.
References
1. Vogelstein B, Fearon ER, Hamilton SR, Kern SE, Preisinger AC, et al. (1988) Genetic alterations during colorectal-tumor development. N Engl J Med 319: 525–532. doi:10.1056/NEJM198809013190901
PMID:2841597
3. Kinzler KW, Vogelstein B (1996) Lessons from hereditary colorectal cancer. Cell 87: 159–170. doi:10. 1016/S0092-8674(00)81333-1PMID:8861899
4. Pritchard CC, Grady WM (2011) Colorectal cancer molecular biology moves into clinical practice. Gut 60: 116–129. doi:10.1136/gut.2009.206250PMID:20921207
5. Diehl F, Schmidt K, Durkee KH, Moore KJ, Goodman SN, et al. (2008) Analysis of mutations in DNA isolated from plasma and stool of colorectal cancer patients. Gastroenterology 135: 489–498. doi:10. 1053/j.gastro.2008.05.039PMID:18602395
6. Ahlquist DA, Zou H, Domanico M, Mahoney DW, Yab TC, et al. (2012) Next-generation stool DNA test accurately detects colorectal cancer and large adenomas. Gastroenterology 142: 248–256; quiz e225–246. doi:10.1053/j.gastro.2011.10.031PMID:22062357
7. Mead R, Duku M, Bhandari P, Cree IA (2011) Circulating tumour markers can define patients with nor-mal colons, benign polyps, and cancers. Br J Cancer 105: 239–245. doi:10.1038/bjc.2011.230PMID:
21712823
8. Crowley E, Di Nicolantonio F, Loupakis F, Bardelli A (2013) Liquid biopsy: monitoring cancer-genetics in the blood. Nat Rev Clin Oncol 10: 472–484. doi:10.1038/nrclinonc.2013.110PMID:23836314
9. Evaluation of Genomic Applications in P, Prevention Working G (2013) Recommendations from the EGAPP Working Group: can testing of tumor tissue for mutations in EGFR pathway downstream effec-tor genes in patients with metastatic colorectal cancer improve health outcomes by guiding decisions regarding anti-EGFR therapy? Genet Med 15: 517–527. doi:10.1038/gim.2012.184PMID:23429431
10. Garcia-Alfonso P, Salazar R, Garcia-Foncillas J, Musulen E, Garcia-Carbonero R, et al. (2012) Guide-lines for biomarker testing in colorectal carcinoma (CRC): a national consensus of the Spanish Society of Pathology (SEAP) and the Spanish Society of Medical Oncology (SEOM). Clin Transl Oncol 14: 726–739. doi:10.1007/s12094-012-0856-5PMID:22855150
11. Aubin F, Gill S, Burkes R, Colwell B, Kamel-Reid S, et al. (2011) Canadian Expert Group consensus recommendations: KRAS testing in colorectal cancer. Curr Oncol 18: e180–184. doi:10.3747/co. v18i4.779PMID:21874108
12. De Roock W, Jonker DJ, Di Nicolantonio F, Sartore-Bianchi A, Tu D, et al. (2010) Association of KRAS p.G13D mutation with outcome in patients with chemotherapy-refractory metastatic colorectal cancer treated with cetuximab. JAMA 304: 1812–1820. doi:10.1001/jama.2010.1535PMID:20978259
13. Sartore-Bianchi A, Martini M, Molinari F, Veronese S, Nichelatti M, et al. (2009) PIK3CA mutations in colorectal cancer are associated with clinical resistance to EGFR-targeted monoclonal antibodies. Can-cer Res 69: 1851–1857. doi:10.1158/0008-5472.CAN-08-2466PMID:19223544
14. Di Nicolantonio F, Martini M, Molinari F, SartoBianchi A, Arena S, et al. (2008) Wild-type BRAF is re-quired for response to panitumumab or cetuximab in metastatic colorectal cancer. J Clin Oncol 26: 5705–5712. doi:10.1200/JCO.2008.18.0786PMID:19001320
15. Edkins S, O’Meara S, Parker A, Stevens C, Reis M, et al. (2006) Recurrent KRAS codon 146 mutations in human colorectal cancer. Cancer Biol Ther 5: 928–932. doi:10.4161/cbt.5.8.3251PMID:16969076
16. Loupakis F, Ruzzo A, Cremolini C, Vincenzi B, Salvatore L, et al. (2009) KRAS codon 61, 146 and BRAF mutations predict resistance to cetuximab plus irinotecan in KRAS codon 12 and 13 wild-type metastatic colorectal cancer. Br J Cancer 101: 715–721. doi:10.1038/sj.bjc.6605177PMID:19603018
17. van Krieken JH, Normanno N, Blackhall F, Boone E, Botti G, et al. (2013) Guideline on the requirements of external quality assessment programs in molecular pathology. Virchows Arch 462: 27–37. doi:10. 1007/s00428-012-1354-4PMID:23250354
18. Gonzalez de Castro D, Angulo B, Gomez B, Mair D, Martinez R, et al. (2012) A comparison of three methods for detecting KRAS mutations in formalin-fixed colorectal cancer specimens. Br J Cancer 107: 345–351. doi:10.1038/bjc.2012.259PMID:22713664
19. Whitcombe D, Theaker J, Guy SP, Brown T, Little S (1999) Detection of PCR products using self-probing amplicons and fluorescence. Nat Biotechnol 17: 804–807. doi:10.1038/11751PMID:
10429248
20. Newton CR, Graham A, Heptinstall LE, Powell SJ, Summers C, et al. (1989) Analysis of any point muta-tion in DNA. The amplificamuta-tion refractory mutamuta-tion system (ARMS). Nucleic Acids Res 17: 2503–2516. PMID:2785681
21. Thelwell N, Millington S, Solinas A, Booth J, Brown T (2000) Mode of action and application of Scorpion primers to mutation detection. Nucleic Acids Res 28: 3752–3761. doi:10.1093/nar/28.19.3752PMID:
11000267
23. Chang SC, Denne J, Zhao L, Horak C, Green G, et al. (2013) Comparison of KRAS genotype: therasc-reen assay vs. LNA-mediated qPCR clamping assay. Clin Colorectal Cancer 12: 195–203 e192. doi:
10.1016/j.clcc.2013.05.001
24. Adams JA, Post KM, Bilbo SA, Wang X, Sen JD, et al. (2014) Performance evaluation comparison of 3 commercially available PCR-based KRAS mutation testing platforms. Appl Immunohistochem Mol Morphol 22: 231–235. doi:10.1097/PDM.0b013e3182a127f9PMID:24614151
25. Cavallini A, Valentini AM, Lippolis C, Campanella D, Guerra V, et al. (2010) KRAS genotyping as bio-marker in colorectal cancer: a comparison of three commercial kits on histologic material. Anticancer Res 30: 5251–5256. PMID:21187522
26. Sundstrom M, Edlund K, Lindell M, Glimelius B, Birgisson H, et al. (2010) KRAS analysis in colorectal carcinoma: analytical aspects of Pyrosequencing and allele-specific PCR in clinical practice. BMC Can-cer 10: 660. doi:10.1186/1471-2407-10-660PMID:21122130
27. Altimari A, de Biase D, De Maglio G, Gruppioni E, Capizzi E, et al. (2013) 454 next generation-sequencing outperforms allele-specific PCR, Sanger generation-sequencing, and pyrogeneration-sequencing for routine KRAS mutation analysis of formalin-fixed, paraffin-embedded samples. Onco Targets Ther 6: 1057–1064. doi:10.2147/OTT.S42369PMID:23950653
28. Jancik S, Drabek J, Berkovcova J, Xu YZ, Stankova M, et al. (2012) A comparison of Direct sequenc-ing, Pyrosequencsequenc-ing, High resolution melting analysis, TheraScreen DxS, and the K-ras StripAssay for detecting KRAS mutations in non small cell lung carcinomas. J Exp Clin Cancer Res 31: 79. doi:10. 1186/1756-9966-31-79PMID:22995035
29. Krol LC, Hart NA, Methorst N, Knol AJ, Prinsen C, et al. (2012) Concordance in KRAS and BRAF muta-tions in endoscopic biopsy samples and resection specimens of colorectal adenocarcinoma. Eur J Can-cer 48: 1108–1115. doi:10.1016/j.ejca.2012.02.054PMID:22446020
30. Young EC, Owens MM, Adebiyi I, Bedenham T, Butler R, et al. (2013) A comparison of methods for EGFR mutation testing in non-small cell lung cancer. Diagn Mol Pathol 22: 190–195. doi:10.1097/ PDM.0b013e318294936cPMID:24193010
31. Gasch C, Bauernhofer T, Pichler M, Langer-Freitag S, Reeh M, et al. (2013) Heterogeneity of epidermal growth factor receptor status and mutations of KRAS/PIK3CA in circulating tumor cells of patients with colorectal cancer. Clin Chem 59: 252–260. doi:10.1373/clinchem.2012.188557PMID:23136247
32. Andreyev HJ, Norman AR, Cunningham D, Oates JR, Clarke PA (1998) Kirsten ras mutations in pa-tients with colorectal cancer: the multicenter“RASCAL”study. J Natl Cancer Inst 90: 675–684. doi:10. 1093/jnci/90.9.675PMID:9586664
33. Lievre A, Bachet JB, Le Corre D, Boige V, Landi B, et al. (2006) KRAS mutation status is predictive of response to cetuximab therapy in colorectal cancer. Cancer Res 66: 3992–3995. doi: 10.1158/0008-5472.CAN-06-0191PMID:16618717
34. Tsiatis AC, Norris-Kirby A, Rich RG, Hafez MJ, Gocke CD, et al. (2010) Comparison of Sanger se-quencing, pyrosese-quencing, and melting curve analysis for the detection of KRAS mutations: diagnostic and clinical implications. J Mol Diagn 12: 425–432. doi:10.2353/jmoldx.2010.090188PMID:20431034
35. Macedo MP, Andrade Lde B, Coudry R, Crespo R, Gomes M, et al. (2011) Multiple mutations in the Kras gene in colorectal cancer: review of the literature with two case reports. Int J Colorectal Dis 26: 1241–1248. doi:10.1007/s00384-011-1238-0PMID:21603900
36. Woo J, Palmisiano N, Tester W, Leighton JC Jr. (2013) Controversies in antiepidermal growth factor re-ceptor therapy in metastatic colorectal cancer. Cancer 119: 1941–1950. doi:10.1002/cncr.27994
PMID:23504768
37. De Roock W, Claes B, Bernasconi D, De Schutter J, Biesmans B, et al. (2010) Effects of KRAS, BRAF, NRAS, and PIK3CA mutations on the efficacy of cetuximab plus chemotherapy in chemotherapy-refractory metastatic colorectal cancer: a retrospective consortium analysis. Lancet Oncol 11: 753–762. doi:10.1016/S1470-2045(10)70130-3PMID:20619739