Investigating Automatic Alignment Methods for Slide Generation from
Academic Papers
Brandon Beamer and Roxana Girju
Department of Linguistics University of Illinois
Urbana, IL
{bbeamer,girju}@illinos.edu
Abstract
In this paper we investigate the task of auto-matic generation of slide presentations from academic papers, focusing initially on slide to paper alignment. We compare and eval-uate four different alignment systems which utilize various combinations of methods used widely in other alignment and question an-swering approaches, such as TF-IDF term weighting and query expansion. Our best aligner achieves an accuracy of 75% and our findings show that for this application, av-erage TF-IDF scoring performs more poorly than a simpler method based on the number of matched terms, and query expansion degrades aligner performance.
1 Introduction
Automatic generation of slide presentations is a task the Computational Linguistics community has not yet pursued in much depth. A robust system capable of generating slide presentations from papers would save the author much tedium when organizing her presentations. In this paper we investigate this task from a novel perspective. While others have devel-oped interesting approaches to slide generation from documents by modeling the problem in a unique way (Utiyama and Hasida, 1999; Shibata and Kuro-hashi, 2005), the aim of the research this paper initi-ates is to discover how humans create slide presen-tations, focusing more specifically on academic pa-pers. Thus we take a corpus-based approach to the problem, and as a first step focus on the task of au-tomatically aligning slide presentations to academic papers.
We built a corpus of 296 slide-paper pairs and im-plemented four slide to paper aligners which utilize popular information retrieval methods such as TF-IDF term weighting and query expansion. In this paper we show that, in this application, TF-IDF term weighting is inferior to a simpler scoring mecha-nism based only on the number of matched terms and query expansion degrades aligner performance. Our best aligner achieves an accuracy of 75%.
2 Related Work
Automatic slide generation from documents is a thus far under-investigated topic. Utiyama and Hasida (1999) generate slides from GDA1(global document
annotation) tagged documents. They detect topics within the documents by analyzing GDA corefer-ence links, modeled each slide as a topic and item-ized elaborations (which were also tagged with the GDA tag set). Shibata and Kurohashi (2005) convert Japanese documents to slide representation by pars-ing their discourse structures and representpars-ing the resulting tree in an outline format. While (Utiyama and Hasida, 1999) and (Shibata and Kurohashi, 2005) generate slides from documents by modeling the task in creative ways, we aim to learn something deeper regarding how humans actually go about the task. Creating a corpus of slide/paper pairs will en-able us to study the intricacies involved in how real humans approach this task.
Our current focus is slide to paper (region) ment, which can be categorized best as align-ment between monolingual comparable corpora, but
1The GDA tag set is designed to allow machines to auto-matically infer the underlying structure of documents. More information is available athttp://i-content.org/gda.
could also be easily construed as document passage retrieval, which is a well-researched topic in the In-formation Retrieval community. Barzilay and El-hadad (2003) incorporate context to facilitate align-ment between monolingual comparable corpora by first learning paragraph matching rules in a super-vised way, and then refining the alignment at the sen-tence level within paragraphs. Nelken and Shieber (2008) used TF-IDF term weighting with logistic regression to align sentences from pericopes in the gospels of the new testament. Callan (1994) ana-lyzed various ways to define document passages and identified three main passage types, discourse (based on physical structure of the document), semantic (based on topic boundaries), and window (based on token distance) and suggests that while discourse passages may be an attractive way to define and re-trieve document passages, due to reasons related to sloppy writing, visual aids, or other factors, para-graph boundaries may not be the best indicators of content boundaries. Our alignment task differs from that of (Barzilay and Elhadad, 2003) and (Nelken and Shieber, 2008) in two ways. First, Barzilay and Elhadad (2003) and Nelken and Shieber (2008) align like-chunks between the two documents. That is, they are either aligning sentences to sentences or paragraphs to paragraphs. In our task we are align-ing slide regions which are usually bullets spannalign-ing at most a couple lines, to paper regions which can be a whole paragraph long. Second, Barzilay and Elhadad (2003) and (Nelken and Shieber, 2008) are working with comparable corpora in which the same information is assumed to be present in each docu-ment, but expressed in a different way. We are not able to necessarily make this assumption, in fact we show in this paper that as much as half of the infor-mation in slide presentations may not be present in the corresponding paper.
The concept of query expansion that we im-plement in some of our aligners is also not new. Voorhees (1994) suggests that query expansion tends to help performance with short, incomplete queries but degrades performance with longer, more complete queries. van der Plas and Tiedemann (2008) investigated several types of lexico-semantic information for query expansion in their question answering system. They found that expansions that bridge the terminology gap (synonyms, etc.) did not
result in improvement but expansions that bridge the knowledge gap (words belonging to the same subject field) did. In this paper, to get an idea of the base-line performance of query expansion with regard to our unique task, we implement a more rudimentary form of query expansion which only expands syn-onyms of terms. Since our slide regions don’t vary much in length, it’s hard to say how our results relate to the findings of Voorhees (1994). Our results par-tially support (van der Plas and Tiedemann, 2008) in that our implementation only bridges the terminol-ogy gap, and isn’t very successful.
3 The Corpus
The first step to understanding how humans generate slides from papers is to collect real-world examples of academic papers and corresponding slide presen-tations. To build our corpus, we searched the in-ternet for web pages containing workshop proceed-ings from various fields using generic queries such as ‘workshop slide paper’. The collected papers and presentations come from a variety of fields but tend to be focused generally on science and technology. Workshop proceedings are an ideal source for our data because they often provide the papers and slide presentations side-by-side. Using this strategy, we manually extracted 296 slide-paper pairs. The pa-pers were downloaded in PDF format and the slides were a mixture of PDF and Powerpoint formats. Be-fore working with these files, we converted them to a custom XML format which represents relevant parts of the original data as logical regions. In the case of slides, regions include bullets, headings, and other text spans. In the case of papers,regionsinclude re-gions (or passages) which correspond to paragraphs, section headings, and list items.
de-scribe them in terms of where new topics are intro-duced and where old ones are no longer discussed. We prefer using orthographic boundaries in our ap-proach for two reasons. First, detecting orthographic boundaries can be accomplished with simple heuris-tics while topic boundary detection requires more sophisticated methods2, thus implementation is
eas-ier. Second, because orthographic boundaries are far less subjective than topic boundaries, it’s easier to verify the validity of orthographic boundaries than semantic ones.
Preprocessing Powerpoint files is significantly simpler than PDF files. To convert the Powerpoint data to our custom XML, we first convert the Pow-erpoint file to an OpenOffice.org3 ODP file via the
document converter tool that comes standard with OpenOffice. ODP files are already encoded with a rich XML which already describes physical regions such as list items, bullets, and other text, so region identification is unnecessary. We only needed to im-plement a filter that translates the available data to the custom XML format.
4 Alignment Methods
Discovering how humans generate slide presenta-tions from papers starts with observing where slide regions originate from. We make the general as-sumption that a slide region either a) is a summa-rization (excerpt or abstract) from the associated pa-per, or b) comes from other sources including but not limited to the author’s personal (world and/or specific) knowledge. A complete alignment module would thus need to be able to discern if the informa-tion in a region comes from the target paper or if it does not. When it does, the task of the aligner is then to choose the region in the paper that is summarized or from which the excerpt is taken. Our original hy-pothesis was that the vast majority of the data in a given slide presentation would come from the target paper and concluded that a reasonable first attempt at building an aligner could be made under this as-sumption.
We approach the task of aligning slide regions to paper regions with methods popular in information
2Reynar (1998) provides a detailed overview of the basic topic detection and segmentation methods
3OpenOffice.org is a freely available office suite available at
http://www.openoffice.org.
Aligner Scoring Query Expansion A Method 1 No
[image:3.612.352.501.53.104.2]B Method 1 Yes C Method 2 No D Method 2 Yes
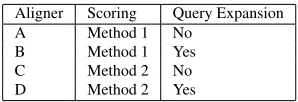
Table 1:Features implemented by each aligner.
retrieval. When aligning a slide region to a paper region, we treat the slide region as a search query and the target regions as documents in the informa-tion retrieval sense. We compare two TF-IDF based scoring methods and the effect of query expansion by building four different aligners, each of which corresponds to one combination of scoring type and usage of query expansion. Table 1 shows a diagram indicating which aligners have which features.
To prepare both the slide region and paper for alignment, certain preprocessing tasks are executed by all our aligners. The general procedure all our aligners follow is outlined below:
1. For each token in each region in the paper, the to-ken’s TF-IDF score is calculated, where the toto-ken’s term frequency is the frequency of the token’s stem in the region and the term’s document frequency is the number of regions containing the token’s stem. 2. The slide region is tokenized and part-of-speech
tagged with the SNoW tagger (Roth, 1998) and non-content words are removed. We consider non-content words to be any token which is either a noun, adjec-tive, verb, adverb, or cardinal number.
3. Each token in the slide region is stemmed and, in the case of aligners B and D, query expansion is performed.
4. A score is calculated for each region in the target pa-per according to the scoring function implemented by the aligner–method 1 for aligners A and B and method 2 for aligners C and D.
These methods are presented in detail below.
4.1 Scoring Methods
target region with the highest average score wins. Scoring method 2 is implemented by aligners C and D and is based on the quantity of matched terms, re-verting to scoring method 1 only in the case of a tie. Thus, to calculate the score for a slide region rela-tive to a target paper region with method 2, the num-ber of search terms with non-zero TF-IDF scores for the paper region is counted and the region with the largest number of such search terms wins. In the case of a tie, the average score is calculated as it is in method 1 and the region with the highest average score wins the tie.
With either scoring method, a zero score results in the system predicting that the slide region is not derived from any paper region.
4.2 Query Expansion
One common problem with rudimentary TF-IDF based information retrieval systems is that match-ing tokens must have a form identical to the search terms. Hence, synonyms and other semantically-related words that probably should match do not. Query expansion is one way to consider terms which are semantically near, but orthographically differ-ent from the search terms. The general principle of query expansion is that, via an external knowledge base, semantic neighbors of search terms are added to the search query before the score is calculated.
Our implementation of query expansion is utilized by aligners B and D and uses Wordnet (Fellbaum, 1998) to extract synonyms of search terms. When a slide region undergoes query expansion our aligner executes the following steps:
1. The search terms are part-of-speech tagged using the SNoW part-of-speech tagger (Roth, 1998) and lemmatized with a morphological analyzer4.
2. The resulting lemmas and parts of speech are used to query Wordnet for matching synsets.
3. Synonyms for all retrieved synsets are recorded. 4. When scoring occurs, the TF-IDF score of a search
term changes from the score of the stem to the maxi-mum score among the stem and all its synonyms. In the case of scoring method 2, a search term matches if it stem is found in the target region or if any of its synonyms’ stems are found.
4The morphological analyzer we use is called
mor-pha and is freely available and can be downloaded at http://www.informatics.susx.ac.uk/research/groups/nlp/carroll /morph.html
5 Evaluation
To evaluate our aligners, we manually checked the alignment of each on four randomly chosen slide presentation-paper pairs. We refer to these presen-tations here as P1, P2, P3, and P4. Collectively, these four presentations with their respective papers amount to 587 alignment decisions which were eval-uated according to the following guidelines. If the slide region is either an excerpt from the chosen pa-per region or if the slide region is an abstract of the chosen paper region, the alignment is judged as good. In cases where the matching excerpt or ab-stract text spans more than one paper region, the alignment is judged as good if the aligner selected any of the involved regions. Otherwise, the align-ment is judged as bad and an error code is recorded. The three error codes we utilize areBR,NR, andER.
BRis short for “better region” and indicates that the alignment is bad because the chosen paper region is not the paper region from which the slide region is extracted or generated, but such a region does in-deed exist. NR is short for “no region” and indi-cates that the alignment is bad because there is no region in the paper to which the slide region should be aligned. ERis short for “existing region” and in-dicates that the alignment is bad because the aligner decided there was no paper region to which the slide region should be aligned, but in fact there was. Also, the type of each slide region was recorded as either
frontmatter(which covers text spans such as titles, authors, dates, and addresses),outline,heading, bul-let, ordiagram. Table 2 illustrates the composition of the four presentations insofar as slide region type is concerned.
The distribution of slide region types is not sur-prising. Table 2 shows that two of our presentations included diagrams and the other two did not, and that bullets not surprisingly account for more slide regions than any other region type.
5.1 Alignability of Slide Regions
Presentation Frontmatter Outline Heading Bullet Diagram P1 3/174 (1.7%) 0/174 (0.0%) 5/174 (2.9%) 74/174 (42.5%) 92/174 (52.9%) P2 9/181 (5.0%) 9/181 (5.0%) 34/181 (18.8%) 129/181 (71.3%) 0/181 (0.0%) P3 5/114 (4.4%) 1/114 (0.9%) 52/114 (45.6%) 55/114 (48.2%) 0/114 (0.0%) P4 5/118 (4.2%) 1/118 (0.8%) 13/118 (11.0%) 47/118 (39.8%) 52/118 (44.0%) Total 22/587 (3.7%) 11/587 (1.9%) 104/587 (17.7%) 305/587 (52.0%) 144/587 (24.5%)
Table 2:Breakdown of slide text spans by type. Columns correspond to slide text span types. Percentages in each column measure the fraction of text spans which are of the given type.
from the associated paper, and not from the author’s knowledge.
Another important observation from the data in table 3 is that the fraction of slide regions which are alignable for any given presentation can vary wildly. 82% of P4’s regions were alignable while 60% of P3’s and only 14% of P1’s regions were alignable.
5.2 Aligner Accuracy
Tables 4 and 5 show theraw accuracyandalignable accuracy of the four aligners respectively. Raw accuracy is the number of slide regions correctly aligned out of the total number of slide regions. Alignable accuracy is the percentage of alignable slide regions which were aligned correctly.
Given the surprising results that a large percent-age of slide regions need not come from the paper, any fully fledged slide to paper aligner would need a module which first filters out the unalignable slide regions. Because such a module is not implemented in our aligners, as our aligners make the assumption that each slide region has a corresponding paper re-gion, we limit most of our accuracy evaluation to
alignableaccuracy rather than raw accuracy. From tables 4 and 5 we can easily see the im-portance of such a filtering module. As our best aligner, which achieves an average alignable accu-racy of 75%, only achieves an average raw accuaccu-racy of 50%.
5.3 Error Analysis
Tables 6 and 7 show what percentage of an aligner’s errors correspond to which error types. Because our aligners are based on term matching, the only way for them to predict no alignment is for the average TF-IDF score of the terms to be zero (no matching terms anywhere). Because this is a very rare event, ER-type errors are also extremely rare, and are ex-cluded from our error analysis.
We can see from tables 6 and 7 that our poorer aligners (A and B) have a fairly even split between BR-type and NR-type errors, while our better align-ers (C and D) have a far greater percentage of NR-type errors, indicating that the features we are in-vestigating can only reduce BR-type errors. This verifies the importance of the proposed alignability module which first filters out unalignable slide re-gions.
5.4 Error Reduction
Tables 8 and 9 analyze how well query expansion and scoring method 2 reduce errors by measuring the percentage of errors made by one aligner, which were not made by another. Four pairings of align-ers are considered: A and B, A and C, B and D, and C and D. By comparing aligner A to B and C to D, we have one measure of the error reduction achieved by adding query expansion to an aligner. If the ad-dition of query expansion enables an aligner to cor-rectly align slide regions which its query expansion-less counterpart could not, then we should see large percentages of errors being corrected when compar-ing aligner A to B and C to D. By comparcompar-ing aligner A to C and B to D, we have a measure of the error reduction achieved by implementing scoring method 2 instead of method 1.
Tables 8 and 9 show that aligner D significantly reduced aligner B’s errors and aligner C significantly reduced aligner A’s errors, but aligner B did not im-prove much on A, nor did D on C. In other words, adding query expansion did not significantly reduce errors, but using scoring method 2 instead of 1 did.
6 Discussion 6.1 On Alignability
ta-Presentation Frontmatter Outline Heading Bullet Diagram Overall P1 3/3 (100.0%) 0/0 0/5 (0.0%) 21/74 (28.4%) 0/92 (0.0%) 24/174 (13.8%) P2 9/9 (100.0%) 8/9 (88.9%) 24/34 (70.6%) 104/129 (80.6%) 0/0 145/181 (80.1%) P3 5/5 (100.0%) 0/1 (0.0%) 48/52 (92.3%) 15/55 (27.3%) 0/0 68/114 (59.5%) P4 4/5 (80.0%) 0/1 (0.0%) 11/13 (74.6%) 33/47 (70.2%) 49/52 (94.2%) 97/118 (82.2%) Total 21/22 (95.5%) 8/11 (72.7%) 83/104 (79.8%) 173/305 (56.7%) 49/144 (34.0%) 334/587 (56.9%)
Table 3:Breakdown of alignable slide text spans by type. Columns correspond to slide text span types. Percentages in each column measure the fraction of text spans of that type which are alignable. E.g. of the 129 bullets in presentation P2, 104 are alignable. The “Overall” column measures the fraction of all text spans which are alignable. E.g. of the 181 text spans in presentation P2, 145 are alignable.
[image:6.612.146.467.196.256.2]Presentation Aligner A Aligner B Aligner C Aligner D P1 34/174 (19.5%) 129/174 (16.7%) 37/174 (21.3%) 35/174 (20.1%) P2 71/181 (39.2%) 64/181 (35.4%) 101/181 (55.8%) 97/181 (53.6%) P3 66/114 (57.9%) 64/114 (56.1%) 77/114 (67.5%) 77/114 (67.5%) P4 50/118 (42.4%) 48/118 (40.7%) 78/118 (66.1%) 77/118 (65.3%) Total 221/587 (37.6%) 205/587 (34.9%) 293/587 (49.9%) 286/587 (48.7%)
Table 4: Raw accuracy. Each column corresponds to one of the four aligners evaluated. Percentages measure the fraction of text spans which were aligned correctly.
[image:6.612.149.466.316.379.2]Presentation Aligner A Aligner B Aligner C Aligner D P1 12/24 (50.0%) 9/24 (37.5%) 15/24 (62.5%) 15/24 (62.5%) P2 63/145 (43.4%) 56/145 (38.6%) 93/145 (64.1%) 90/145 (62.1%) P3 55/68 (80.9%) 54/68 (79.4%) 66/68 (97.1%) 67/68 (98.5%) P4 49/97 (50.5%) 47/97 (48.5%) 77/97 (79.4%) 76/97 (78.4%) Total 179/334 (53.6%) 166/334 (49.7%) 251/334 (75.1%) 248/334 (74.3%)
Table 5:Alignable accuracy. Each column corresponds to one of the four aligners evaluated. Percentages measure the fraction of alignable text spans which were aligned correctly.
Aligner A Aligner B
Presentation BR NR BR NR
P1 11/140 (7.9%) 128/140 (91.4%) 14/145 (9.7%) 130/145 (89.7%) P2 82/110 (74.5%) 28/110 (25.5%) 89/117 (76.1%) 28/117 (23.9%) P3 13/48 (27.1%) 35/48 (72.9%) 14/50 (28.0%) 36/50 (72.0%) P4 48/68 (70.6%) 20/68 (29.4%) 50/70 (71.4%) 20/70 (28.6%) Total 154/366 (42.1%) 211/366 (57.7%) 167/382 (43.7%) 214/382 (56.0%)
Table 6:Error type breakdown for aligners A and B. Columns correspond to specific types of alignment errors. “BR” is short for “better region” and “NR” is short for “no region”. An error of type “BR” means that the aligner choose an incorrect region in the paper, and a better region existed. An error of type “NR” means the aligner choose an incorrect region, and there was no correct region.
Aligner C Aligner D
Presentation BR NR BR NR
P1 8/137 (5.8%) 128/137 (93.4%) 8/139 (5.8%) 130/139 (93.5%) P2 52/80 (65.0%) 28/80 (35.0%) 55/84 (65.5%) 29/84 (34.5%) P3 2/37 (5.4%) 35/37 (94.6%) 1/37 (2.7%) 36/37 (97.3%) P4 20/40 (50.0%) 20/40 (50.0%) 21/41 (51.2%) 20/41 (48.8%) Total 82/294 (27.9%) 211/294 (71.8%) 85/301 (28.2%) 215/301 (71.4%)
[image:6.612.146.466.438.509.2] [image:6.612.152.461.580.650.2]Aligner A→B Aligner A→C
Presentation BR NR Overall BR NR Overall
[image:7.612.110.505.53.124.2]P1 0/11 (0.0%) 0/128 (0.0%) 0/140 (0.0%) 4/11 (36.4%) 0/128 (0.0%) 4/140 (2.9%) P2 0/82 (0.0%) 0/28 (0.0%) 0/110 (0.0%) 38/82 (46.3%) 0/28 (0.0%) 38/110 (34.5%) P3 0/13 (0.0%) 0/35 (0.0%) 0/48 (0.0%) 11/13 (84.6%) 0/35 (0.0%) 11/48 (22.9%) P4 0/48 (0.0%) 0/20 (0.0%) 0/68 (0.0%) 31/48 (64.6%) 0/20 (0.0%) 31/68 (45.6%) Total 0/154 (0.0%) 0/211 (0.0%) 0/366 (0.0%) 84/154 (54.5%) 0/211 (0.0%) 84/366 (23.0%)
Table 8:Error reduction between aligners A and B, and between aligners A and C. Major columns correspond to aligner pairs and minor columns correspond to error types. A pair denoted byX →Y indicates that the corresponding percentages are measuring the fraction of slide text spans aligned incorrectly by alignerX, which were aligned correctly by alignerY. E.g. from this table you can see that in presentation P1, aligner A incorrectly aligned 140 text spans. 11 of them were BR-type errors and 128 of them were NR-type errors. Four of aligner A’s BR-type errors were aligned correctly by aligner C.
Aligner B→D Aligner C→D
Presentation BR NR Overall BR NR Overall
[image:7.612.113.502.196.266.2]P1 7/14 (50.0%) 0/130 (0.0%) 7/145 (4.8%) 0/8 (0.0%) 0/128 (0.0%) 0/137 (0.0%) P2 42/89 (47.2%) 0/28 (0.0%) 42/117 (35.9%) 1/52 (1.9%) 0/28 (0.0%) 1/80 (1.2%) P3 13/14 (92.9%) 0/36 (0.0%) 13/50 (26.0%) 1/2 (50.0%) 0/35 (0.0%) 1/37 (2.7%) P4 32/50 (64.0%) 0/20 (0.0%) 32/70 (45.7%) 1/20 (5.0%) 0/20 (0.0%) 1/40 (2.5%) Total 94/167 (56.3%) 0/214 (0.0%) 94/382 (24.6%) 3/82 (3.7%) 0/211 (0.0%) 3/294 (1.0%)
Table 9:Error reduction between aligners B and D, and between aligners C and D. Major columns correspond to aligner pairs and minor columns correspond to error types. A pair denoted byX →Y indicates that the corresponding percentages are measuring the fraction of slide text spans aligned incorrectly by alignerX, which were aligned correctly by alignerY. E.g. from this table you can see that in presentation P1, aligner B incorrectly aligned 145 text spans. 14 of them were BR-type errors and 130 of them were NR-type errors. 7 of aligners B’s BR-type errors were correctly aligned by aligner D.
ble 3 shows that 28% of P1’s bullets were alignable, while 81% of P2’s were alignable. P1 and P4 both contained diagrams, but only P4’s diagram existed in the paper. Our initial hypothesis was that the vast majority of slide regions would either be excerpts or abstracts from/of the paper regions. Table 3 shows that a nontrivial amount of slide regions does not map to the paper at all. Also, tables 6 and 7 show that as a result, NR-type errors make up the majority of the errors made by the better aligners. Thus, the data indicates that the task of slide-presentation gen-eration is highly dependent on the end purpose the presentation will serve, as well as the target audience and other factors. We will focus more on identify-ing these factors in future research. Once identified, these factors should be quantified and controlled in future corpora of presentation-paper pairs used for this task.
6.2 On Scoring Methods and Query Expansion
Our results clearly show that, for this task, query expansion has little or negative impact on aligners and that scoring method 2 is indeed superior to scor-ing method 1. Tables 4 and 5 show that aligner C consistently outperforms aligner A and aligner D consistently outperforms aligner B, especially when
limited to alignable slide regions. Hence, scoring method 2 is better than method 1. We can also see from tables 4 and 5 that aligner B consistently performs A and aligner D consistently under-performs C, which shows that query expansion does not improve performance and in fact, it degrades it. Tables 8 and 9 show the same results from a differ-ent perspective: aligner C correctly aligned 55% of the aligner A’s erroneous alignable slide regions and aligner D correctly aligned 56% of aligner B’s erro-neous alignable slide regions. But aligner B did not catch any of aligner A’s errors and aligner D only caught 4% of aligner C’s errors – but ended up mak-ing more in the end anyway.
on average than aligner A, and likewise with aligner D when compared to C. Synonyms are semanti-cally closer to the original term than hypernyms, hyponyms, or other semantically related terms, and our results show that introducing this small amount of semantic distance is (a little bit) detrimental. By adding hypernyms and other relations, only a wider, less focused group of terms will be introduced which will probably just result in more false positives.
One possible criticism against our argument for (a) could be that our implementation of query expan-sion performed poorly because we don’t word sense disambiguate, and thus we introduce synonyms from incorrect senses of each term. This probably isn’t the case because the search terms are not in isolation, but are part of a larger query. For an incorrect paper region to be select based on an error of this type, it would have to contain many of the terms in the query as well as the semantically inaccurate sense of the one in question. This situation is unlikely due to one of the most basic assumptions made when sense disambiguating: that context restricts the possible senses of any word. So, if a paper region contains many of the terms in a slide region, it is unlikely that it will also contain the off-topic, semantically awkward term pertaining to a bad sense of one of them.
With regard to scoring methods. Average TF-IDF scoring is probably ineffective in this application be-cause of the nature of paper regions. When retriev-ing whole documents given a search query, one doc-ument’s contents are probably independent of any other, so terms related to the document’s topic are stated explicitly. Paper regions, however, are in the context of each other. The topic of one can be very similar to another, only because it’s nearby, not be-cause of the terms explicitly mentioned in the re-gion. Add to this the fact that paper regions are ex-tremely non-uniform in length and TF-IDF scores end up skewed.
6.3 On Improvement
There is a lot of room for improvement on slide to paper alignment. As mentioned previously in section 6.1, unalignable slide regions account for a much larger portion of the slide presentations than our initial hypothesis predicted; around 70% of the errors made by our better aligners (C and D) were
NR-type errors, meaning the alignment was bad be-cause the system selected a paper region when in fact there was no correct paper region. A robust slide to paper aligner would need to have a module capable of filtering out unalignable slide regions. If this task were solved and implemented on our better aligners, raw accuracy would raise from 50% to about 75% on average which is nearing the level of robustness necessary for real-world applications.
We also suggest that, in regard to alignable slide regions, performance would be significantly boosted by taking context into account, both on the slide and paper side. We noticed during evaluation that many of the BR-type errors occurred when the slide region in question lacked the necessary terms, but the terms existed in nearby slide regions. Examples of this in-clude when for instance, the title is broken across two lines and the second line only has a word or two in it, or when a heading is rather non-descriptive but the sub-bullets beneath it contain many relevant terms to the topic. Incorporating terms of nearby slide regions (perhaps in query-expansion fashion), rather than just treating each one as an independent search query will certainly boost performance.
Likewise on the paper end, it is reasonable to as-sume that in most cases, the topic of one region is similar to the topics of adjacent regions. And just as terms from nearby slide regions could supplement term-poor slide regions, terms from nearby paper re-gions could supplement term-poor paper rere-gions.
7 Conclusion
References
Regina Barzilay and Noemie Elhadad. 2003. Sen-tence alignment for monolingual comparable corpora. In Proceedings of the 2003 Conference on Empirical Methods in Natural Language Processing (EMNLP). James P. Callan. 1994. Passage-level evidence in
docu-ment retrieval. InProceedings of the 17th Annual In-ternational ACM SIGIR Conference on Research and Development in Information Retrieval.
Christiane Fellbaum. 1998. WordNet - An Electronic Lexical Database. Cambridge MA: MIT Press. Rani Nelken and Stuart M. Shieber. 2008. Towards
ro-bust context-sensitive sentence alignment for monolin-gua corpora. InProceedings of the 11th Conference of the European Chapter of the Association for Compu-tational Linguistics.
Jeffrey C. Reynar. 1998. Topic Segmentation: Algo-rithms and Applications. Ph.D. thesis, University of Pennsylvania.
Dan Roth. 1998. Learning to resolve natural lanuage ambiguities: A unified approach. In Proceedings of the 15th Conference of the American Association for Artificial Intelligence (AAAI).
Tomohide Shibata and Sadao Kurohashi. 2005. Au-tomatic slide generation based on discourse structure analysis. In Proceedings of the second international joint conference on natural language processing (IJC-NLP).
Masao Utiyama and Koiti Hasida. 1999. Automatic slide presentation from semantically annotated documents. In Proceedings of the workshop held in conjunction with the 37th annual meeting of the Association for Computational Linguistics (ACL).
Lonneke van der Plas and J¨org Tiedemann. 2008. Us-ing lexico-semantic information for query expansion in passage retrieval for question answering. In Pro-ceedings of the 9th SIGdial Workshop on Discourse and Dialogue.