organic papers
Acta Cryst.(2006). E62, o715–o716 doi:10.1107/S1600536806001978 Zhanget al. C
7H6ClNO
o715
Acta Crystallographica Section E Structure Reports Online
ISSN 1600-5368
(
E
)-2-Chlorobenzaldehyde oxime
Da-Tong Zhang, Fang-Gang Sun, Gui-Yun Duan and
Jian-Wu Wang*
School of Chemistry and Chemical Engineering, Shandong University, Jinan 250100, People’s Republic of China
Correspondence e-mail: [email protected]
Key indicators
Single-crystal X-ray study
T= 298 K
Mean(C–C) = 0.003 A˚
Rfactor = 0.046
wRfactor = 0.105
Data-to-parameter ratio = 13.8
For details of how these key indicators were automatically derived from the article, see http://journals.iucr.org/e.
Received 4 January 2006 Accepted 17 January 2006
#2006 International Union of Crystallography
All rights reserved
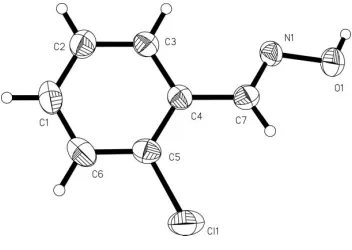
In the title compound, C7H6ClNO, which exists as the E
isomer, the crystal packing is stabilized by intermolecular O— H N and C—H O hydrogen bonds.
Comment
2-Chlorobenzaldehyde oxime, (I), is an important inter-mediate for organic synthesis (Xu & Jin, 1999), existing in two isomeric forms, viz. Z andE (Sharghi & Sarvari, 2001). We report here the crystal structure of (I) (Fig. 1), which is theE
isomer.
In (I), the bond lengths and angles (Table 1) are in agree-ment with values reported previously (Jerslev, 1983; Jensen, 1970). Atoms N1 and O1 deviate from the mean plane of C1– C7/Cl1 by 0.278 (2) and 0.279 (3) A˚ , respectively. O—H N hydrogen bonds (Table 2) link the molecules into centro-symmetric dimers. The crystal packing (Fig. 2) is further stabilized by weak intermolecular C—H O interactions (Table 2).
Experimental
The title compound was synthesized by the reaction of 2-chloro-benzaldehyde (0.01 mol) with hydroxylamine hydrochloride (0.01 mol) in the presence of sodium carbonate (0.01 mol) in an aqueous methanol solution (20 ml) at room temperature (3 h). After diluting with water, the aqueous solution was extracted with dichloromethane and the organic phase was evaporated to afford the title product in 90% isolated yield (1.41 g). Crystals suitable for X-ray diffraction analysis were obtained by slow evaporation of a solution in a hexane/dichloromethane mixture (1:1v/v) at room temperature over a period of one week.
Crystal data
C7H6ClNO
Mr= 155.58
Monoclinic,P21=c
a= 3.9231 (19) A˚ b= 14.160 (7) A˚ c= 12.895 (6) A˚
= 93.544 (7)
V= 715.0 (6) A˚3
Z= 4
Dx= 1.445 Mg m
3 MoKradiation Cell parameters from 2273
reflections
= 2.3–26.3
= 0.46 mm1
Data collection
Bruker SMART CCD area-detector diffractometer
’and!scans
Absorption correction: multi-scan (SADABS; Sheldrick, 1996) Tmin= 0.871,Tmax= 0.918 3621 measured reflections
1257 independent reflections 1146 reflections withI> 2(I) Rint= 0.019
max= 25.0
h=4!4 k=16!16 l=12!15
Refinement
Refinement onF2 R[F2> 2(F2)] = 0.046
wR(F2) = 0.105 S= 1.13 1257 reflections 91 parameters
H-atom parameters constrained
w= 1/[2
(Fo2) + (0.0374P)2 + 0.4106P]
whereP= (Fo2+ 2Fc2)/3 (/)max< 0.001
max= 0.26 e A˚
3
min=0.21 e A˚
3
Table 1
Selected geometric parameters (A˚ ,).
Cl1—C5 1.744 (2) O1—N1 1.402 (2)
N1—C7 1.266 (3)
[image:2.610.80.256.73.198.2]C7—N1—O1 111.71 (19) N1—C7—C4 120.6 (2)
Table 2
Hydrogen-bond geometry (A˚ ,).
D—H A D—H H A D A D—H A O1—H1A N1i
0.82 2.14 2.855 (3) 146 C6—H6A O1ii
0.93 2.55 3.451 (3) 162
Symmetry codes: (i)x1;yþ2;z; (ii)xþ1;yþ3 2;zþ
1 2.
All H atoms were placed in calculated positions, with C—H = 0.93 A˚ and O—H = 0.82 A˚, and included in the final cycles of refinement using a riding model, withUiso(H) = 1.2Ueq(C) for the C-bound H atoms and 1.5Ueq(O) for the hydroxyl H atom.
Data collection:SMART(Bruker, 1998); cell refinement:SAINT
(Bruker, 1999); data reduction:SAINT; program(s) used to solve structure:SHELXS97(Sheldrick, 1997); program(s) used to refine structure: SHELXL97 (Sheldrick, 1997); molecular graphics:
SHELXTL (Bruker, 1999); software used to prepare material for publication:SHELXTL.
References
Bruker (1998).SMART. Bruker AXS Inc., Madison, Wisconsin, USA. Bruker (1999). SAINT and SHELXTL. Bruker AXS Inc., Madison,
Wisconsin, USA.
Jensen, K. G. (1970).Acta Chem. Scand.24, 3293–3330. Jerslev, B. (1983).Acta Cryst.C39, 1447–1454. Sharghi, H. & Sarvari, M. H. (2001).Synlett,1, 99–101.
Sheldrick, G. M. (1996).SADABS. University of Go¨ttingen, Germany. Sheldrick, G. M. (1997). SHELXS97 and SHELXL97. University of
Go¨ttingen, Germany.
Xu, J. & Jin, S. (1999).Acta Cryst.C55, 1579–1581.
Figure 2
A perspective view of the packing along thecaxis. Hydrogen bonds are indicated by dashed lines.
Figure 1
[image:2.610.45.296.251.426.2]supporting information
sup-1 Acta Cryst. (2006). E62, o715–o716
supporting information
Acta Cryst. (2006). E62, o715–o716 [https://doi.org/10.1107/S1600536806001978]
(
E
)-2-Chlorobenzaldehyde oxime
Da-Tong Zhang, Fang-Gang Sun, Gui-Yun Duan and Jian-Wu Wang
(E)-2-Chlorobenzaldehyde oxime
Crystal data
C7H6ClNO Mr = 155.58 Monoclinic, P21/c
Hall symbol: -P 2yb c
a = 3.9231 (19) Å
b = 14.160 (7) Å
c = 12.895 (6) Å
β = 93.544 (7)°
V = 715.0 (6) Å3
Z = 4
F(000) = 320
Dx = 1.445 Mg m−3
Mo Kα radiation, λ = 0.71073 Å
Cell parameters from 2273 reflections
θ = 2.3–26.3°
µ = 0.46 mm−1
T = 298 K
Block, colourless 0.37 × 0.26 × 0.17 mm
Data collection
Bruker SMART CCD area-detector diffractometer
Radiation source: fine-focus sealed tube Graphite monochromator
φ and ω scans
Absorption correction: multi-scan (SADABS; Sheldrick, 1996) Tmin = 0.871, Tmax = 0.918
3621 measured reflections 1257 independent reflections 1146 reflections with I > 2σ(I) Rint = 0.019
θmax = 25.0°, θmin = 2.1°
h = −4→4
k = −16→16
l = −12→15
Refinement
Refinement on F2
Least-squares matrix: full R[F2 > 2σ(F2)] = 0.046 wR(F2) = 0.105
S = 1.13
1257 reflections 91 parameters 0 restraints
Primary atom site location: structure-invariant direct methods
Secondary atom site location: difference Fourier map
Hydrogen site location: inferred from neighbouring sites
H-atom parameters constrained w = 1/[σ2(F
o2) + (0.0374P)2 + 0.4106P]
where P = (Fo2 + 2Fc2)/3
(Δ/σ)max < 0.001
Δρmax = 0.26 e Å−3
Δρmin = −0.21 e Å−3
Special details
Refinement. Refinement of F2 against ALL reflections. The weighted R-factor wR and goodness of fit S are based on F2,
conventional R-factors R are based on F, with F set to zero for negative F2. The threshold expression of F2 > σ(F2) is used
only for calculating R-factors(gt) etc. and is not relevant to the choice of reflections for refinement. R-factors based on F2
are statistically about twice as large as those based on F, and R- factors based on ALL data will be even larger.
Fractional atomic coordinates and isotropic or equivalent isotropic displacement parameters (Å2)
x y z Uiso*/Ueq
Cl1 0.3280 (2) 0.69797 (5) 0.19267 (6) 0.0669 (3)
O1 −0.3465 (5) 0.90441 (12) −0.05281 (12) 0.0579 (5)
H1A −0.4798 0.9443 −0.0775 0.087*
N1 −0.2566 (5) 0.92662 (13) 0.05125 (14) 0.0422 (5)
C1 0.3068 (7) 0.8957 (2) 0.40933 (19) 0.0556 (7)
H1C 0.3793 0.9018 0.4790 0.067*
C2 0.1481 (7) 0.97021 (19) 0.35779 (19) 0.0515 (6)
H2A 0.1167 1.0269 0.3924 0.062*
C3 0.0359 (6) 0.96106 (16) 0.25514 (18) 0.0443 (6)
H3A −0.0700 1.0121 0.2211 0.053*
C4 0.0775 (5) 0.87702 (15) 0.20101 (17) 0.0376 (5)
C5 0.2457 (6) 0.80405 (16) 0.25510 (19) 0.0427 (6)
C6 0.3585 (7) 0.81237 (18) 0.3584 (2) 0.0532 (7)
H6A 0.4681 0.7621 0.3929 0.064*
C7 −0.0503 (6) 0.86684 (16) 0.09263 (18) 0.0422 (5)
H7A 0.0206 0.8160 0.0537 0.051*
Atomic displacement parameters (Å2)
U11 U22 U33 U12 U13 U23
Cl1 0.0793 (5) 0.0388 (4) 0.0816 (5) 0.0099 (3) −0.0030 (4) −0.0032 (3)
O1 0.0753 (13) 0.0551 (11) 0.0405 (9) −0.0035 (9) −0.0176 (8) −0.0033 (8)
N1 0.0485 (12) 0.0409 (10) 0.0362 (10) −0.0083 (9) −0.0063 (8) 0.0024 (8)
C1 0.0593 (16) 0.0687 (18) 0.0376 (13) −0.0030 (14) −0.0079 (12) 0.0039 (12)
C2 0.0564 (16) 0.0521 (15) 0.0458 (14) 0.0042 (12) 0.0001 (11) −0.0061 (12)
C3 0.0458 (13) 0.0415 (12) 0.0450 (13) 0.0046 (11) −0.0036 (10) 0.0021 (10)
C4 0.0358 (12) 0.0380 (12) 0.0391 (12) −0.0032 (10) 0.0016 (9) 0.0033 (9)
C5 0.0401 (13) 0.0371 (12) 0.0509 (14) −0.0019 (10) 0.0034 (10) 0.0049 (10)
C6 0.0504 (15) 0.0531 (15) 0.0549 (15) 0.0020 (12) −0.0067 (12) 0.0165 (12)
C7 0.0443 (13) 0.0380 (12) 0.0443 (13) −0.0030 (10) 0.0015 (10) −0.0011 (10)
Geometric parameters (Å, º)
Cl1—C5 1.744 (2) C2—H2A 0.9300
O1—N1 1.402 (2) C3—C4 1.394 (3)
O1—H1A 0.8200 C3—H3A 0.9300
N1—C7 1.266 (3) C4—C5 1.390 (3)
C1—C6 1.372 (4) C4—C7 1.462 (3)
C1—C2 1.375 (4) C5—C6 1.382 (4)
supporting information
sup-3 Acta Cryst. (2006). E62, o715–o716
C2—C3 1.375 (3) C7—H7A 0.9300
N1—O1—H1A 109.5 C5—C4—C7 122.0 (2)
C7—N1—O1 111.71 (19) C3—C4—C7 121.3 (2)
C6—C1—C2 120.3 (2) C6—C5—C4 122.3 (2)
C6—C1—H1C 119.9 C6—C5—Cl1 117.44 (18)
C2—C1—H1C 119.9 C4—C5—Cl1 120.28 (19)
C3—C2—C1 120.1 (2) C1—C6—C5 119.1 (2)
C3—C2—H2A 120.0 C1—C6—H6A 120.4
C1—C2—H2A 120.0 C5—C6—H6A 120.4
C2—C3—C4 121.5 (2) N1—C7—C4 120.6 (2)
C2—C3—H3A 119.3 N1—C7—H7A 119.7
C4—C3—H3A 119.3 C4—C7—H7A 119.7
C5—C4—C3 116.7 (2)
C6—C1—C2—C3 1.0 (4) C7—C4—C5—Cl1 2.9 (3)
C1—C2—C3—C4 0.3 (4) C2—C1—C6—C5 −0.7 (4)
C2—C3—C4—C5 −1.7 (3) C4—C5—C6—C1 −0.7 (4)
C2—C3—C4—C7 178.4 (2) Cl1—C5—C6—C1 178.2 (2)
C3—C4—C5—C6 1.9 (3) O1—N1—C7—C4 179.72 (19)
C7—C4—C5—C6 −178.1 (2) C5—C4—C7—N1 166.5 (2)
C3—C4—C5—Cl1 −177.04 (17) C3—C4—C7—N1 −13.5 (3)
Hydrogen-bond geometry (Å, º)
D—H···A D—H H···A D···A D—H···A
O1—H1A···N1i 0.82 2.14 2.855 (3) 146
C6—H6A···O1ii 0.93 2.55 3.451 (3) 162