Effect of Lean Meat Proportion on the Chemical
Composition of Pork
Monika OkrOuhlá, roman Stupka, Jaroslav Čítek, Michal ŠprySl,
Milan trNka and eva kluzákOVá
Department of animal husbandry, Faculty of agrobiology, Food and Natural
resources, Czech university of life Sciences in prague, prague-Suchdol, Czech republic
Abstract:
Okrouhlá M., Stupka R., Čítek J., Šprysl M., Trnka M., Kluzáková E. (2008): Effect of lean meat proportion on the chemical composition of pork. Czech J. Food Sci., 26: 464–469.
The objective of this work was to verify the effect of the lean meat proportion on the chemical composition of the meaty parts (loin and ham) of pork. A total of 116 finishing hybrid pigs commonly used in the Czech Republic were fattened for this purpose. The pigs were divided according to the lean meat proportion criterion into 3 groups, i.e. more than 60.0%, 55.0–59.9% and 50.0–54.9%. Representative muscle samples were taken from the right halves of these pigs. They were then homogenised and submitted to chemical analysis. The results of the measuring showed that the values of the water content, intramuscular fat (IMF), crude proteins, and ash matter ranged in the loin between 72.50–72.80%, 1.56–1.96%, 23.20–23.40%, and 1.37–1.40%, respectively, and in the ham between of 70.43–71.59%, 3.52–4.26%, 21.67–21.95%, and 1.42–1.56%, respectively. The ascertained values of the water content and crude pro-teins with regard to the increasing lean meat proportion in the carcasses did not show any developmental tendencies. As for the content of IMF, it was determined that the higher was the lean meat proportion, the lower was the IMF content. Concerned of sensoric quality traits it means that pork meat from supermeaty hybrid pigs shows lower qual-ity. Concerning the content of ash matter, it was observed that the ash content increased with an increasing lean meat proportion. In the carcass part of the musculus longissimus lumborum et thoracis (MLLT), it was demonstrated that the higher was the lean meat proportion, the lower was the content of amino acids – threonine, isoleucine, lysine, as-partic acid, serine, and proline. From point of the production of exceedingly meaty pigs (over 60%), it can be expected a worse nutritional pork meat value. In the carcass portion of the musculus semimembranosus (MS), the contents of valine, isoleucine, phenylalanine, lysine, serine, proline, and glycine increased with an increasing lean meat propor-tion. Within the framework of statistical evaluation of differences between the groups, the values of IMF (p ≤ 0.01) in MLLT, water content, IMF, ash matter, threonine, valine, phenylalanine, lysine, aspartic acid, serine, glycine, and alanine in MS were highly significant (p ≤ 0.05; p ≤ 0.01 and p ≤ 0.001).
Keywords: pig; meat; lean meat; chemical composition
Meat quality has assumed great significance in recent years mainly due to the importance of quan-titative and qualitative carcass value relationships. As pigs were becoming progressively leaner, more
complaints were received from the food industry claming that the quality of meat had declined (Wood 2001). The importance of the pig in the meat industry according to the lean meat
tion (lean meat percentage – LMP) was studied by Branscheid et al. (1987). Koucký et al. (1993) observed the influence of the sex (boars, barrows, and gilts) on the index of carcass value. The weight of the right half in the observed groups was 48.0, 47.8 and 45.8 kg, respectively. The percentage of lean meat was 50.04%, 44.33%, and 49.12%, respectively. In the dry matter of the meat and in the protein content no statistically significant differences between sexes were observed.
An important factor influencing the qualitative aspect of pig meat is the proportion of intramuscu-lar fat (IMF). Several studies involving consumers and trained panels revealed that IMF content is one of the important traits which influence the quality characteristics such as meat tenderness, juiciness, and taste (Verbeke et al. 1999).
The IMF content of porcine meat is the opti-mum trait with regard to the influence on the meat tenderness (Hovenier et al. 1993). An IMF content below the recommended optimum range of 2.5–3% diminishes the quality, whereas a higher IMF content will not further improve this pa-rameter and will instead have adverse effects on the consumer acceptability due to the increased visibility of fat in the meat.
Ševčíková et al. (2002) determined in gilts (LW × L) an IMF content at the level of 1.918%, water loss by drainage – 3.07%, remission – 19.67%, and pH24– 5.51. Mikule (2005) found an IMF content of 0.71% in the LW breed and 0.85% in the L breed, respectively. Oliver et al. (2003) recorded the highest IMF content in the Duroc breed – 2.89%.
A number of authors have dealt with the evaluation of the qualitative indicators depending on the lean meat proportion: Babatude et al. (1966), Fewson
et al. (1990), Bruwe et al. (1991), Bahelka et al. (2006), Correa et al. (2006), and others.
The objective of this study was to determine the influence of the attained lean meat proportion on the chemical composition of pork which influences the eating quality.
MATERIAL AND METHODS
116 slaughter pigs of a final hybrid combina-tion bred in the Czech Republic were used in the experiments which were performed at the Ploskov teststation, Lány. All of the pigs were penned pairs and divided according to sex (gilts, barrows). The pigs were placed in the experiment at an average live weight of 23.6 kg (the same age and well-bal-anced sex ratio – barrows/gilts) and at an average age of 65 to 70 days after the date of birth. Feeding was provided by means of a full feed mixture (FFM) which contained three components (wheat, barley, soybean extracted meal) and feeding premix. The pigs were slaughtered and subjected to carcass analysis after reaching an overall average live weight of 111.6 kg at the age of 168–171 days after birth. The pigs were then commercialised in a slaugh-terhouse by the SEUROP system. The lean meat proportion of the pigs was evaluated by the ZP method (Pulkrábek 2001; Pulkrábek et al. 2004) and further subjected to carcass analysis.
The right half-carcass was dissected into indi-vidual parts. Samples were taken from the musculus longissimus lumborum et thoracis (MLLT) and
musculus semimembranosus (MS). The repre-sentative ones were homogenised and subjected to chemical analyses to determine the content of water (from the difference of the sample weight before and after drying with sea sand), IMF (by gravimetric determination after extraction with petrolether), crude protein (determination of amino nitrogen according to Kjeldahl), ash (by burning the sample at 550°C until the burning of organic substances was complete) and selected amino acids (analysis of the hydrolysis product with an automatic analyzer AAA 400 and evaluation by the ChromuLan programme).
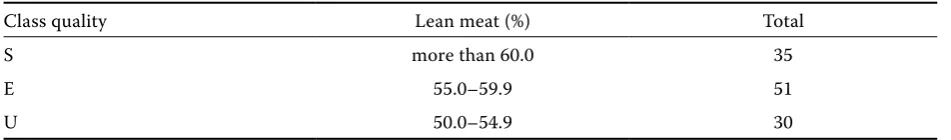
116 finishing pigs were divided into 3 groups ac-cording to their lean meat proportion (Table 1).
The test results obtained were evaluated by the statistical programme SAS® Propriety Software
[image:2.595.62.538.686.756.2]Release 6.04, formulated in tables, whereas the
Table 1. Pig frequency according to lean meat classification criteria
Class quality Lean meat (%) Total
S more than 60.0 35
E 55.0–59.9 51
differences between the individual traits were tested by the GLM procedure on the basis of mu-tual interactions between lean muscles.
The following parameters were used to evalu-ate the approprievalu-ateness of the allometric models:
yi= µ + (lM)i+ ei – analysis of a single class (lean meat).
RESULTS AND DISCUSSION
The grading criteria together with the funda-mental statistical characteristics and the results of variation analyses for the selected character-istics of the chemical composition are shown in Tables 2–3.
As is evident from Table 2, the total water content in the MLLTwas in the range of 72.50–72.80%, where the highest water content was found in the group with 55.0–59.9% of lean meat and the lowest content in the group with 60.0% or more of lean meat. From the values of IMF in the muscle MLLT it results that with the growth of lean muscle the content of IMF declined, i.e., in the group with the highest lean meat proportion the values of 1.56%, further 1.61% and 1.96%, were estimated. Matoušek et al. (1997) found the proportion of IMF content in a hybrids pig population to be 2.39%. The highest total value of crude proteins, 23.40%, was ascertained in the group with the lowest lean meat proportion. On the contrary, the lowest value of crude proteins, 23.20%, was shown in the group with 55.0–59.9% of lean meat. The content of ash matter demonstrated an evolutionary tendency when, with an increase in the muscle proportion, the ash content also increased. In the group with 50.0–54.9% of muscle, a value of 1.37% was ascer-tained; in the group with 55.0–59.9% the proportion of 1.39% was demonstrated, and in the group over 60.0% a value of 1.40% was observed.
Correa et al. (2006) determined that with the presence of 61.32%, 61.13% and 60.80% of lean meat in the carcass in the MLLT, 73.9, 73.9 and 73.8% of water, 2.05, 1.75 and 1.90% of IMF, and 23.45, 23.75, and 23.70% of proteins, respectively were measured. Naděje et al. (2000) testing pigs with an average carcass weight of 104 kg found in the MLLT 73.95% of water, 1.86% of IMF and 26.05% of proteins.
In addition to monitoring in the groups of pigs with different lean meat we can mention the values of the water content, IMF, crude proteins and ash matter (Table 2).
The the water contents ranged between 72.50% to 72.80%, the highest/lowest values having been found in the group with lean meat of 55.0–59.9%/more than 60.0%. The content of IMF showed an evo-lutionary tendency when, with the growth of the muscle proportion, the IMF content also declined. In the group with 50.0–54.9% of muscle, a value of 4.26% was recorded; in the group with 55.0–59.9%, a proportion of 3.65% was demonstrated; and in the group over 60.0%, a value of 3.52% was as-certained. As above mentioned values could be considered positive concerned sensorial point of view, there is question how high increase lean meat share with respect to gustative traits. Concerned of others traits characterised pork meat quality, the contents of crude proteins (further, CP) were very well-balanced (21.67–21.95%) in the groups, whereas the differences between the groups were not significant. From the results of the ash content it can be stated that with an increase in lean meat, the ash content also increases. The highest values (1.56%) were shown in the group with lean meat over 60.0% and more, the lowest (1.42%) with lean meat of up to 50.0%.
The total values of the selected aminoacids in the loin (MLLT) of the monitored groups with
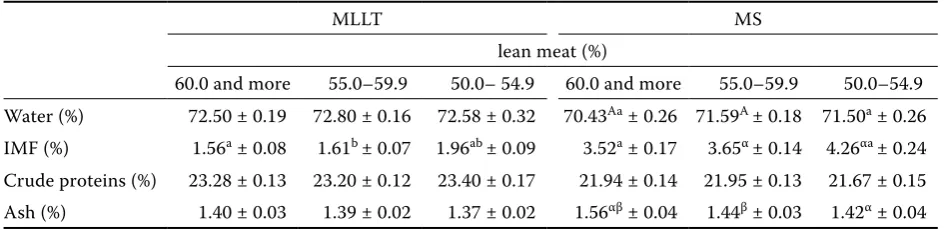
dif-Table 2. MLLT and MS chemical composition (–x ± SD)
MLLT MS
lean meat (%)
60.0 and more 55.0–59.9 50.0– 54.9 60.0 and more 55.0–59.9 50.0–54.9
Water (%) 72.50 ± 0.19 72.80 ± 0.16 72.58 ± 0.32 70.43Aa ± 0.26 71.59A ± 0.18 71.50a ± 0.26
IMF (%) 1.56a ± 0.08 1.61b ± 0.07 1.96ab ± 0.09 3.52a ± 0.17 3.65α ± 0.14 4.26αa ± 0.24
Crude proteins (%) 23.28 ± 0.13 23.20 ± 0.12 23.40 ± 0.17 21.94 ± 0.14 21.95 ± 0.13 21.67 ± 0.15
Ash (%) 1.40 ± 0.03 1.39 ± 0.02 1.37 ± 0.02 1.56αβ ± 0.04 1.44β ± 0.03 1.42α ± 0.04
[image:3.595.62.536.622.737.2]ferent lean meat proportions are shown in Table 3. It is demonstrated in this table that the highest values in the essential and semi-essential amino acids were monitored with lysine (9.86–10.59%), arginine (9.16–9.61%), and leucine (8.41–8.90%). However Belitz et al. (2001) presented the values 7.8–8.1% of lysine and 7.5–7.6% of leucine. The absolute minimum was measured for phenylalanine (1.23–1.41%), whereas (Belitz et al. 2001) men-tion 3% higher representamen-tion of phenylalanine. The highest values were shown with glutamic acid (12.04–12.35%), aspartic acid (11.46–12.13%), and alanine (7.75–7.81%), and the lowest values of the non-essential amino acids with proline (4.67–5.45%), serine (5.70–5.92%), and glycine (5.64–5.73%). Belitz et al. (2001) also showed alternative values within the framework of monitoring the levels of the non-essential amino acids. They found almost consistent the values of proline 4.6%, serine 4.2%, glycine 5.7%, and alanine 5.5%.
In the group of 60.0% and more of lean meat, minimum values were found with threonine, va-line, isoleucine, lysine, aspartic acid, serine, and
proline. On the contrary, the maximum values were shown with phenylalanine, glycine, and alanine. In the group with 55.0–59.9% of lean meat, the minimum/maximum values were estimated in the contents of phenylalanine and glycine/valine, leucine, arginine, glutamic acid and alanine. In the group with 50.0–54.9% of lean meat, the minimum values occurred with leucine, arginine, glutamic acid, and alanine. On the contrary, the values of threonine, isoleucine, lysine, aspartic acid, serine, and proline were the highest in this group.
The contents of amino acids – threonine, iso-leucine, lysine, aspartic acid, serine, and proline – declined with the increasing proportion of lean meat.
Generally one could say that the higher lean meat share in MLLT, the lower aminoacid spectrum and thereby lower pork meat nutritional value.
Table 3 documents the amino acids contents in the ham (MS). The highest contents of essential and semi-essential amino acids were shown with lysine (10.12–10.96%) and leucine (9.05–9.56%). On the contrary, phenylalanine revealed the
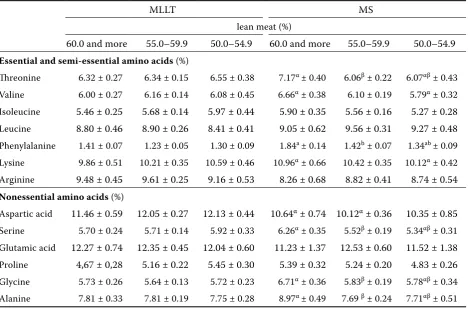
ab-Table 3. MLLT and MS amino acid contents (–x ± SD)
MLLT MS
lean meat (%)
60.0 and more 55.0–59.9 50.0–54.9 60.0 and more 55.0–59.9 50.0–54.9
Essential and semi-essential amino acids (%)
Threonine 6.32 ± 0.27 6.34 ± 0.15 6.55 ± 0.38 7.17α ± 0.40 6.06β ± 0.22 6.07αβ ± 0.43
Valine 6.00 ± 0.27 6.16 ± 0.14 6.08 ± 0.45 6.66α ± 0.38 6.10 ± 0.19 5.79α ± 0.32
Isoleucine 5.46 ± 0.25 5.68 ± 0.14 5.97 ± 0.44 5.90 ± 0.35 5.56 ± 0.16 5.27 ± 0.28
Leucine 8.80 ± 0.46 8.90 ± 0.26 8.41 ± 0.41 9.05 ± 0.62 9.56 ± 0.31 9.27 ± 0.48
Phenylalanine 1.41 ± 0.07 1.23 ± 0.05 1.30 ± 0.09 1.84a ± 0.14 1.42b ± 0.07 1.34ab ± 0.09
Lysine 9.86 ± 0.51 10.21 ± 0.35 10.59 ± 0.46 10.96α ± 0.66 10.42 ± 0.35 10.12α ± 0.42
Arginine 9.48 ± 0.45 9.61 ± 0.25 9.16 ± 0.53 8.26 ± 0.68 8.82 ± 0.41 8.74 ± 0.54
Nonessential amino acids (%)
Aspartic acid 11.46 ± 0.59 12.05 ± 0.27 12.13 ± 0.44 10.64α ± 0.74 10.12α ± 0.36 10.35 ± 0.85
Serine 5.70 ± 0.24 5.71 ± 0.14 5.92 ± 0.33 6.26α ± 0.35 5.52β ± 0.19 5.34αβ ± 0.31
Glutamic acid 12.27 ± 0.74 12.35 ± 0.45 12.04 ± 0.60 11.23 ± 1.37 12.53 ± 0.60 11.52 ± 1.38
Proline 4,67 ± 0,28 5.16 ± 0.22 5.45 ± 0.30 5.39 ± 0.32 5.24 ± 0.20 4.83 ± 0.26
Glycine 5.73 ± 0.26 5.64 ± 0.13 5.72 ± 0.23 6.71α ± 0.36 5.83β ± 0.19 5.78αβ ± 0.34
Alanine 7.81 ± 0.33 7.81 ± 0.19 7.75 ± 0.28 8.97α ± 0.49 7.69 β ± 0.24 7.71αβ ± 0.51
[image:4.595.65.536.427.736.2]solutely lowest value (1.34–1.84%). Among the nonessential amino acids, the highest values were measured for glutamic acid (11.23–12.53%) and aspartic acid (10.12–10.64%). The lowest value was shown for proline (4.83–5.39%).
In the group of 60.0% and more of lean muscle, the minimum values were found for leucine, ar-ginine, and glutamic acid whereas the maximum values were shown for threonine, valine, isoleucine, phenylalanine, lysine, aspartic acid, serine, proline, glycine, and alanine. In the group with 55.0–59.9% of lean meat, the minimum/maximum values were found with threonine, aspartic acid, and alanine/ leucine, arginine, and glutamic acid. In the group with 50.0–54.9% of lean meat, the minimum values occurred with valine, isoleucine, phenylalanine, lysine, serine, proline, and glycine.
The contents of the amino acids valine, isoleu-cine, phenylalanine, lysine, serine, proline, and glycine increased with the increasing proportion of lean meat.
From obtained values of the amino acid spectrum concerning of lean meat share, it can be stated, that MS demonstrate other tendency than MLLT. This fact can be caused by more higher metabolism intensity in the MLLT than in the MS. This find-ings correlated with results of Mora et al. (2008). They determined significantly higher content of creatine, creatinine and carnosine and showed that this could be due to the highest dependence of glycolytic muscles on anaerobic metabolism. The amount of carnosine increases with glycolytic activities of the muscle, also creatine and creati-nine contents increase in this type of metabolism. Aristoy and Toldrá (1998) evaluated free amino acid and dipeptides in pig meat, too. Statistically highest value of carnosine and serine was recorded in muscles with glycolitic activity.
Concerning the statistical evaluation of the dif-ferences between the groups, the values of IMF (p ≤ 0.01) in MLLT, the water content, IMF, ash mat-ter, threonine, valine, phenylalanine, lysine, aspartic acid, serine, glycine, and alanine in MS were highly significant (p ≤ 0.05; p ≤ 0.01 and p ≤ 0.001).
CONCLUSION
On the basis of the results obtained by measuring, it can be demonstrated that the values of the water content, IMF, crude proteins, and ash matter in the loin ranged between 72.50–72.80%, 1.56–1.96%, 23.20–23.40%, and 1.37–1.40%, respectively, whereas
the values of the water content, IMF, crude proteins, and ash matter in the ham were lower and ranged between 70.43–71.59%, 3.52–4.26%, 21.67–21.95%, and 1.42–1.56%, respectively. No developmental tendencies in the contents of water and crude pro-teins in meat with respect to the increasing lean meat proportion in the carcass were found. In our study, the IMF content declined with the increasing lean meat proportion while the ash matter content increased with the increasing lean meat propor-tion. Our findings indicated that the aminoacids contents in MLLT (threonine, isoleucine, lysine, aspartic acid, serine, proline) declined with the increase of the lean meat proportion, whereas in MS the amino acids (valine, isoleucine, phenylalanine, lysine, serine, proline and glycine) increased with the increase of the lean meat proportion. Based on the comparison of the total chemical composition in the dependence on the lean meat proportion in the carcass, the best appears to be the MLLT/MS group with 50.0–54.9%/60.0% lean meat propor-tion and more.
It can be stated, that pig breeding towards to high lean meat share leads to lower IMF content, then flavour and in some important carcass parts to lower pork meat nutritional value as well.
References
Aristoy M.C., Toldrá F. (1998): Concentration of free amino acids and dipeptides in porcine skeletal muscles with different oxidative patterns. Meat Sci-ence, 50: 327–332.
Babatude G.M., Pond W.C., Van Vlack L.D. (1966): Relationship among some physical and chemical pa-rameters of full-versus limited-food Yorkshire pigs slaughtered at different live weights. Animal Science,
25: 526–531.
Bahelka I., Demo P., Hanusová E., Hetényi L. (2006): Carcass value and intramuscular fat content of pig in dependence on sex and breed type. In: Book of Abstracts 57th Annual Meeting of the European Association for
Animal Production. Antalya, Turkey: 238.
Belitz H.D., Grosch W., Scieberle P. (2001): Food Chemistry. 5. Auflage. Springer Verlag, Berlin. Branscheid W., Komender P., Oster A., Sack E.,
Fewson D. (1987): Untersuchungen zur objektiven Ermittlung des Muskelfleischanteils von Schweine-halten. Züchtungskunde, 59: 210–220.
Correa J.A., Faucitano L., Laforest J.P., Rivest J., Marcoux M., Gariepy C. (2006): Effects of slaughter weight on carcass composition and meat quality in pigs of two different growth rates. Journal of Animal Science, 72: 91–99.
Fewson D., Branscheid W., Sack E. (1990): Untersu-chungen über das relative Wachstum der Teilstücke und Gewebe von mannlichen und weiblichen Mast-schweinen verschiedenen Herkunfte. Züchtungskunde,
62: 304–316.
Hovenier R., Kanis E., Van Asseldonk T., West-erink N.G. (1993): Breeding for pig meat quality in halothane negative populations – a review. Pig News
and Information, 14: 17N–25N.
Koucký M., Naděje B., Adamec T., Ševčíková S. (1993): The qualitative characters of carcass pigs of different sexes. Czech Journal of Animal Science, 38: 756–773.
Matoušek V., Kernerová N., Václavovský J., Vejčík A. (1997): Analýza kvality masa u hybridní populace pra-sat. Czech Journal of Animal Science, 42: 511–515. Mikule V. (2005): Vliv intenzity šlechtění různých
popu-lací prasat na obsah intramuskulárního tuku. [Au-toreferát doktorské disertační práce.] Brno: 4–17. Mora L., Sentandreu M.Á., Toldrá F. (2008):
Con-tents of creatine, creatinine and carnosine in porcine muscles of different metabolic types. Meat Science,
79: 709–715.
Naděje B., Koucký M., Ševčíková S., Adamec T., Laštovková J. (2000): Assessment of boar and
barrow meat. Czech Journal of Animal Science, 45:
539–544.
Oliver M.A., Gispert M., Diestre A. (2003): The effect of breed and halothane sensitivity on pig meat quality. Meat Science, 35: 105–118.
Pulkrábek J. (2001): Provision of objective conversion into money of pigs by the system SEUROP–control mechanisms. In: Proceedings Topical Problems of Pig Rearing. ČZU, Praha, 14–20.
Pulkrábek J., Wolf J., Vališ L., Vítek M., Höreth R. (2004): Vergleich verschiedener Methoden zur Bestim-mung des Muskelfleischanteils im Schlachtkörper des Schweines. Züchtungskunde, 76: 6–17.
SAS® Propriety Software Release 6.04, of the SAS® sys-tem for Microsoft® Windows®. SAS Institute Inc., Cary, 2000.
Ševčíková S., Koucký M., Laštovková J. (2002): Meat performance and quality in different genotypes of F1 generation gilts. Czech Journal of Animal Science, 47: 395–400.
Verbeke W., Van Oeckel M.J., Warnants N., Viaene J., Boucque C.V. (1999): Consumer perceptions, facts and possibilities to improve acceptability of health and sensory characteristics of pork. Meat Science,
53: 77–99.
Wood J.D. (2001): Meat quality and the designer pig. In: Lyons T.P. , Coles D.J.A. (eds): Concepts of Meat Science. Nottingham Nutrition International, Not-tingham: 17–31.
Received for publication May 14, 2008 Accepted after corrections December 22, 2008
Corresponding author:
Ing. Monika Okrouhlá, Ph.D., Česká zemědělská univerzita v Praze, Fakulta agrobiologie, potravinových a přírodních zdrojů, katedra speciální zootechniky, 165 21 Praha 6-Suchdol, Česká republika