Pyrimidine-4-carboxylic acid
Katarzyna Kiegiel, Wojciech Starosta and Janusz Leciejewicz*
Institute of Nuclear Chemistry and Technology, ul. Dorodna 16, 03-195 Warszawa, Poland
Correspondence e-mail: [email protected]
Received 29 April 2013; accepted 8 May 2013
Key indicators: single-crystal X-ray study;T= 293 K; mean(C–C) = 0.004 A˚; Rfactor = 0.048;wRfactor = 0.124; data-to-parameter ratio = 9.4.
The crystal structure of the title compound, C5H4N2O2, is built of acid molecules located on a mirror plane. They form sheets stacked along theb-axis direction. The molecules interactvia O—H N hydrogen bonds, forming [001] chains, and weak van der Waals interactions.
Related literature
For the structure of a Li complex with pyrimidine-4-carboxylate and aqua ligands, see: Starosta & Leciejewicz (2012).
Experimental
Crystal data
C5H4N2O2
Mr= 124.10
Monoclinic,P21=m
a= 6.0080 (12) A˚
b= 6.3519 (13) A˚
c= 7.4834 (15) A˚ = 112.20 (3)
V= 264.41 (9) A˚3
Z= 2
MoKradiation = 0.12 mm 1
T= 293 K
0.170.160.06 mm
Data collection
Kuma KM-4 four-circle diffractometer
Absorption correction: analytical (CrysAlis RED; Oxford Diffraction, 2008)
Tmin= 0.973,Tmax= 0.994 1981 measured reflections
545 independent reflections 349 reflections withI> 2(I)
Rint= 0.129
3 standard reflections every 200 reflections
intensity decay: 0.9%
Refinement
R[F2> 2(F2)] = 0.048
wR(F2) = 0.124
S= 1.00 545 reflections 58 parameters
H atoms treated by a mixture of independent and constrained refinement
max= 0.15 e A˚ 3
min= 0.34 e A˚ 3
Table 1
Hydrogen-bond geometry (A˚ ,).
D—H A D—H H A D A D—H A
O1—H1 N1i 1.04 (4) 1.62 (4) 2.660 (3) 179 (3)
Symmetry code: (i)x;y;z 1.
Data collection: KM-4 Software(Kuma, 1996); cell refinement:
KM-4 Software; data reduction: DATAPROC (Kuma, 2001); program(s) used to solve structure: SHELXS97 (Sheldrick, 2008); program(s) used to refine structure:SHELXL97(Sheldrick, 2008); molecular graphics:SHELXTL(Sheldrick, 2008); software used to prepare material for publication:SHELXTL.
Supplementary data and figures for this paper are available from the IUCr electronic archives (Reference: BT6903).
References
Kuma (1996).KM-4 Software. Kuma Diffraction Ltd, Wrocław, Poland. Kuma (2001).DATAPROC. Kuma Diffraction Ltd, Wrocław, Poland. Oxford Diffraction (2008).CrysAlis RED. Oxford Diffraction Ltd, Yarnton,
England.
Sheldrick, G. M. (2008).Acta Cryst.A64, 112–122.
Starosta, W. & Leciejewicz, J. (2012).Acta Cryst.E68, m1065–m1066.
Acta Crystallographica Section E
Structure Reports Online
supporting information
Acta Cryst. (2013). E69, o885 [doi:10.1107/S1600536813012610]
Pyrimidine-4-carboxylic acid
Katarzyna Kiegiel, Wojciech Starosta and Janusz Leciejewicz
S1. Comment
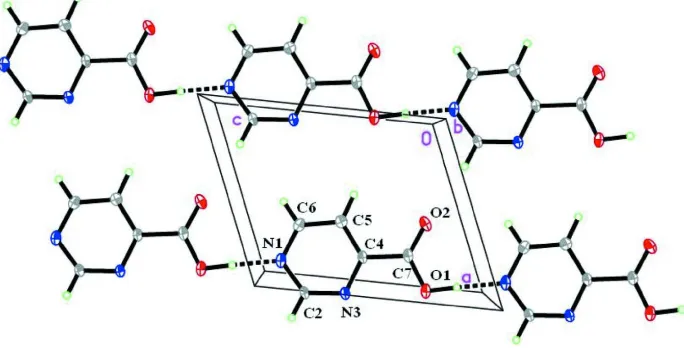
The monoclinic structure of pyrimidine-4-carboxylic acid C5H4N2O2 is composed of molecular sheets stacked along [010]
crystal direction (Fig.1). Within a sheet, hetero-ring and carboxylate group atoms are coplanar. Acid molecules interact
via hydrogen bonds of 2.658 (3) A in which protonated carboxylate O atoms are as donors and hetero-ring N atoms in
adjacent acid molecules act as acceptors. The C—C and C—N bond distances and bond angles within the acid molecule
do not differ from those reported earlier in the structure of the Li complex with the title acid (Starosta & Leciejewicz,
2012). The sheets are held together by van der Waals interactions as indicated by the distance between adjacent sheets
which is 3.171 (1) A.
S2. Experimental
75 ml of a hot (ca 350 K) aqueous solution containing 31.6 mmol of potassium permanganate was added dropwise during
3 h to 8 ml of stirred aqueous solution containing 21.3 mmol of 4-methylpyrimidine and 5 mmol of NaOH. After stirring
for half an hour longer, 1 ml of methanol was added to decompose the excess of potassium permanganate. The hot
solution was filtered and the solid washed twice with 5 ml of water. Then, the filtrate and the washings were concentrated
to ca 15 ml and acidified to pH 2–3 with concentrated HCl. After cooling to room temperature the precipitate containing
10.5 mmol of crude pyrimidine-4-carboxylic acid was recrystalized from a mixture of water and methanol taken in 20:1
ratio to give 1.1 g. (8.9 mmol) of colourless crystal blocks of the title acid (yield 42%, m.p. 508–509 K).
S3. Refinement
The hydrogen atom attached to the carboxylic group was located in a difference map and refined isotropically, while the
three H atoms attached to pyrimidine C atoms were located at a calculated positions and treated as riding on the parent
Figure 1
Molecules of the title compound with atom labelling scheme and 50% probability displacement ellipsoids viewed along
the b axis.
Pyrimidine-4-carboxylic acid
Crystal data
C5H4N2O2
Mr = 124.10 Monoclinic, P21/m
Hall symbol: -P 2yb
a = 6.0080 (12) Å
b = 6.3519 (13) Å
c = 7.4834 (15) Å
β = 112.20 (3)°
V = 264.41 (9) Å3
Z = 2
F(000) = 128
Dx = 1.559 Mg m−3
Mo Kα radiation, λ = 0.71073 Å Cell parameters from 25 reflections
θ = 6–15°
µ = 0.12 mm−1
T = 293 K Plate, colourless 0.17 × 0.16 × 0.06 mm
Data collection
Kuma KM-4 four-circle diffractometer
Radiation source: fine-focus sealed tube Graphite monochromator
profile data from ω/2θ scan Absorption correction: analytical
(CrysAlis RED; Oxford Diffraction, 2008)
Tmin = 0.973, Tmax = 0.994
1981 measured reflections
545 independent reflections 349 reflections with I > 2σ(I)
Rint = 0.129
θmax = 25.7°, θmin = 2.9°
h = −7→7
k = −7→7
l = −9→9
3 standard reflections every 200 reflections intensity decay: 0.9%
Refinement
Refinement on F2
Least-squares matrix: full
R[F2 > 2σ(F2)] = 0.048
wR(F2) = 0.124
S = 1.00 545 reflections 58 parameters 0 restraints
Primary atom site location: structure-invariant direct methods
Secondary atom site location: difference Fourier map
Hydrogen site location: inferred from neighbouring sites
w = 1/[σ2(F
o2) + (0.0689P)2]
where P = (Fo2 + 2Fc2)/3
(Δ/σ)max < 0.001
Δρmax = 0.15 e Å−3
Δρmin = −0.34 e Å−3
Special details
Geometry. All e.s.d.'s (except the e.s.d. in the dihedral angle between two l.s. planes) are estimated using the full covariance matrix. The cell e.s.d.'s are taken into account individually in the estimation of e.s.d.'s in distances, angles and torsion angles; correlations between e.s.d.'s in cell parameters are only used when they are defined by crystal symmetry. An approximate (isotropic) treatment of cell e.s.d.'s is used for estimating e.s.d.'s involving l.s. planes.
Refinement. Refinement of F2 against ALL reflections. The weighted R-factor wR and goodness of fit S are based on F2,
conventional R-factors R are based on F, with F set to zero for negative F2. The threshold expression of F2 > σ(F2) is used
only for calculating R-factors(gt) etc. and is not relevant to the choice of reflections for refinement. R-factors based on F2
are statistically about twice as large as those based on F, and R- factors based on ALL data will be even larger.
Fractional atomic coordinates and isotropic or equivalent isotropic displacement parameters (Å2)
x y z Uiso*/Ueq
O1 1.0036 (4) 0.2500 0.2735 (3) 0.0416 (6)
C4 0.8398 (5) 0.2500 0.5171 (4) 0.0308 (7)
N1 0.9072 (4) 0.2500 0.8961 (3) 0.0397 (7)
N3 1.0647 (4) 0.2500 0.6476 (3) 0.0371 (7)
O2 0.6049 (4) 0.2500 0.1835 (3) 0.0649 (8)
C7 0.8036 (5) 0.2500 0.3063 (4) 0.0364 (7)
C5 0.6416 (5) 0.2500 0.5672 (4) 0.0403 (8)
H5 0.4860 0.2500 0.4747 0.048*
C6 0.6868 (5) 0.2500 0.7631 (4) 0.0448 (9)
H6 0.5573 0.2500 0.8024 0.054*
C2 1.0847 (5) 0.2500 0.8311 (4) 0.0401 (8)
H4 1.2401 0.2500 0.9240 0.048*
H1 0.967 (6) 0.2500 0.126 (5) 0.064 (11)*
Atomic displacement parameters (Å2)
U11 U22 U33 U12 U13 U23
O1 0.0403 (11) 0.0677 (13) 0.0196 (9) 0.000 0.0145 (8) 0.000 C4 0.0308 (14) 0.0389 (14) 0.0225 (13) 0.000 0.0097 (11) 0.000 N1 0.0401 (13) 0.0606 (16) 0.0208 (11) 0.000 0.0142 (11) 0.000 N3 0.0276 (11) 0.0651 (16) 0.0173 (12) 0.000 0.0071 (9) 0.000 O2 0.0364 (12) 0.130 (2) 0.0206 (10) 0.000 0.0020 (9) 0.000 C7 0.0366 (15) 0.0507 (16) 0.0217 (13) 0.000 0.0109 (12) 0.000 C5 0.0287 (14) 0.0613 (19) 0.0293 (15) 0.000 0.0093 (13) 0.000 C6 0.0325 (14) 0.072 (2) 0.0342 (15) 0.000 0.0179 (12) 0.000 C2 0.0304 (13) 0.0718 (19) 0.0160 (12) 0.000 0.0062 (11) 0.000
Geometric parameters (Å, º)
O1—C7 1.314 (4) N3—C2 1.332 (3)
O1—H1 1.04 (4) O2—C7 1.200 (3)
C4—C5 1.376 (4) C5—H5 0.9300
C4—C7 1.509 (3) C6—H6 0.9300
N1—C6 1.322 (4) C2—H4 0.9300
N1—C2 1.329 (4)
C7—O1—H1 110.9 (19) C4—C5—C6 116.4 (3)
N3—C4—C5 122.8 (2) C4—C5—H5 121.8
N3—C4—C7 118.1 (2) C6—C5—H5 121.8
C5—C4—C7 119.1 (3) N1—C6—C5 122.4 (3)
C6—N1—C2 116.0 (2) N1—C6—H6 118.8
C2—N3—C4 115.2 (2) C5—C6—H6 118.8
O2—C7—O1 124.9 (2) N1—C2—N3 127.3 (2)
O2—C7—C4 120.6 (3) N1—C2—H4 116.4
O1—C7—C4 114.5 (2) N3—C2—H4 116.4
Hydrogen-bond geometry (Å, º)
D—H···A D—H H···A D···A D—H···A
O1—H1···N1i 1.04 (4) 1.62 (4) 2.660 (3) 179 (3)