warwick.ac.uk/lib-publications
Original citation:
Kreissl, Hannah T., Li, Molly M. J., Peng, Yung-Kang, Nakagawa, Keizo, Hooper, Thomas J. N.,
Hanna, John V., Shepherd, Ashley, Wu, Tai-Sing, Soo, Yun-Liang and Tsang, S. C. Edman.
(2017) Structural studies of bulk to nanosize niobium oxides with correlation to their acidity.
Journal of the American Chemical Society, 139 (36). pp. 12670-12680.
Permanent WRAP URL:
http://wrap.warwick.ac.uk/93718
Copyright and reuse:
The Warwick Research Archive Portal (WRAP) makes this work by researchers of the
University of Warwick available open access under the following conditions. Copyright ©
and all moral rights to the version of the paper presented here belong to the individual
author(s) and/or other copyright owners. To the extent reasonable and practicable the
material made available in WRAP has been checked for eligibility before being made
available.
Copies of full items can be used for personal research or study, educational, or not-for profit
purposes without prior permission or charge. Provided that the authors, title and full
bibliographic details are credited, a hyperlink and/or URL is given for the original metadata
page and the content is not changed in any way.
Publisher’s statement:
This document is the Accepted Manuscript version of a Published Work that appeared in
final form in Journal of the American Chemical Society, copyright © American Chemical
Society after peer review and technical editing by the publisher.
To access the final edited and published work see http://doi.org/10.1021/jacs.7b06856
A note on versions:
The version presented here may differ from the published version or, version of record, if
you wish to cite this item you are advised to consult the publisher’s version. Please see the
‘permanent WRAP url’ above for details on accessing the published version and note that
access may require a subscription.
Structural Studies of Bulk to Nano-size Niobium Oxides with
Corre-lation to Their Acidity
Hannah T. Kreissl
1, Molly M.J. Li
1, Yung-Kang Peng
1, Keizo Nakagawa
2, Thomas J.N. Hooper
3,
John V. Hanna
3, Ashley Shepherd
1, Tai-Sing Wu
4, Yun-Liang Soo
4, S. C. Edman Tsang
1*1Department of Chemistry, University of Oxford, Oxford, OX1 3QR, United Kingdom
2Centre for Membrane and Film Technology, Graduate School of Science, Technology and Innovation, Kobe
Univer-sity, Kobe 657-8501, Japan
3Department of Physics, University of Warwick, Coventry, CV4 7AL, United Kingdom 4 National Synchrotron Radiation Research Center, Hsinchu, Taiwan
ABSTRACT: Hydrated niobium oxides are used as strong solid acids with a wide variety of catalytic applications, yet the
correlations between structure and acidity remain unclear. New insights into the structural features giving rise to Lewis and Brønsted acid sites are presently achieved. It appears that Lewis acid sites can arise from lower coordinate NbO5 and
in some cases NbO4 sites, which are due to the formation of oxygen vacancies in thin and flexible NbO6 systems. Such
structural flexibility of Nb-O systems is particularly pronounced in high surface area nanostructured materials, including few-to monolayer or mesoporous Nb2O5*nH2O synthesized in the presence of stabilizers. Bulk materials on the other
hand only possess fewer quantities of acid sites due to lower surface areas and structural rigidity: small numbers of Brønsted acid sites on HNb3O8 arise from a protonic structure due to water content, whereas no acid sites are detected for
anhydrous crystalline H-Nb2O5.
Introduction
Apart from the stoichiometric NbO, NbO2 and Nb2O5
phases niobium oxides also exist in various non-stoichiometric, metastable and mixed phases, making Nb-O systems very complex and difficult to study.1–3 In terms
of structural variety, Nb2O5 and its closely related
non-stoichiometric structures present the largest group of niobium oxides.Although the Nb/O ratios are very simi-lar, these non-stoichiometric structures differ significant-ly with respect to their electrical conductivity, refractive index and photoelectric behaviour.1,4,5 It is well accepted
that physicochemical properties of non-stoichiometric structures are highly dependent on their precise struc-tures and thus form the basis for applications of the mate-rials in semiconductor, photovoltaic, solar device and electronic battery industries. Another significant field of use for niobium oxides is photo and acid catalysis. There are a number of nanostructured Nb-O systems claiming further superior performances. 6–10 It is therefore of great
interest to obtain information about the relationships between structure and material properties from bulk to nano size.
Due to the Nb oxidation state of +5 where all 4d electrons are shared with the 2p band of oxygen, Nb2O5 compounds
are generally white powders of low conductivity.1,4 Further
they are structurally based on interconnected NbO6
octa-hedra linked by corner- or edge-sharing with different degrees of distortion.11,12 A great numbers of structures
arises from the multiple possibilities of linking the
octa-hedra, as well as from crystallographic shear where mix-ing of different linkage regions occurs. Another important factor are impurities and oxygen defects leading to devia-tions from the regular coordination number of six.1,13–16
The Nb2O5 compounds range from crystalline to
amor-phous, bulk to nano size and anhydrous to hydrated forms. The most common crystalline phases: T-Nb2O5,
M-Nb2O5 and H-Nb2O5 phases were named according to the
temperatures (low, medium and high, respectively) they are obtained.5,12 H-Nb2O5 is monoclinic and
[image:2.612.330.548.590.725.2]thermody-namically the most stable niobium oxide phase. It con-sists of layered 3x4 and 3x5 blocks of corner-sharing octa-hedra with adjacent blocks linked by octaocta-hedra edges, and there is one recurring tetrahedral site per unit cell
(Figure 1a).1,5,17 M-Nb
2O5 has a tetragonal structure
de-scribed by 4x4 blocks of corner-sharing octahedra which are linked by edge-sharing octahedra (Figure 1b).1,5,18 The
T-Nb2O5 phase is orthorhombic and structurally more
complicated, involving six and seven-coordinated Nb at-oms which produce distorted octahedra and pentagonal bipyramids, respectively. The polyhedra are linked both by corner- and edge-sharing (Figure 1c).1,5,19 It is noted
that Nb5+ is the highest oxidation state for the above
Nb-O systems, therefore NbNb-O6 units as basic structural
fea-ture violates Pauling’s electrostatic valence rule.1,20 In
ad-dition to the small Nb5+ cation size this induces larger
structural distortions of the edge- and corner-sharing octahedra in Nb2O5 compounds. Crystallographic shear,
lattice defects and the introduction of oxygen vacancies are further postulated.5,13,16 It is however difficult to
em-ploy diffraction techniques to confirm the presence of polyhedra and oxygen deficient regions from the struc-tures without their long range order.
Hydrated forms of Nb2O5 are also common. The water
molecules can be incorporated into the structure by providing O2- as part of the octahedral Nb-O network,
while at the same time H+ acidic sites are formed.5,21,22
Hydrated niobium oxides have been reported as very strong solid Brønsted acids (BA), containing both termi-nal and bridging hydroxyls as BA sites. Many of them fur-ther contain Lewis acid (LA) sites, which arise from expo-sure of the Nb centers.5,9,23,24 Some of these hydrated
forms are just denoted as Nb2O5*nH2O, or Nb2O5 without
reference to the water content, which can sometimes be misleading. For better studied systems information on stoichiometry and structure is available, such as for HNb3O8: It has a sheet-like structure consisting of
alter-nating layers of protons and niobates/NbO6 octahedra
connected by edge- and corner-sharing (Figure 2).8,21,25,26
Due to their strongly acidic character many of these nio-bium oxides particular in nanometric size can be used as catalysts, for example in esterification, (de)hydration, (de)hydrogenation and redox reactions, etc. They have successfully been applied in the fields of polymer produc-tion, photo- and electrochemistry, hydrocarbon conver-sions and environmental chemistry.8,10,12,23,24
Unfortunate-ly, the structural details and their relation to acidity re-main unclear so far, meaning that targeted synthesis is not yet possible. For a rational design and better catalysts for the different application areas, it is therefore of great interest to study the correlations between structure and acidity in more detail.
Figure 2. Layered structure of HNb3O8 with alternating
sheets of interconnected NbO6 and protons
This paper is focused on the studies of Nb2O5 and related
hydrated niobium oxides with the help of using various start-of-the-art analytical techniques. Information on structure and morphology is obtained from XRD and TEM, and detailed studies on Nb-O bonding, oxidation states and coordination numbers are performed using Raman spectroscopy, XPS, EXAFS and 93Nb MAS NMR.
Combining the results with observations from surface acidity measurements, new insights into structure-acidity correlations are gained. It is found that nanostructured materials of high surface area and structural flexibility, such as few-to monolayer and mesoporous niobium ox-ides made with the help of stabilizers, possess large amounts of both LA and BA sites. For hydrated bulk ma-terials of low surface area and high crystallinity only BA sites are detected, which are due to the protonic structure formed upon incorporation of water molecules. LA sites on the other hand appear to arise from oxygen vacancies whose formation is based on a significant degree of struc-tural distortion and flexibility.
Experimental
Niobium Oxide Synthesis
A variety of niobium oxides, ranging from bulk to multi- and monolayer structures has been synthesized. The bulk material HNb3O8 has been prepared by a conventional
solid-state reaction of the precursors K2CO3 and Nb2O5,
followed by proton exchange. Few layer niobium oxide (hy-Nb) and monolayer niobium oxide (hy-Nb-TEOA) have been synthesized hydrothermally from Nb(OEt)5 in
ammonia solution, in the case of hy-Nb-TEOA under fur-ther addition of triethanolamine (TEOA). Both materials have been acid treated before use, in order to remove the basic surfactant species which block their acid sites. Mes-oporous Nb2O5*nH2O (meso Nb2O5) has been prepared by
hydrolysis and condensation of Nb(OEt)5, followed by
soaking in acid solution. Detailed synthetic procedures and references are given in SI. For comparison, commer-cial bulk Nb2O5 (Alfa Aesar) is used.
Characterization
Sample crystallinity was identified by powder XRD using an X’ pert Pro (PANalytical) instrument operating in Bragg-Brentano focusing geometry and using Cuka radia-tion (λ= 1.5418 Å) from a generator operating at 40 kV and 40 mA.
Sample morphology and microstructure were examined by TEM using a JEOL 3000F microscope operated at 300 kV. TEM specimens were prepared by pipetting 5 µl of the sample dispersion in ethanol onto holey carbon-coated copper mesh grids (400 meshes).
Raman spectra were collected on a Perkin Elmer Raman Spectrum 400F using a laser excitation wavelength of 532 nm. 5 scans of exposure time of 10s were taken for each sample. The samples were further dried at 150°C before the measurements.
micro-focused mono-chromated Al X-ray source. The source was operated at 12 keV and a 400 micron spot size was used. The analyzer operated at the energy (CAE) of 200 eV for survey scans and 50 eV for detailed scans. Charge neutralization was applied using a combined low energy/ ion flood source. The data acquisition and analy-sis were conducted with CasaXPS (Casa software Ltd.). The peak position was referenced to the C1s peak of the carbon tape at 285.00 eV.
Oxidation states and local structures of Nb atoms were probed by X-ray absorption fine structure, XAFS, (beam-line BL07A at National Synchrotron Radiation Research Center Taiwan). A Si(111) Double Crystal Monochromator (DCM) was used to scan the photon energy and the ener-gy resolution (ΔE/E) for incident X-ray photons was esti-mated to be 2×10⁻⁴. Transmission mode was adopted for
Nb K-edge EXAFS measurements and at least two scan sets were collected and compared for each sample. The data analysis was performed using IFEFFIT with Horae packages (Athena and Artemes). Calibrations and struc-tural refinements were done using Nb metal as a refer-ence. First shell data analyses were performed under the assumption of single scattering with error estimation giv-en by the R-factor.
The 93Nb static NMR measurements were undertaken at
14.1 T using a Bruker Avance II+-600 spectrometer operat-ing at the 93Nb Larmor frequency of 146.66 MHz. All 93Nb
NMR data were acquired using a 5 mm static Bruker probe. A π/2 pulse length was determined on K[NbCl6].CH3CN resulting in a selective π/6 pulse length
of 0.5 µs that satisfied the uniform excitation condition for quadrupolar nuclei27 where (I +½)ω
rftp≤π/6. A
(π/6)-τ-(π/6) echo sequence was utilised to diminish ringing ef-fects with a τ period of 30 µs and a recycle delay of 0.5 s.28– 30 All 93Nb chemical shifts were referenced to
K[NbCl6].CH3CN (δiso=0.0 ppm).
Acid site characterization was conducted using trime-thylphospine (TMP) adsorption, followed by 31P MAS
NMR (TMP NMR) measurements. The acid type, LA or BA, and acid strength can be differentiated by the 31P
chemical shift of TMP due to the variations in interaction strength of the adsorbed TMP molecule with different acid sites. (0 to 6 ppm are typically associated with BA; -20 to -58 ppm with LA; the less negative the shift value, the stronger the acidity). Furthermore, quantitative anal-ysis of the 31P NMR peaks was carried out.31,32 For a
de-tailed description of the TMP 31P MAS NMR
[image:4.612.120.500.336.705.2]measure-ments, see SI.
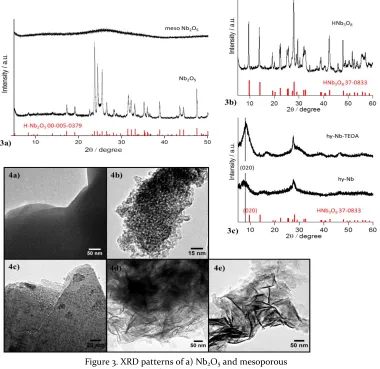
Figure 3. XRD patterns of a) Nb2O5 and mesoporous
Nb2O5*nH2O, b) HNb3O8, c) hy-Nb and hy-Nb-TEOA
Results and Discussion
Comparing the obtained XRD spectra to literature shows that commercial Nb2O5 has a crystalline H-Nb2O5
struc-ture1,2 (Figure 3a), the thermodynamically most stable and
monoclinic niobium oxide phase which consists primarily of corner- and edge-sharing NbO6 units. The synthesised
HNb3O8 also compares well to literature26,33 (Figure 3b),
its crystalline structure is known to consist of alternating layers of protons and niobate sheets made of edge- and corner-sharing NbO6 units. When it comes to
hy-Nb-TEOA and hy-Nb, the XRD spectra are a lot broader, indi-cating a significant decrease in crystallinity (Figure 3c). The synthesis of these two nano-materials was only re-cently reported8 but no structural detail about their Nb-O
bonding is yet given. It has however been shown that they consist of many discrete thin layers8, which is in contrast
to bulk Nb2O5 and HNb3O8, as also seen in the TEM
im-ages in Figure 4 (a, c-e). Their layer exfoliation is facilitat-ed by the addition of TEOA or ammonia as stabilizers during hydrothermal synthesis, where the stabilizers might also assist in the reduction of these Nb-O systems. Their XRD spectra suggest that hy-Nb-TEOA and hy-Nb have structural similarities to HNb3O8. The peak
broaden-ing and shift to lower angles for the (020) diffraction peak, as well as the shift in relative peak intensities can be explained by the increasing interlayer distance and 2D directional orientation when compared to bulk HNb3O8
(Figure 3c). Thus, the layer separation results in less rigid and only partially crystalline structures. In the case of mesoporous Nb2O5*nH2O, no structural information can
be obtained from the almost flat XRD diffractogram, in-dicative of its amorphous nature (Figure 3a) although mesoporous structure is shown by TEM and BET/pore analysis (Figure 4b and Figure S1).
From Raman spectroscopy the same trend in sample crys-tallinity is observed as from XRD: Commercial Nb2O5 and
bulk HNb3O8 give clear peaks indicating higher
crystallin-ity while the broader spectra of hy-Nb and hy-Nb-TEOA indicate lower crystallinity, and finally a very broad spec-trum is obtained for the amorphous mesoporous Nb2O5*nH2O (Figure 5). As reported in literature, it is
difficult to assign specific Nb-O stretching modes to cor-responding frequencies in the Raman spectrum. Especial-ly the frequency ranges between 200 - 400 cm-1 and 400 -
760 cm-1 do not only correspond to Nb-O stretching
modes of long and intermediate bonds but are perturbed by symmetry-related vibrations and coupling between neighbouring entities.11,20,34,35 The frequency ranges
be-tween 760 – 1000 cm-1 are better to assign and mostly
cor-respond to the shortest Nb-O bonds in each system. Nio-bium oxides consisting mainly of corner-shared octahedra tend to have their highest frequency stretching mode in the lower end region of around 800 cm-1.20,34 This relates
to their crystal structure with a lower degree in bond length variation between 1.9 – 2.0 Å and less structural strain. Niobium oxides consisting significantly of edge-shared octahedra, such as H-Nb2O5, tend to have their
[image:5.612.319.569.46.239.2]highest frequency stretching mode in the upper
Figure 5. Raman spectra of the different niobium oxides
region of around 1000 cm-1.20,34,35 This value can be
associ-ated with larger bond length variations between 1.73 – 2.26 Å.
By careful examining the Raman spectra of this work (Figure 5), it can be seen that the spectrum of commercial Nb2O5 matches well with that of H-Nb2O511,20,35, thus
con-sistent with the XRD result. A sharp peak is seen at about 1000 cm-1, which arises most likely from the significant
amount of edge-sharing NbO6 with many short Nb-O
bonds in a closely packed structure.11,20 For HNb
3O8 there
is a larger peak at 780 cm-1 but only a very small peak at
1000 cm-1, suggesting longer bond lengths and less
struc-tural rigidity than for Nb2O5. It is known that the crystal
structure of HNb3O8 consists of considerable amounts of
corner- besides edge-sharing octahedra and is further a layered structure with more structural flexibility8,26,33,
which explains the observed longer bond lengths. A sig-nificant Raman peak broadening for hy-Nb and hy-Nb-TEOA compared to the crystalline bulk materials HNb3O8
and Nb2O5 is observed. This is expected from the lower
crystallinity and higher structural flexibility of these two materials due to increasing interlayer distances. This sup-ports the previous observations from TEM and XRD. However it is to note that besides a broadening of the typical bond regions an additional large peak is observed around 900 cm-1 for both hy-Nb and hy-Nb-TEOA. This
peak is not obvious in the spectra of Nb2O5 and HNb3O8.
It implies that there are some structural changes from HNb3O8 to hy-Nb and hy-Nb-TEOA. The feature around
900 cm-1 is believed to arise from octahedral distortions
with species such as O=Nb---O, having a double bond like and a single elongated Nb---O bond as part of the octa-hedron.11,20,34 Since the hy-Nb and hy-Nb-TEOA have very
high surface areas and structural flexibility due to their layer separations, this octahedral deformation appears to be reasonable. Finally, the Raman spectrum of mesopo-rous Nb2O5*nH2O is almost flat, with only a very broad
been observed for the other niobium oxides. Unfortunate-ly no further information can be obtained, like-wise to XRD, due to the apparently highly amorphous structure and low symmetry of mesoporous Nb2O5*nH2O.
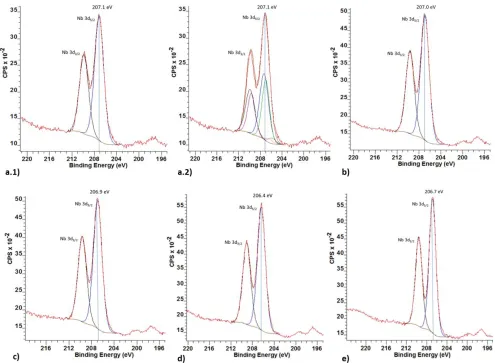
XPS spectra of the different niobium oxides have been taken as they can give further information about oxida-tion state and atomic environment. Literature has shown that for niobium compounds the Nb 3d region is generally the most sensitive and characteristic.36–39 This region
al-ways shows peak doublets due to spin-orbit coupling of the Nb 3d orbital, giving rise to a Nb 3d5/2 and a Nb 3d3/2
peak with an area ratio of 3:2 and a peak separation of 2.72 eV. The doublet position shifts according to oxida-tion state, with a higher oxidaoxida-tion state causing a shift towards higher binding energies (BEs).36,37,40 The BE
val-ues representing a sample’s Nb 3d region are usually given in form of the Nb 3d5/2 peak values. Nb2O5 with an
oxida-tion state of Nb5+ and NbO2 with an oxidation state of
Nb4+ have been reported with BE values of about 207.4 eV
and 206.2 eV, respectively.40,41 However, the deviation of
BE up to 0.5 eV is not uncommon due to instrumental drift and measurement errors. It is thus more important to compare the measured values relative to each other.
The XPS Nb 3d spectrum of commercial Nb2O5 (H-Nb2O5)
shows a doublet with a binding energy of 207.1 eV, com-paring well with the literature values for Nb5+ (Figure 6
a.1).40,41 Since the crystal structure of H-Nb
2O5 is known to
consist of both edge- and corner-sharing octahedra as well as the occasional tetrahedron1, all of which provide
different Nb environments, strictly speaking 3 doublets would be expected: Two large doublets in the Nb5+ region
and one very small doublet, potentially shifted towards Nb4+. Using an XPS peak fitting program (CasaXPS) it is
possible to fit the expected 3 doublets (Figure 6 a.2), how-ever the peak shifts are too small to get mathematical reliable results, the fitting using one doublet is just as good as that of the 3 doublets. This suggests that the cor-responding BE’s of the three Nb species are too close to separate. The XPS spectrum of HNb3O8 shows a similar
result to H-Nb2O5, giving only one obvious doublet
(Fig-ure 6b) despite the fact that two Nb environments are anticipated. As more or less expected from here, the re-maining samples of hy-Nb (Figure 6c), hy-Nb-TEOA (Fig-ure 6d) and mesoporous Nb2O5*nH2O (Figure 6e) whose
[image:6.612.60.555.330.693.2]structures remain to be identified, also show only one apparent doublet. It is therefore not possible for XPS to draw conclusions about the number of Nb
Figure 6. XPS spectra of the different niobium oxides a.1) Nb2O5 single doublet fitting, a.2) Nb2O5 triple doublet fitting,
Table 1. Nb 3d peak regions of the niobium oxides Sample Nb 3d5/2 peak region (eV)
Nb2O5 207.1
HNb3O8 207.0
hy-Nb 206.9
hy-Nb-TEOA 206.4 mesoporous
Nb2O5*nH2O
206.7
Peak region given as Nb 3d5/2 peak centre values (common
denotation)
environments arising from different extents of octahedral distortion or small coordination changes. However there is one visible difference amongst the niobium oxide sam-ples: the chemical shift of the Nb 3d region (Figure 6 and Table 1). For commercial Nb2O5 the Nb 3d5/2 region is
centred at 207.1 eV > 207.0 eV for HNb3O8 > 206.9 eV for
hy-Nb > 206.7 eV for mesoporous Nb2O5*nH2O > 206.4 eV
for hy-Nb-TEOA. As seen there is an obvious shift in oxi-dation state from Nb2O5 with mostly Nb5+ character to
hy-Nb-TEOA with more Nb4+ character. A similar shift
to-wards Nb4+ has been observed by Xiong et al. who
com-pared their exfoliated/nanosheet-HNb3O8 with bulk
HNb3O8.26 For the bulk materials Nb2O5 and HNb3O8 the
Nb oxidation state of +5 is expected due to their composi-tion of almost purely edge- and corner-sharing octahedra. Whereas, the few- to monolayered materials hy-Nb and hy-Nb-TEOA having larger structural flexibility and dis-order than HNb3O8, as previously shown by TEM, XRD
and Raman spectroscopy contain a higher contribution of Nb4+ (a higher degree of average Nb 3d5/2 peak shift)
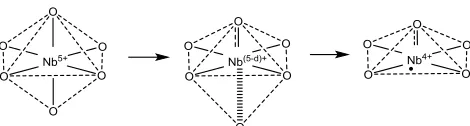
It is recalled that Raman spectroscopy suggests the pres-ence of a characteristic distorted O=Nb---O species with one double-bond like and one elongated Nb-O bond. With respect to the apparent XPS BE shift towards Nb4+,
this feature in the case of hy-Nb and especially hy-Nb-TEOA might form the structural basis to give rise to oxy-gen vacancies during synthesis. Some of the distorted and elongated bonds of Nb---O from O=Nb---O can be bro-ken during a reduction process enabled by stabilizers, resulting in an electron-richer five-coordinated Nb4+
cen-tre (Scheme 1). It is appreciated that a more pronounced shift towards Nb4+ character for hy-Nb-TEOA compared
to hy-Nb is due to a higher degree of layer exfoliation by TEOA during the synthesis. This increases its structural flexibility and oxygen vacancy formation. The lower coor-dination number derived by EXAFS for hy-Nb-TEOA (dis-cussed in the next section) also supports this postulation. Interestingly mesoporous Nb2O5*nH2O with its highly
amorphous feature shows a similarly high Nb4+ content as
hy-Nb and hy-Nb-TEOA.
As a side note, it is interesting to observe the chemical shift towards Nb4+ character for hy-Nb-TEOA and
meso-porous Nb2O5*nH2O from XPS. The presence of unpaired
electrons from Nb4+ is expected to give coloured samples,
such as in NbO2 with a blue colour.1 However, all the
nio-bium oxide samples studied are white in colour, leaving two possible explanations: the amount of Nb4+ species
could be too small to create a detectible colour. Alterna-tively, it could be the partial electronic delocalization in the Nb-O networks. Instead of forming individual Nb4+
species upon oxygen removal, the electrons might be de-localized amongst the Nb centres in NbO6 networks. This
would also explain why a shift in total oxidation state ra-ther than separate signals from Nb5+ and Nb4+ are
detect-ed in XPS. Such network sharing or building of a super-structure for defects present in large amounts has been suggested for conductive metal oxides in literature.16,42
It is noted that we have restrained ourselves from analys-ing the correspondanalys-ing O1s spectrum instead of usanalys-ing the Nb 3d to deduce the degree of oxygen vacancies in these materials. It is because the presence of oxygen impurities in carbon tape as the random but significant background gives a non-compensable contribution to the O1s spec-trum. This reduces the useful information that can be obtained from O1s analysis.
Scheme 1. Proposed oxygen vacancy formation dur-ing synthesis with stabilizers
Based on observations from Raman, XPS and EXAFS
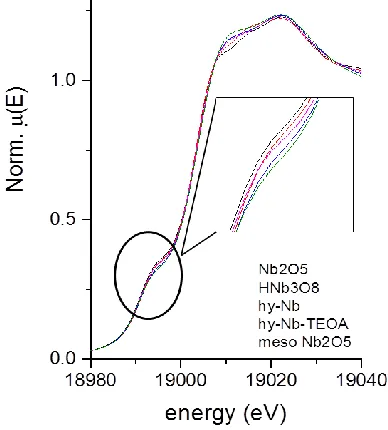
For further investigation of the local Nb environment XAFS measurements have been done. The obtained x-ray absorption near edge spectra (XANES) of the Nb K-edge are displayed in Figure 7. Generally, a higher oxidation state causes a shift towards higher absorption energies. But in the case of Nb5+ versus Nb4+ the energy gap is
ra-ther small and may be obscured by the presence of a pre-edge peak and other shape factors.43,44 It has been
report-ed that Nb5+ species as in Nb
2O5 with a higher oxidation
state display a larger pre-edge peak than Nb4+ species as
in NbO2.43,45,46 Although the pre-edge peaks of our
meas-ured niobium oxide samples are very close in position, the order of the peak size of Nb2O5 > HNb3O8 > hy-Nb-TEOA
> hy-Nb > mesoporous Nb2O5*nH2O (Figure 7) can be
[image:7.612.49.300.46.169.2] [image:7.612.320.555.313.376.2]Figure 7. XANES Nb K-edge absorption spectra for the different niobium oxides
are discrepancies in the precise order for the structures of hy-Nb, hy-Nb-TEOA and mesoporous Nb2O5*nH2O. It is
to bear in mind that the size of the pre-edge peak is not only dependent on oxidation state but also on the coordi-nation environment.47,48 In this context it should be
men-tioned that the average coordination numbers of the few-to monolayer and the porous material are significantly lower than for the bulk materials (Table 2).
Information on bond distances and coordination num-ber can be obtained by analysis of the extended x-ray ab-sorption fine structure (EXAFS).44–46,49 The fitted k and R
ranges for the first neighbours (1st O-shell) of each sample
can be found in the Supporting Information, where the R space amplitude relates to the radial distance from Nb at which bonds to neighbouring atoms are present. The cal-culated Nb-O bond lengths and coordination numbers are displayed in Table 2. For commercial Nb2O5
(H-Nb2O5) two Nb-O types with bond lengths of 1.76 Å and
1.96 Å are obtained, with respective Nb coordination numbers of 1.4 and 4.3, giving a total of 5.7. The numbers correlate well with the crystal structure of H-Nb2O5 that is
made mainly of octahedra and very few tetrahedra1,
re-sulting in an average coordination of just below 6. It has further been reported in literature that corner-sharing octahedra consist of uniform Nb-O bonds of 1.9 – 2.0 Å while the more distorted edge-shared octahedra vary in bond lengths between 1.73 – 2.26 Å.20,34,44 It appears that
the measured Nb-O bonds of 1.76 Å represent the shorter edge-sharing octahedral bonds, while 1.96 Å with a larger average coordination number represents both the longer edge-sharing and the uniform corner-sharing bonds. For HNb3O8 two similar Nb-O bond lengths with respective
coordination are obtained, plus a third Nb-O bond of
Table 2. Bond distances and coordination numbers for the different niobium oxides
Scatter-ing path
Bond length in Å
Coordi-nation number
Total Co-ordination number
Nb2O5 Nb-O1 1.76 1.4 5.7
Nb-O2 1.96 4.3
HNb3O8 Nb-O1 1.77 1.0 6.2
Nb-O2 2.02 4.1
Nb-O3 2.22 1.1
hy-Nb Nb-O1 1.88 0.9 5.6
Nb-O2 2.07 3.8
Nb-O3 2.31 0.9
hy-Nb-TEOA
Nb-O1 1.93 1.1 4.8
Nb-O2 2.09 3.4
Nb-O3 2.29 0.3
meso Nb2O5
Nb-O1 1.91 0.9 4.5
Nb-O2 2.10 3.6
Information obtained from EXAFS k and R space trans-formations with fitting for 1stO-shell
2.22 Å with a coordination of 1.1. The Nb-O bond lengths correlate well with findings on KNb3O8, the precursor of
HNb3O8 from ion exchange, and also with Crystal Maker
data of HNb3O8, where the larger numbers of given Nb-O
bond distances can be grouped to give the bond catego-ries found from EXAFS.50 The total coordination number
is 6.2, correlating well with the layered structure known to consist of NbO6 sheets with a theoretical coordination
of 6. The Nb-O bonds of similar nature to Nb2O5 are
probably again due to the edge- and corner-sharing octa-hedra present, while the additional longer bond type like-ly arises from the layered structure with a gain in flexibil-ity along the z-axis. The overall increase in bond length and structural flexibility for HNb3O8 compared to Nb2O5
also compares well with the observations from Raman spectroscopy. For hy-Nb the trend in bond lengths and coordination numbers is similar to HNb3O8, supporting
their structural similarities as shown by XRD. The overall longer Nb-O bonds of hy-Nb are a sign of higher structur-al flexibility due to layer separation as shown previously. With a total coordination number of below 6 this likely includes the formation of some oxygen vacancies as sug-gested by XPS. These observations become more apparent for the few- to monolayered hy-Nb-TEOA, with even longer Nb-O bonds and a total coordination number of only 4.8. Interestingly, the percentage of the longest Nb-O bond type (Nb-Nb-O3) is largely reduced compared to hy-Nb and Hhy-Nb3O8, suggesting the complete removal of
sig-nificant amounts of elongated Nb---O bonds. This results in the formation of oxygen vacancies and a greatly dis-torted structure with reduced average coordination num-bers. It goes in line with the XPS observations of an in-creased Nb4+ character for hy-Nb-TEOA (Scheme 1). For
[image:8.612.312.562.61.288.2]two types of Nb-O bonds measured with 1.91 Å and 2.10 Å and respective coordination of 0.9 and 3.6. The overall longer bonds compared to Nb2O5 suggest a rather loose
and flexible packing of structural units, pointing towards corner-sharing NbO6. With a coordination number of
only 4.5, the structure could be a mix of four-, five- and six-coordinated Nb-O units, which would match its amorphous nature (Scheme 2). It is difficult to make a more specific statement on coordination numbers since the calculated numbers present an average and involve fitting limitations.51
Scheme 2. Proposed structure of amorphous meso-porous Nb2O5*nH2O
Based on EXAFS and XPS results (protons not shown)
Further comparison can be drawn by observing the
93Nb static broadline NMR data of the niobium oxide
samples measured at 14.1 T. The 100% natural abundance, high gyromagnetic ratio and I=9/2 spin number of the
93Nb nucleus are the aspects that are advantageous to
these static NMR measurements. However the large con-voluted quadrupolar (CQ) and chemical shift anisotropy
(CSA) contributions to these linewidths often lead to a significant broadening of the central transition resonance, even at very high magnetic field strengths.These complex characteristics describing the 93Nb static linewidth often
reduce the effectiveness of fast MAS rates when attempt-ing to determine accurate values of the 93Nb NMR
param-eters.30,52–54 Octahedrally coordinated NbO
6 environments
are normally observed to exhibit δiso values in the range of
~−900 - −1100 ppm, with quadrupole coupling constants (CQ) typically ranging from 0-~55 MHz. Four coordinate
NbO4 and five coordinate NbO5 positions generally
pos-sess lower point symmetry and are characterised by more downfield δiso values in the range of ~−700 - −850 ppm
and very large CQ values of >80 MHz.30,38,53 The tendency
for NbO4 to assume the reduced Nb4+ oxidation state can
[image:9.612.327.503.40.234.2]result in signals which are influenced significantly by par-amagnetic broadening and associated parpar-amagnetic shifts.55
Figure 8.93Nb static NMR spectra of the different niobium
oxides with a dotted line through the centre-of-gravity posi-tion (δCG)of mesoporous Nb2O5*nH2O
The static broadline 93Nb NMR data for the niobium
ox-ide samples is shown in Figure 8. On first inspection it is apparent that Nb2O5 exhibits more distinct lineshape
fea-tures than the remaining samples. The HNb3O8 spectrum
is consistent with that previously reported, where it has been shown to consist of two quadrupolar/CSA broad-ened resonances assigned to the two chemically distinct edge-sharing and corner-sharing NbO6 positions.38 The
Nb2O5 lineshape is broader and less well defined than that
for its HNb3O8 counterpart. This is in agreement with
previous studies which have demonstrated that a larger
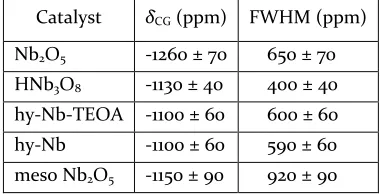
Table 3. δCG and full width at half maximum of the NMR resonances for the different niobium oxides
δCG and FWHM values were determined from
correspond-ing Gaussian fittcorrespond-ings of the NMR spectra.
number of non-equivalent Nb sites is a specific feature of Nb2O5 phases, and that numerous overlapping NbO6
sub-spectra comprise the static 93Nb NMR lineshape.30 The 93Nb spectra for hy-Nb, hy-Nb-TEOA and mesoporous
Nb2O5*nH2O all exhibit featureless lineshapes
representa-tive of more disordered systems. The apparent centre-of-gravity shifts δCG suggest that each system is dominated
by NbO6 moieties; NbO4 and NbO5 species with 93Nb
lin-ewidths typically ≥ 1 MHz are too broad to be detected by Catalyst δCG (ppm) FWHM (ppm)
Nb2O5 -1260 ± 70 650 ± 70
HNb3O8 -1130 ± 40 400 ± 40
[image:9.612.337.528.465.562.2]single solid echo experiments. The width of the line shape for mesoporous Nb2O5*nH2O is greater than for the other
spectra, suggesting a greater structural disorder. There-fore, the 93Nb NMR results follow the trend in crystallinity
of Nb2O5/HNb3O8 > hy-Nb/ hy-Nb-TEOA > mesoporous
Nb2O5*nH2O, hence matching with the XRD and Raman
results.
Due to the disordered nature of some of the NMR spec-tra it is difficult to derive the accurate NMR parameters. However, the centre of gravity of the chemical shift (δCG)
of each line shape can be measured and is shown in Table 3. As seen, Nb2O5 has a significantly more negative δCG
than the other niobium oxides. Similarly to the EXAFS result, this change in δCG could represent a trend in
aver-age oxidation state/coordination number from Nb5+ in
Nb2O5 to an increase in Nb4+ character in the disordered
materials.
Correlation of Structure and Acidity
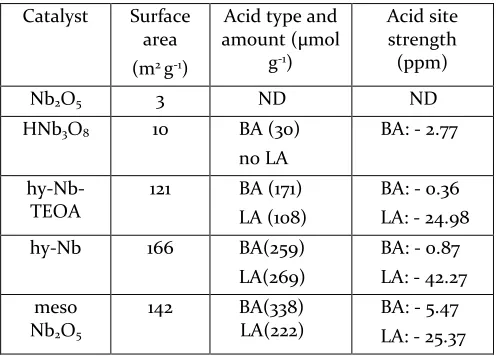
In order to look at the relation between niobium oxide structure and acidity, a summary of the acidity measure-ments from our previously published work56 is given in
Table 4. Acid type (Brønsted versus Lewis), strength and quantity for each material have been probed by TMP 31P
NMR. TMP is an electron donor molecule that can form a stable adduct with an exposed cation (Lewis acid, LA) or proton (Brønsted acid, BA) of an oxide surface, via coor-dination of the P atom to the LA or BA center. Due to variations in the 31P chemical shift (δ31P) of the surface
TMP-LA and TMP-BA complexes, a differentiation be-tween acid type and further strength is possible. For de-tails on TMP 31P NMR measurements, see Supporting
[image:10.612.49.297.473.651.2]In-formation.
Table 4. Surface area and acid site analysis for the different niobium oxides
Catalyst Surface area (m2 g-1)
Acid type and amount (μmol
g-1)
Acid site strength (ppm) Nb2O5 3 ND ND
HNb3O8 10 BA (30)
no LA
BA: - 2.77
hy-Nb-TEOA
121 BA (171) LA (108)
BA: - 0.36 LA: - 24.98 hy-Nb 166 BA(259)
LA(269)
BA: - 0.87 LA: - 42.27 meso
Nb2O5
142 BA(338) LA(222)
BA: - 5.47 LA: - 25.37
Surface areas were obtained from BET measurements, Acid site analysis (qualitative and quantitative) by TMP 31P
NMR, BA region: ̴ 0 to -6 ppm, LA region: ̴ -20 to -45 ppm, less negative ppm shift means stronger acidity within each region57,58
In general for solid acid metal oxides, BA sites are proton-ic surface sites in the form of strongly acidproton-ic bridging or terminal hydroxyl groups.57,59 LA sites arise from the
ex-posure of electron deficient metal centres, for example due to lower numbers or distortion of coordinating ox-ygens.24,60 For Nb
2O5 no acid sites are detected which is
consistent from a structural point of view: protons giving rise to BA sites are not part of the crystal structure of H-Nb2O5. Further the rigid network of edge- and
corner-sharing octahedra with a highly coordinated niobium centre makes the formation of LA sites/ TMP-LA adducts difficult. In addition, the general surface area of these bulk materials is low. The number of possibly formed LA sites from strongly distorted surface octahedra is thus not surprisingly below the detection limit. The same argu-ment applies for HNb3O8 regarding LA site formation. BA
sites/ TMP-BA adducts on the other hand are detected in this case, as expected due to the bulk layer structure con-sisting of alternating proton and niobate sheets.
If few-to monolayer hy-Nb and hy-Nb-TEOA were based on the exact same structural units as HNb3O8, an increase
in BA sites according to surface area would be expected. However, in both cases the increase in BA sites is less pronounced (only about half) than expected from the increase in surface area (Table 4). Instead a large amount of LA sites is detected. It has been suggested that the re-moval of BA sites in form of water (2H+ and 1O2- from the
Nb-O network) can result in the formation of LA sites.5,60
Considering the fact that the reaction between two BA sites in form of a proton and a terminal hydroxyl group yields a water molecule and an oxygen vacancy, one ac-cessible LA site (for TMP adsorption) is created (Scheme 3). This can explain the comparably low amounts of BA sites on hy-Nb and hy-Nb-TEOA, where during synthesis in the presence of stabilisers LA sites are created from the removal of BA
Scheme 3. Proposed oxygen vacancy/LA site for-mation via BA site removal in form of water
[image:10.612.320.558.486.547.2]structure, which creates Nb4+ and allows free access for
TMP-LA adduct formation (Scheme 4).
Scheme 4. Proposed oxygen vacancy/LA site for-mation via oxygen removal with Nb4+ formation and
proton shift
It is of further interest to note that the LA site strength of hy-Nb is lower than that of hy-Nb-TEOA (Table 4). This is likely due to the more pronounced Nb4+ character (XPS)
of hy-Nb-TEOA with an overall lower coordination num-ber (EXAFS), indicating more structural flexibility with more and stronger LA sites, possibly involving charge delocalization as discussed earlier. Previous analysis8 on
the mono-layer structure of hy-Nb-TEOA compared to few-layer hy-Nb also supports this increased structural flexibility and defect formation. At this point it should be noted that the lower acid site quantities and lower surface area measured for hy-Nb-TEOA compared to hy-Nb do not seem to agree with the above observations. However, a significant degree of re-stacking due to monolayer in-stability of hy-Nb-TEOA upon drying is likely to cause this deviation towards lower surface area and lower ex-posed than actual acid site quantities. It is to note that after the synthesis, the stabilizers (TEOA and ammonia) are removed by acid treatment.56 For catalytic
applica-tions as discussed later, layer separation after acid treat-ment can re-stabilised in solution. In terms of BA site strength, hy-Nb-TEOA is more acidic than hy-Nb, which in turn is significantly more acidic than HNb3O8. This
increase in acid strength for hy-Nb and further hy-Nb-TEOA could be caused by shifts in proton position along the Nb-O network upon few-to monolayer synthesis, where for example oxygen removal/LA site formation can induce such shifts to stronger bridging hydroxyl positions (Scheme 4).
Overall, it appears that the complexity of structural changes in hy-Nb and hy-Nb-TEOA compared to bulk HNb3O8 is the result of their high structural flexibility. At
least two processes seem to be involved in LA site for-mation, where one mechanism gives rise to oxygen va-cancies via the removal of two adjacent BA sites in form of water. Another mechanism of oxygen vacancy for-mation appears to proceed via the reduction process of O=Nb---O, which could further induce proton shifts as cause for the observed increased protonic strength (Scheme 5).
Scheme 5. Proposed oxygen vacancy/LA site for-mation upon downscaling from bulk HNb3O8 to
few-to monolayer hy-Nb and hy-Nb-TEOA
Mesoporous Nb2O5*nH2O also shows large amounts of
both BA and LA sites, which can be explained by its high surface area and structural flexibility as for the layered nano-materials. Its intrinsic porosity (TEM) with loose packing of most likely corner-sharing NbO4, NbO5 and
NbO6 units (EXAFS and XPS) is formed during
etch-ing/acid-soaking in the synthesis process. Resulting low coordination numbers and oxygen vacancies give rise to significant amounts of LA besides BA sites. The observed LA site strength is comparable to that of hy-Nb-TEOA, which goes in line with their similar properties regarding the increased Nb4+ character (XPS) and low coordination
numbers (EXAFS). The comparatively low BA site strength suggests the presence of terminal rather than bridging hydroxyls21,59, which supports a network
consist-ing of lower connectivity corner-sharconsist-ing more than edge-sharing Nb-O units (Scheme 6).
Scheme 6. Proposed LA and BA site origins in meso-porous Nb2O5*nH2O
The different niobium oxides were tested with respect to their acid catalytic performance in glucose and fructose conversion to hydroxymethylfurfural (HMF) in water. The conversion of sugars to HMF over solid acids in water shows generally much lower yields than biphasic systems or ionic liquids, due to side reactions and product degra-dation.61–63 However, due to the cost-, separation- and
environment-friendly features of using just water as the solvent in combination with heterogeneous catalysts such as niobium oxides, these processes are worth-while of further investigation. As shown in our previous work, hy-Nb, hy-Nb-TEOA and mesoporous Nb2O5*nH2O exhibit
superior performance in glucose conversion with up to 36% HMF yield compared to bulk HNb3O8 and Nb2O5
(below 18% yield).56 This can be related to the presence of
fructose as important step before further conversion to HMF.61,64–66 Fructose conversion to HMF on the other
hand is a BA catalysed reaction, with the niobium oxides of weaker BA strength showing better performance, most likely due to reduced side reactions. Overall, mesoporous Nb2O5*nH2O proved the best niobium oxide catalyst for
glucose and fructose conversion (both 36% HMF yield), due to the presence of LA sites and its comparably weak BA sites.56 Decent performance was also shown by hy-Nb
(30% HMF yield), while the relatively weak BA catalyst HNb3O8 showed good results for fructose conversion
(34% HMF yield) but performed worse for glucose (18% yield). We propose the following mechanisms for glucose to fructose isomerization over exposed Nb centres/LA sites and for fructose to HMF formation over BA sites/weaker terminal hydroxyls (Scheme 7).
Scheme 7. Proposed mechanisms for sugar conver-sion over niobium oxides
a) Glucose isomerization to fructose catalysed by exposed Nb centres/LA sites, b) Fructose conversion to HMF catalysed by weaker BA sites/terminal hydroxyls
Conclusions
Summing up all observations and conclusions made from the above structural analysis (XRD, TEM, Raman, XPS, EXAFS and NMR) supported by acid site analysis, the fol-lowing characteristics stand out: the crystalline but low surface area/bulk materials Nb2O5 (H-Nb2O5)and HNb3O8
consist primarily of ordered edge- and corner-sharing NbO6 octahedra with an average oxidation state of Nb5+.
Nb2O5 has a block structure with acid site quantities
be-low the detection limit (TMP NMR), while HNb3O8 is
made of layers of niobates interconnected by protons with detectable Brønsted acid (BA) sites as expected. Both
Nb2O5 and HNb3O8 have been studied to detail in
litera-ture1,5,8,33 and are therefore used for comparative study of
the remaining niobium oxides. Hy-Nb and hy-Nb-TEOA have structural similarities to HNb3O8 but are few- to
monolayered instead of bulk materials. It gives them higher surface areas and more structural flexibility with longer Nb-O bond distances and O=Nb---O species aris-ing from distorted NbO6. Large amounts of Lewis acid
(LA) besides BA sites are detected and average coordina-tion numbers of below 6 and a shift in oxidacoordina-tion state towards Nb4+ are observed. This points towards the
pres-ence of oxygen vacancies in hy-Nb and hy-Nb-TEOA, ex-plaining the origin of the observed LA sites. These oxygen vacancies/LA sites are formed during synthesis in the presence of stabilizers, where one possible route involves the removal of BA sites in form of water with the simulta-neous formation of NbO5. Another route involves the
re-moval of oxygen from elongated bonds as in O=Nb---O to form NbO5, with the simultaneous formation of Nb4+
character and proton shifts, further reflecting the in-creased BA strength of hy-Nb and hy-Nb-TEOA. Overall, the flexible thin layer structures of hy-Nb and hy-Nb-TEOA consisting of NbO6 units with distortions and
de-fects, synthesized in the presence of stabilizers, give rise to large amounts of LA and BA sites compared to bulk layer HNb3O8. For mesoporous Nb2O5*nH2O the
structur-al anstructur-alysis proves more difficult due to its highly amor-phous nature, but some structural insights can still be obtained. The rather long and uniform Nb-O bond dis-tances point towards a loosely packed structure consisting of mostly corner-sharing units. With an oxidation state shifted towards Nb4+ and an average coordination number
of about 5, a mixed structure containing different species such as NbO4, NbO5 and NbO6 is likely for mesoporous
Nb2O5*nH2O. Again large amounts of LA and BA sites are
detected, due to the high porosity and loose network structure formed during acid-soaking in the synthesis process. LA sites show comparable acid strength to that of hy-Nb-TEOA and most likely arise from the lower coordi-nate NbO4 and NbO5 units. BA sites of comparably low
strength support the presence of a lower connectivity corner- over edge-sharing network with terminal rather than bridging hydroxyls. With an overall better under-standing of how acidity is related to structure, targeted synthesis becomes possible and solid acid catalysts meet-ing specific catalytic requirements can be developed.
ASSOCIATED CONTENT
Supporting Information. S1. Synthetic procedures of
niobi-um oxides, S2. Surface area measurements, S3. TMP 31P NMR
analysis, S4. EXAFS measurements with k and R fittings. This material is available free of charge via the Internet at http://pubs.acs.org.
AUTHOR INFORMATION
Corresponding Author
Notes
The authors declare no competing financial interest.
ACKNOWLEDGMENT
The authors would like to thank the EPSRC, UK and SINOPEC, China for financially supporting this research.
REFERENCES
(1) Nico, C.; Monteiro, T.; Graca, M. P. F. Prog. Mater.
Sci. 2016, 80, 1.
(2) Ramakrishna, S.; Le Viet, A.; Reddy, M. V.; Jose, R.; Chowdari, B. V. R. J. Phys. Chem. C 2010, 114 (1), 664. (3) Schäfer, H.; Schulte, F.; Gruehn, R. Angew. Chemie -
Int. Ed. 1964, 76 (12), 536.
(4) Bach, D. 2009, 210.
(5) Nowak, I.; Ziolek, M. Chem. Rev. 1999, 99 (12), 3603. (6) Fang, X.; Hu, L.; Huo, K.; Gao, B.; Zhao, L.; Liao, M.;
Chu, P. K.; Bando, Y.; Golberg, D. Adv. Funct. Mater.
2011, 21 (20), 3907.
(7) Katoh, R.; Furube, A.; Yoshihara, T.; Hara, K.; Fujihashi, G.; Takano, S.; Murata, S.; Arakawa, H.; Tachiya, M. J. Phys. Chem. B 2004, 108 (15), 4818. (8) Nakagawa, K.; Jia, T.; Zheng, W.; Fairclough, S. M.;
Katoh, M.; Sugiyama, S.; Edman Tsang, S. C. Chem.
Commun. 2014, 50 (89), 13702.
(9) Tanabe, K. Catal. Today 2003, 78 (1–4 SPEC.), 65. (10) Ushikubo, T. Catal. Today 2000, 57 (3–4), 331. (11) Jehng, J.-M.; Wachs, I. E. Chem. Mater. 1991, 3 (1),
100.
(12) Zhao, Y.; Zhou, X.; Ye, L.; Tsang, S. C. E. Nano Rev.
2012, 3, 17631.
(13) Iijima, S. Acta Crystallogr. Sect. A 1973, 29 (1), 18. (14) Anderson, J. S.; Browne, J. M.; Hutchison, J. L. J. Solid
State Chem. 1972, 5 (3), 419.
(15) Mcqueen, T.; Xu, Q.; Andersen, E. N.; Zandbergen, H. W.; Cava, R. J. J. Solid State Chem. 2007, 180, 2864. (16) Marucco, J. F. J. Chem. Phys. 1979, 70 (2), 649. (17) Gatehouse, B. M.; Wadsley, A. D. Acta Crystallogr.
Sect. A 1964, 17, 1545.
(18) Mertin, W.; Andersson, S.; Gruehn, R. J. Solid State
Chem. 1970, 1 (I), 419.
(19) Kato, K.; Tamura, S. Acta Crystallogr. Sect. B 1975, 31 (3), 673.
(20) McConnell, A. A.; Aderson, J. S.; Rao, C. N. R.
Spectrochim. Acta Part A Mol. Spectrosc. 1976, 32 (5),
1067.
(21) Takagaki, A.; Lu, D.; Kondo, J. N.; Hara, M.; Hayashi, S.; Domen, K. Chem. Mater. 2005, 17 (10), 2487. (22) Murayama, T.; Chen, J.; Hirata, J.; Matsumoto, K.;
Ueda, W. Catal. Sci. Technol. 2014, 4, 4250. (23) Okuhara, T. Chem. Rev. 2002, 102 (10), 3641.
(24) Nakajima, K.; Baba, Y.; Noma, R.; Kitano, M.; Kondo, J.; Hayashi, S.; Hara, M. J. Am. Chem. Soc. 2011, 133, 4224.
(25) Yang, Z. J.; Li, Y. F.; Wu, Q. Bin; Ren, N.; Zhang, Y.
H.; Liu, Z. P.; Tang, Y. J. Catal. 2011, 280 (2), 247. (26) Xiong, J.; Wen, L.; Jiang, F.; Liu, Y.; Liang, S.; Wu, L.
J. Mater. Chem. A 2015, 3 (41), 20627.
(27) Lippmaa, E.; Samoson, A.; Magi, M. J. Am. Ceram.
Soc. 1986, 108 (8), 1730.
(28) Kunwar, A. C.; Turner, G. L.; Oldfield, E. J. Magn.
Reson. 1986, 69 (1), 124.
(29) R. Bodart, Jean-Paul Amoureux, Yves, P. Mol. Phys.
2000, 98 (May 2017), 1545.
(30) Hanna, J. V.; Pike, K. J.; Charpentier, T.; Kemp, T. F.; Smith, M. E.; Lucier, B. E. G.; Schurko, R. W.; Cahill, L. S. Chem. - A Eur. J. 2010, 16 (10), 3222.
(31) Lunsford, J. H.; Sang, H.; Campbell, S. M.; Liang, C. H.; Anthony, R. G. Catal. Letters 1994, 27 (3–4), 305. (32) Kao, H. M.; Yu, C. Y.; Yeh, M. C. Microporous
Mesoporous Mater. 2002, 53 (1–3), 1.
(33) Wang, S.; Liu, C.; Liu, L.; Zhang, X.; Gong, J.; Tong, Z.
Synth. React. Inorganic, Met. Nano-Metal Chem. 2012, 42 (2), 251.
(34) Hardcastle, F. D.; Wachs, I. E. Solid State Ionics 1991,
45 (3–4), 201.
(35) Pittman, R. M.; Bell, A. T. J. Phys. Chem. 1993, 97, 12178.
(36) Hu, Z. P.; Li, Y. P.; Ji, M. R.; Wu, J. X. Solid State
Commun. 1989, 71 (10), 849.
(37) Grundner, M.; Halbritter, J. J. Appl. Phys. 1980, 51 (1), 397.
(38) Koito, Y.; Rees, G. J.; Hanna, John, V.; Li, M. J. M.; Peng, Y.-K.; Puchtler, T.; Taylor, R.; Wang, T.; Kobayashi, H.; Teixeira, I. F.; Khan, M. A.; Kreissl, H. T.; Tsang, S. C. E. ChemCatChem 2017, 9, 144. (39) Atashbar, M. Z.; Sun, H. T.; Gong, B.; Wlodarski, W.;
Lamb, R. Thin Solid Films 1998, 326 (1–2), 238. (40) www.xpsfitting.com. No Titl.
(41) www.xpssimplified.com. No Title. (42) Mrowec, S. Ceramurg. Int. 1978, 4 (2), 47.
(43) Kodama, R.; Terada, Y.; Nakai, I.; Komaba, S.; Kumagai, N. J. Electrochem. Soc. 2006, 153 (3), A583. (44) Bizeto, M. A.; Leroux, F.; Shiguihara, A. L.;
Temperini, M. L. A.; Sala, O.; Constantino, V. R. L. J.
Phys. Chem. Solids 2010, 71 (4), 560.
(45) Morante, J. R. 2002, 853, 2002.
(46) Morea, R.; Gonzalo, J.; Siegel, J.; Solís, J.; Optica, I. De. 2013, 9.
(47) Oakton, E.; Tillier, J.; Siddiqi, G.; Mickovic, Z.; Sereda, O.; Fedorov, A.; Copéret, C. New J. Chem.
2016, 40, 2655.
(48) de Groot, F.; Vankó, G.; Glatzel, P. J. Phys. Condens.
Matter 2009, 21 (10), 104207.
(49) Ichikuni, N.; Sato, F.; Shimazu, S.; Uematsu, T. Top.
Catal. 2002, 18 (1), 101.
(50) Gasperin, M. Acta Crystallogr. Sect. B 1982, 36, 2024. (51) Ravel, B.; Kelly, S. D. AIP Conf. Proc. 2007, 882, 150. (52) Khabibulin, D.; Romanenko, K.; Zuev, M.; Lapina, O.
(53) Papulovskiy, E.; Shubin, A. a; Terskikh, V. V; Pickard, C. J.; Lapina, O. B. Phys. Chem. Chem. Phys. 2013, 15 (14), 5115.
(54) Ashbrook, S. 2008, 1.
(55) Satterlee, J. D. Concepts Magn. Reson. 1990, 2 (3), 119. (56) Kreissl, H. T.; Nakagawa, K.; Peng, Y. K.; Koito, Y.;
Zheng, J.; Tsang, S. C. E. J. Catal. 2016, 338, 329. (57) Chu, Y.; Yu, Z.; Zheng, A.; Fang, H.; Zhang, H.;
Huang, S. J.; Liu, S. Bin; Deng, F. J. Phys. Chem. C
2011, 115 (15), 7660.
(58) Zheng, A.; Huang, S.-J.; Liu, S.-B.; Deng, F. Phys.
Chem. Chem. Phys. 2011, 13 (33), 14889.
(59) Takagaki, A.; Tagusagawa, C.; Hayashi, S.; Hara, M.; Domen, K. Energy Environ. Sci. 2010, 3 (1), 82. (60) Corma, A. Chem. Rev. 1995, 95 (3), 559.
(61) Van Putten, R. J.; Van Der Waal, J. C.; De Jong, E.; Rasrendra, C. B.; Heeres, H. J.; De Vries, J. G. Chem.
Rev. 2013, 113 (3), 1499.
(62) Rosatella, A. A.; Simeonov, S. P.; Frade, R. F. M.; Afonso, C. A. M. Green Chem. 2011, 13 (4), 754. (63) Teong, S. P.; Yi, G.; Zhang, Y. Green Chem. 2014, 16
(4), 2015.
(64) Choudhary, V.; Mushrif, S. H.; Ho, C.; Anderko, A.; Nikolakis, V.; Marinkovic, N. S.; Frenkel, A. I.; Sandler, S. I.; Vlachos, D. G. J. Am. Chem. Soc. 2013,
135 (10), 3997.
(65) Pagán-Torres, Y. J.; Wang, T.; Gallo, J. M. R.; Shanks, B. H.; Dumesic, J. A. ACS Catal. 2012, 2 (6), 930. (66) Assary, R. S.; Redfern, P. C.; Hammond, J. R.;