warwick.ac.uk/lib-publications
Original citation:
Medicines for Neonates Investigators (Including: Achana, Felix A., Petrou, Stavros, Khan, Kamran, Gaye, A. and Modi, N.). (2017) A methodological approach for assessing agreement between cost-effectiveness outcomes estimated using alternative sources of clinical and healthcare utilisation data. European Journal of Health Economics
Permanent WRAP URL:
http://wrap.warwick.ac.uk/85045
Copyright and reuse:
The Warwick Research Archive Portal (WRAP) makes this work by researchers of the University of Warwick available open access under the following conditions. Copyright © and all moral rights to the version of the paper presented here belong to the individual author(s) and/or other copyright owners. To the extent reasonable and practicable the material made available in WRAP has been checked for eligibility before being made available.
Copies of full items can be used for personal research or study, educational, or not-for profit purposes without prior permission or charge. Provided that the authors, title and full bibliographic details are credited, a hyperlink and/or URL is given for the original metadata page and the content is not changed in any way.
Publisher’s statement:
“The final publication is available at Springer via http://doi.org/10.1007/s10198-017-0868-8
A note on versions:
The version presented here may differ from the published version or, version of record, if you wish to cite this item you are advised to consult the publisher’s version. Please see the ‘permanent WRAP url’ above for details on accessing the published version and note that access may require a subscription.
1
A methodological framework for assessing agreement between cost-effectiveness outcomes estimated using alternative sources of data on treatment costs and effects for trial-based economic evaluations
Felix Achana1, Stavros Petrou1, Kamran Khan1, Amadou Gaye2 and Neena Modi on behalf of the Medicines for Neonates Investigators*.
1Clinical Trials Unit, Warwick Medical School, University of Warwick, Coventry, CV4 7AL, UK.
2National Institutes of Health, National Human Genome Research Institute, Bethesda MD 20892 USA.
3Section of Neonatal Medicine,Department of Medicine, Chelsea and Westminister Hospital campus, Imperial College, London, SW10 9NH, UK.
* Neena Modi, Peter Brocklehurst, Jane Abbott, Kate Costeloe, Elizabeth Draper, Azeem Majeed, Jacquie Kemp, Deborah Ashby, Alys Young, Stavros Petrou
Acknowledgments
This paper presents independent research funded by the National Institute for Health Research (NIHR) under its Programme Grants for Applied Research Programme (RP-PG-0707-10010). The views expressed are those of the author(s) and not necessarily those of the NHS, the NIHR or the Department of Health.
Abstract
2
3 1. Introduction
In trial-based economic evaluations, data on treatment costs and consequences (effects) are required for trial participants with the aim of estimating the relative cost-effectiveness of two or more interventions. It is common practice within this context for multiple sources of information to be obtained by analysts and used to inform the evaluation. For example, data on healthcare resource use and costs can normally be obtained from a variety of sources including trial case report forms, medical records, patient questionnaires and diaries (Petrou and Gray 2011). With advent of the ‘big data’ revolution, large volumes of individual-level information are being collected prospectively from patients and stored in administrative datasets and electronic health record systems. These routinely collected datasets constitute a rich source of information for health research – they are increasingly being relied upon as sources of information for trial-based economic evaluations and health technology assessments. For example, data drawn from the Hospital Episode Statistics (HES) in the UK have been obtained for use in the CAP trial to evaluate the clinical and cost-effectiveness of prostate specific antigen testing in men aged 50 to 69 years old (Turner, Metcalfe et al. 2014, Thorn, Turner et al. 2016). Furthermore, in a recently published editorial in the British Medical Journal on reforms of the UK Cancer Drug Fund, Grieve and colleagues (Grieve, Abrams et al. 2016) suggested “using timely randomised controlled trials within routinely collected data sources, to establish which drugs are relatively effective” and cost-effective.
4
For the reasons stated above, analysts working on trial-based economic evaluations have long recognised the need for validated data obtained from disparate sources for application within their evaluations (Byford, Leese et al. 2007). In this context, analysts have examined the disparate sources of information for evidence of difference (Thorn, Turner et al. 2016) or agreement (Mant, Murphy et al. 2000, Mistry, Buxton et al. 2005, Byford, Leese et al. 2007, Houweling, Bolton et al. 2014, Smith, McCrone et al. 2014) in individual parameter estimates. These studies have primarily focused on comparisons between multiple sources of information on individual-level healthcare resource use or costs.
In this paper, we outline a new methodological framework for assessing agreement between the final cost-effectiveness endpoints generated using alternative sources of data on treatment costs and effects for trial-based economic evaluations. The proposed framework builds on the earlier work of Bland and Altman (Altman and Bland 1983, Bland and Altman 1986) and Lin (Lin 1989) on methods for assessing the reproducibility of clinical assays, measurements and tests. The framework can be used to validate estimates of cost-effectiveness endpoints generated using routine data sources when comparable data on costs and effects for trial participants are available from a de novo data source, such as trial case report forms.
5
The remainder of the paper is structured as follows: Section 2 outlines the proposed methodological framework. In section 3, we illustrate an application using data from a recently conducted trial-based economic evaluation investigating the benefits of early administration of the probiotic Bifidobacterium breve strain BBG (B breve BBG) to prevent development of infection (sepsis) in babies less than 31 weeks of gestation. We present final concluding remarks in section 4, including the potential implications of increasing recourse to routinely collected data for the conduct of trial-based economic evaluations.
2. Methods
This section outlines our framework for assessing agreement between the mean incremental net (monetary) benefits estimated from two sets of data on treatment costs and effects for trial participants. Three commonly used statistics are adapted for this purpose: i) the mean difference; ii) the probability estimate of miscoverage; and iii) the concordance correlation coefficient (Lin 1989) between two estimates of the incremental net benefit. We define the probability estimate of miscoverage as the proportion of samples in simulated replication of trial data in which the confidence limits for the mean incremental net benefit from one data source, designated as test data, contain the mean incremental net benefit estimated from the second data source, designated as the referent or gold standard data source. We outline a strategy for estimating the miscoverage probability in section 2.2. We also show in section 2.3 how the concordance correlation coefficient can be adapted for assessing agreement between two estimates of the mean incremental net benefit evaluated at a specified cost-effectiveness threshold. A package to implement the routines described in the remainder of the paper in R (R Core Team 2015) is available from https://github.com/agaye/ceeComp.
2.1 Difference between two estimates of the incremental net benefit
Consider a trial in which paired data on treatment costs and effects, denoted as D1 and D2 are
available for N trial participants randomised to one of two interventions, denoted as A and B. Our illustrative example in section 3 highlights two potential data sources, namely trial case report forms and data obtained from a national patient electronic system. Denote A as control
intervention and let
i be an estimate of the mean incremental net benefit of intervention B6
Then a simple measure of discrepancy between the two estimates of cost-effectiveness (in the form of the incremental net benefit of intervention B relative to A) generated from two data
sources is
where
2
1 (1)The variance of
(after dropping thesto simplify the notation) is given by
1 2 1 2
2 2 2
, 2
(2)where
1
2
,2
2
represent variance of the incremental net benefit from datasets 1 and 2respectively. Incremental net benefits generated this way are likely to be correlated as the two
datasets contain information from the same patients,
1, 2
quantifies the covariance betweenthe two. The parameters
,
1,
2 and associated variance and covariance terms in equations (1) and (2) are unobserved, hence will be replaced in practice with their sample counterpartsˆ
,
ˆ1 and
ˆ2 respectively. We show in Appendices A and B that the variance and covarianceterms on the right hand side of equation (2) can be written in terms of the variance of costs and effects and the covariance between the two within the respective arms of a trial with parallel group design (assuming no treatment switching or cross-over effects common in cancer trials). Under the large sample assumption, an approximate statistical test of the null hypothesis that there is no difference between incremental net benefits generated from the two data sources (i.e.0) can be constructed by referring an estimate Zˆ of the Z statistic to the standard normal distribution where Zˆ is given by
ˆ ˆ
ˆ
Z
(3)
2.2 Probability of miscoverage
7
than the ICER for the reasons stated in the introduction. For any two data sources that are available for the economic evaluation, we first designate one data source as referent data and
the other as test data. From the referent dataset, we calculateˆref,, the sample estimate of the
underlying population mean incremental net benefit
ref,at cost-effectiveness threshold. Next, we sample with replacement several times to generate N bootstrap replicates of the test data. For each replicate dataset, we calculate a bootstrap estimate of the incremental net benefit and the associated variance given by equation (4A) of Appendix A. Finally, we obtain the probability of miscoverage by counting the proportion of the S bootstrap replicates in which the (95%) confidence intervals for the incremental net benefit statistic does not contain the corresponding estimate from the referent dataset.2.3 Concordance correlation
Lin (1989) introduced the concordance correlation coefficient,
c and used it to quantifyagreement or reproducibility of a clinical assay, test or measuring instrument compared to the current measure or a gold standard. In doing so, Lin (Lin 1989, Lin 1992, Lin 2000) defined perfect agreement between two measurements as a 45 degree line passing through the origin of the Cartesian (X, Y) plane so that deviations from this line indicate evidence of disagreement. The concordance correlation coefficient quantifies this deviation in terms of the precision and
accuracy of the new measure compared to the gold standard. As a correlation coefficient,
csatisfies the inequality
1
c
1
where
c
1
indicates perfect agreement,
c
0
noagreement and
c
1
perfect inverse agreement.To adapt Lin’s method for our purpose, let
Dj1
Cj1,E tj1, j
,Dj2
Cj2,Ej2,tj
denoteagain our paired outcome information (comprising of treatment costs Cjt and effects Ejt) for
the jth patient ( j 1, 2, ,N) in treatment group tj from a bivariate population with mean
incremental net monetary benefit
1, 2
and variance
1 2
2 2
,
at specified
8
net-benefits generated from the two data sources can be quantified by the expected value of the squared difference on the incremental net benefit scale:
E
D2D1
2
2
1
2
21
22 2
1 2 (4)where the parameters in equation (4) are defined as in the previous equations. Lin (1989) showed that equation (4) can be written in terms of the Pearson correlation coefficient
which he suggested provided a measure of precision (i.e. “how far each observation deviates from thebest fitted line”) and a bias correction factor
C
b that measures accuracy (i.e. “how far the best fitted line deviates from the 45 degree line”):
c
C
b where
21 221 222 1
2
b
C
When used to assess agreement between pairs of measurements, an estimate
ˆ
c of
c isobtained by replacing the parameters in equation (4) with their sample estimates. Hence in our adaptation of Lin’s method, we define
ˆ
c in terms of the incremental net benefit generatedfrom two data sources:
1 2 1 2, 2 2 2 2 1 ˆ 2 ˆ
ˆ ˆ ˆ ˆ
c
(5)
where
ˆ2 and
ˆ1 represent sample estimates of the incremental net benefit from the respectivedatasets,
1
2 ˆ
and2
2 ˆ
represent sample estimates of the corresponding variances and1, 2
ˆ
9
1ln 1
2 1
c
c
c
Z
and variance
2 2 3 2 4 4
2
2 2
2 2 2 2 2
1 2 1
1
2 1 1 2 1
c
c c c c
Z
c c c
N where
1 2
1 2
1
2 2 2
, 1 2
1 2 ,
, N is the trial sample size and
c is estimated by
ˆ
c inequation (5). Confidence intervals can be constructed again from the sample estimates c
Z
ˆand 2ˆ
c
Z
of cZ
and 2c
Z
before re-transforming back to the original scale.Statistical tests of the hypothesis that
c is greater than an arbitrarily defined threshold value,0
c
, can be constructed using the transformed parameters and one-sided p-values generatedfor a specified level of significance. Concordance correlation coefficient thresholds often cited
in the literature as indicating acceptable levels of agreement include
c0
0
.
4
(Byford, Leeseet al. 2007) and
c0
0
.
65
(Feng, Baumgartner et al. 2014) with coefficients greater than 0.8 generally taken as good evidence of agreement (McBride 2005, Feng, Baumgartner et al. 2014). Rather than define an arbitrary threshold value, an alternative strategy suggested by Lin(1992) is to estimate
c0 through the expression c Cb x 20
where
x
represents apre-specified percentage loss in precision that is acceptable for the particular measure or clinical scenario under investigation and
is again the Pearson correlation coefficient. For example,0.05
x
for a 5% acceptable loss in precision. In our adaptation of this approach, if we designate one dataset as the referent data and another as the test dataset, thenx
represents the percentage loss in precision in mean incremental net monetary benefit generated from the test data that can be considered acceptable compared with the corresponding estimate obtained10 3. Example application to the PiPS trial
3.1 Example data
The Probiotic in Preterm babies Study (PiPS) is a multi-centre, double blind, placebo-controlled randomised trial of probiotic administration in infants born between 23+0 and 30+6 weeks gestational age. The trial recruited 1300 infants within 48 hours of birth from 24 hospitals within 60 miles of London over a 37 month period from July 2010 onwards. Infants were randomised to receive either the probiotic Bifidobacterium breve BBG-001 or a matching placebo. Details of the trial design and baseline characteristics of trial participants are published elsewhere (Costeloe, Wilks et al. 2014). The main trial analyses and findings have also been published (Costeloe, Hardy et al. 2016). The main trial economic evaluation has not yet been published, so a summary of the methods used to conduct the evaluation is presented in Appendix C. For the purpose of illustrating the methodology described in this paper, we restrict ourselves to 1258 of the 1300 infants who had complete data on treatment costs and clinical outcomes of interest. Of these, 638 infants were in the placebo group and 620 in the probiotic group. Three clinical outcomes were considered in the trial: i) any episode of neonatal necrotising enterocolitis (NEC) Bell stage 2 or 3(Bell, Ternberg et al. 1978); ii) any positive blood culture of an organism not recognised as a skin commensal on a sample drawn more than 72 hours after birth and before 46 weeks postmenstrual age or discharge if sooner (hereafter referred to as sepsis for brevity); and iii) death before discharge from hospital. We restrict ourselves to the sepsis outcome for the purpose of illustrating the methodological framework described in this paper.
11
(NHS) neonatal units. Badger.net is managed by Clevermed Ltd, an authorised NHS hosting company. The Neonatal Dataset is an approved NHS Information Standard (ISB1575) and contributing neonatal units are known as the UK Neonatal Collaborative.
Our comparisons of cost-effectiveness outcomes were based on four datasets that we created using information from the two primary data sources: i) the trial case report forms as the sole source of information (hence forth referred to as PiPS dataset); ii) the NNRD as the source of information on resource inputs only with clinical outcomes extracted from the PiPS case report forms (herein referred to as the NNRD1 dataset); iii) the NNRD as a source of resource use and clinical outcomes (herein referred to as the NNRD2dataset); and iv) a combined dataset created by the selection of a preferred data source (by clinical experts) for each data input.
3.2 Results
12
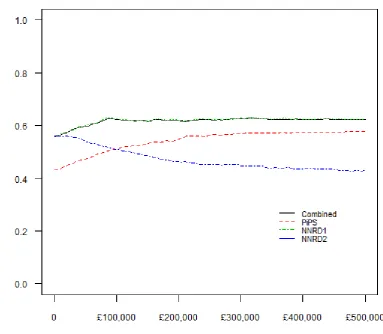
is more costly and more effective than placebo, whereas the mean ICER for the NND2 dataset occupies the south-west quadrant where the probiotic is less costly but also less effective (Figure 1). The mean ICERs from three of the four datasets fell in different quadrant of the cost-effectiveness plane, but a large proportion of the simulated ICERs from each dataset fell in all 4 quadrants reflecting the considerable uncertainty surrounding the mean ICERs. Figure 1 illustrates the point made in the introduction that the ICER may not be an appropriate statistic for assessing agreement between estimates of cost-effectiveness generated from alternative data sources. Cost-effectiveness acceptability curves based on 3 of the 4 datasets indicates the probiotic is the most cost-effective strategy for sepsis prevention in pre-term infants with probability of 0.6 but only at considerably high cost-effectiveness thresholds (upwards of £80,000 per sepsis avoided) whilst the probiotic is dominated by placebo in the NNRD2 dataset (Figure 2). Overall, the results suggests the probiotic is not cost-effective unless policy makers are willing to spend large amounts of money to prevent infants from developing sepsis.
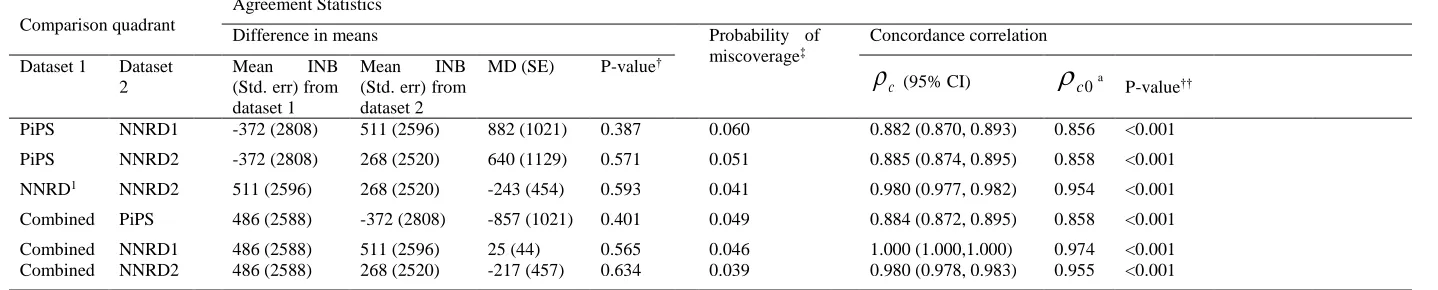
Table 2 presents the agreement statistics (mean difference, probability estimates of miscoverage and concordance correlation coefficients) between estimates of the mean incremental net benefit from combinations of the four alternative datasets using a cost-effectiveness threshold of £30,000 per episode of sepsis avoided. At this threshold, the probability estimate of miscoverage was very small, ranging from 3.9% when the combined dataset acted as referent source and the NNRD1 acted as the test data to 6.0% when the PiPS dataset acted as referent and the NNRD2 as the test data. The corresponding p-values ranged from 0.387 for the comparison between the PiPS versus NNRD1 datasets to 0.634 for the comparison between the PiPS versus NNRD2datasets. These results thus provide no evidence to suggest that the incremental net benefit estimated using one dataset is significantly different from the incremental net benefit estimated from the other datasets at a cost-effectiveness threshold of £30,000 per episode of sepsis avoided.
13
as indicating evidence of good agreement (Byford, Leese et al. 2007). The alternative strategy is to define a threshold based on percentage loss in precision that is acceptable for the clinical
issue being investigated. Estimates of
c0 based on a 5% loss in precision criterion ranged from 0.856 for the PiPS versus NNRD2comparison to 0.975 for the combined versus NNRD1comparison. These values of
c0 were significantly lower than the lower confidence limit forc
(p<0.0001) in each pairwise comparison (Table 2), indicating stronger evidence ofagreement between datasets.
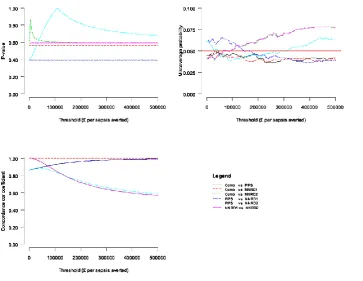
Estimates of the agreement statistics at cost-effectiveness thresholds between £0 and £500,000 per episode of sepsis avoided were also generated and can be read off the plots in Figure 3. The p-values remained relatively constant across different values of for pairwise comparisons between the PiPS, NNRD1, NNRD2 and the combined datasets. Although no attempt was made to correct for multiple testing at different thresholds, this can easily be achieved by for example, defining a statistical significance at the 1% level instead of the 5% level (Thorn, Turner et al. 2016). Overall, across cost-effectiveness thresholds ranging from £0 to £500,000 per sepsis avoided and for all pairwise comparisons between datasets, differences between mean incremental net benefits were not statistically significant (p-values >= 0.4), the probability estimates of miscoverage fell within the interval (0.025 to 0.075) and concordance correlation coefficient were greater than 0.5.
4. Discussion
14
Assessment of agreement in the health economics literature (Mant, Murphy et al. 2000, Mistry, Buxton et al. 2005, Byford, Leese et al. 2007) have thus far focused on comparisons between alternative sources of resource use and cost variables, primarily because healthcare utilisation data can and has often been collected from a multitude of sources such as patient self-reports, medical records, and trial case report forms. Data on clinical endpoints have, however, tended to come from a single source, often the trial case report forms. With recent advances in data management and information sciences, routine datasets are increasingly being compiled that have potential to provide patient-level resource utilisation and clinical outcomes data for trial-based economic evaluations. As these potentially rich sources of data become available for clinical research, methods for assessing the level of agreement between final cost-effectiveness outcomes (of interest in the trial-based economic evaluations) generated using alternate sources of data will be of interest to analysts working on health economic evaluations and health technology assessments. We have shown how such assessments can be carried out in practice using the PiPS trial data. Our preliminary analyses shows the NNRD database could potentially serve as a reliable source of data on treatment costs and effects for future trial-based economic evaluations of neonatal interventions. Application to other trial-based economic evaluations where the NNRD has been used as a source of data would allow the potential of this resource to be explored for trial-based economic evaluations.
15
assessment of agreement of more complex data structures such as repeated measurement problems and multivariate response variables measured on the continues scale (Li and Chow 2005, King, Chinchilli et al. 2007, Carrasco, King et al. 2009, Hiriote and Chinchilli 2011). These methods can, in principle, be adapted for assessment of agreement between two sources of data on treatment costs and effects. We have not however done so in our study because whilst healthcare costs are measured on the continuous scale, the clinical endpoint of interest in the PiPS trial example that serves to motivate our approach is a binary outcome (i.e. whether or not an infant avoids an episode of sepsis). It is not immediately obvious how to adapt these multivariate techniques for assessing agreement between outcomes measured on different scales. Further methodological work exploring the feasibility of assessing agreement involving multivariate mixed outcomes where the outcomes measured are of different data types and measured on different scales would present a useful advancement of the methodology presented here.
Our methodological framework assumes that the cost-effectiveness threshold is not kinked despite evidence from O’Brien et al (O'Brien, Gertsen et al. 2002) that a kinked threshold better reflects asymmetrical individual preferences found in empirical studies of consumer’s willingness to pay for health changes, which would in turn justify different decision rules in the north-east and south-west quadrants of the cost-effectiveness plane (Dowie 2004). Further research is required to assess how the methodological framework presented here might be extended in the presence of a kinked cost-effectiveness threshold.
16 References
Altman, D. G. and J. M. Bland (1983). "Measurement in Medicine: The Analysis of Method Comparison Studies." Journal of the Royal Statistical Society. Series D (The Statistician) 32(3): 307-317.
Bell, M. J., J. L. Ternberg, R. D. Feigin, J. P. Keating, R. Marshall, L. Barton and T. Brotherton (1978). "Neonatal necrotizing enterocolitis. Therapeutic decisions based upon clinical staging." Annals of Surgery 187(1): 1-7.
Bland, J. M. and D. G. Altman (1986). "Statistical methods for assessing agreement between two methods of clinical measurement." The Lancet 327(8476): 307-310.
Byford, S., M. Leese, M. Knapp, H. Seivewright, S. Cameron, V. Jones, K. Davidson and P. Tyrer (2007). "Comparison of alternative methods of collection of service use data for the economic evaluation of health care interventions." Health Economics 16(5): 531-536.
Carrasco, J. L., T. S. King and V. M. Chinchilli (2009). "The Concordance Correlation Coefficient for Repeated Measures Estimated by Variance Components." Journal of Biopharmaceutical Statistics 19(1): 90-105.
Costeloe, K., P. Hardy, E. Juszczak, M. Wilks and M. R. Millar (2016). "Bifidobacterium breve BBG-001 in very preterm infants: a randomised controlled phase 3 trial." The Lancet 387(10019): 649-660.
Costeloe, K., M. Wilks, P. Hardy, C. Nelis and M. Millar (2014). "O-008 Early Bifidobacterium Breve Bbg-001 To Prevent Necrotising Enterocolitis, Late-onset Sepsis And Death: The Pips Trial." Archives of Disease in Childhood 99(Suppl 2): A23-A24.
Curtis, L. (2013). PSSRU Unit Costs of Health & Social Care 2013. Avaialable from
http://www.pssru.ac.uk/project-pages/unit-costs/2013/.
Curtis, L. (2013). Unit costs of health and social care 2013, Personal Social Services Research Unit.
Department of Health (2014). NHS reference costs 2012-2013. Appendix 1, National schedule of reference costs
Dowie, J. (2004). "Why cost-effectiveness should trump (clinical) effectiveness: the ethical economics of the South West quadrant." Health Economics 13(5): 453-459.
Feng, D., R. Baumgartner and V. Svetnik (2014). "A Robust Bayesian Estimate of the Concordance Correlation Coefficient." Journal of Biopharmaceutical Statistics 25(3): 490-507. Glick, H. A., J. A. Doshi, S. S. Sonnad and D. Polsky (2015). Economic Evaluation in Clinical Trials. Oxford, Oxford University Press.
Grieve, R., K. Abrams, K. Claxton, B. Goldacre, N. James, J. Nicholl, M. Parmar, C. Parker, J. S. Sekhon, L. Smeeth, D. Spiegelhalter and M. Sculpher (2016). "Cancer Drugs Fund requires further reform reliance on “real world” observational data undermines evidence base for clinical practice." British Medical Journal 354.
Hiriote, S. and V. M. Chinchilli (2011). "Matrix-based Concordance Correlation Coefficient for Repeated Measures." Biometrics 67(3): 1007-1016.
Houweling, T., J. Bolton and D. Newell (2014). "Comparison of two methods of collecting healthcare usage data in chiropractic clinics: patient-report versus documentation in patient files." Chiropractic & Manual Therapies 22: 32.
King, T. S., V. M. Chinchilli and J. L. Carrasco (2007). "A repeated measures concordance correlation coefficient." Statistics in Medicine 26(16): 3095-3113.
Li, R. and M. Chow (2005). "Evaluation of reproducibility for paired functional data." Journal of Multivariate Analysis 93(1): 81-101.
Lin, L. I. K. (1989). "A Concordance Correlation Coefficient to Evaluate Reproducibility." Biometrics 45(1): 255-268.
17
Lin, L. I. K. (2000). "Correction: A Note on the Concordance Correlation Coefficient." Biometrics 56(1): 324-325.
Mant, J., M. Murphy, P. Rose and M. Vessey (2000). "The accuracy of general practitioner records of smoking and alcohol use: comparison with patient questionnaires." Journal of Public Health 22(2): 198-201.
McBride, G. B. (2005). A Proposal for Strength-Of-Agreement Criteria for Lin’s Concordance Correlation Coefficient. NIWA Client Report: HAM2005-062. Report to Ministry of Health. Mistry, H., M. Buxton, L. Longworth, J. Chatwin and R. Peveler (2005). "Comparison of general practitioner records and patient self-report questionnaires for estimation of costs." The European Journal of Health Economics 6(3): 261-266.
National Institute for Health and Care Excellence, (NICE) (2013). "Guide to the methods of technology appraisal." National Institute for Health and Care Excellence (NICE).
O'Brien, B. J., K. Gertsen, A. R. Willan and A. Faulkner (2002). "Is there a kink in consumers' threshold value for cost-effectiveness in health care?" Health Economics 11(2): 175-180. Petrou, S. and A. Gray (2011). "Economic evaluation alongside randomised controlled trials: design, conduct, analysis, and reporting." BMJ 342.
Polsky, D., H. A. Glick, R. Willke and K. Schulman (1997). "Confidence Intervals for Cost– Effectiveness Ratios: A Comparison of Four Methods." Health Economics 6(3): 243-252. R Core Team (2015). R: A language and environment for statistical computing. R Foundation for Statistical Computing, Vienna, Austria. URL http://www.R-project.org/.
Raftery, J., P. Roderick and A. Stevens (2005). "Potential use of routine databases in health technology assessment." Health Technol Assess 9(20): 1-92, iii-iv.
Schroeder, E., S. Petrou, N. Patel, J. Hollowell, D. Puddicombe, M. Redshaw and P. Brocklehurst (2012). "Cost effectiveness of alternative planned places of birth in woman at low risk of complications: evidence from the Birthplace in England national prospective cohort study." BMJ 344.
Smith, W., P. McCrone, C. Goddard, W. Gao, R. Burman, D. Jackson, I. Higginson, E. Silber and J. Koffman (2014). "Comparisons of Costs between Black Caribbean and White British Patients with Advanced Multiple Sclerosis in the UK." Multiple Sclerosis International 2014: 613701.
StataCorp. (2011). "Stata Statistical Software: Release 12. College Station, TX: StataCorp LP.".
Stinnett, A. A. and J. Mullahy (1998). "Net Health Benefits: A New Framework for the Analysis of Uncertainty in Cost-Effectiveness Analysis." Medical Decision Making 18(2): S68-S80.
The Neonatal Data Analysis Unit (2013). The National Neonatal Research Database (NNRD). Available online at https://www1.imperial.ac.uk/neonataldataanalysis/data/. Accessed 25th January 2016.
Thompson, S. G. and J. A. Barber (2000). "How should cost data in pragmatic randomised trials be analysed?" BMJ: British Medical Journal 320(7243): 1197.
Thorn, J. C., E. L. Turner, L. Hounsome, E. Walsh, L. Down, J. Verne, J. L. Donovan, D. E. Neal, F. C. Hamdy, R. M. Martin, S. M. Noble and C. A. P. t. group (2016). "Validating the use of Hospital Episode Statistics data and comparison of costing methodologies for economic evaluation: an end-of-life case study from the Cluster randomised triAl of PSA testing for Prostate cancer (CAP)." BMJ Open 6(4): e011063.
19
Appendix A: Variance of the incremental net (monetary) benefit
To derive the variance of the difference between two incremental net monetary benefits, we first derive the variance of the net benefit in terms of variances and covariances between costs and effects within trial arms.
Let CA, EA ,
CA,
EA and
C EA Arepresent population level estimates of the mean costs, mean effects, standard error of costs, standard error of effects and covariance between costs and effects in intervention arm A (takenas control). We haveCB, EB ,
CB,
EB and
C EB B as the corresponding quantities in intervention arm B respectively. By definition of the incremental net benefit at a specified cost-effectiveness threshold, , we have
E C
EBEA
CBCA
(1A)Taken variances of both sides of equation (1A), we have
2
2
var
var
var
2 cov
,
var
B Avar
B A2 cov
B A,
B AE
C
E C
E
E
C
C
E
E
C
C
(2A)The variance terms on the right hand side of equation (2A) are given by var
2 2B A
B A E E
E E
and
2 2var
B A
B A C C
C C
, and the covariance term by
cov
,
cov
,
cov
,
cov
,
cov
,
cov
,
cov
,
A A B B
B A B A B B B A A B A A
B B A A
E C E C
E
E
C
C
E C
E C
E C
E C
E C
E C
(3A)The two middle terms on the right hand side of the first line of equation (3A) are zero because treatment arms in trials with a parallel-group design (i.e. no treatment switching or cross-over effects) are independent. Substituting the expressions for the variance and covariance terms derived in equation (3A) into equation (2A) gives the variance of the incremental net benefit in terms of the arm-specific variances and covariances between costs and effects:
2
2 2
2 2
C C
var 2
B A B A A A B B
E E C C E E
20
Appendix B: Covariance between two incremental net (monetary) benefits
The variance of the difference between two incremental net benefits is derived by taking variances of both sides of the expression
2
1given by equation (1):
1
2
1 2
var var var 2cov , (5A)
The variance terms on the right hand side of equation (5A) are given by equation (4A) for the ith dataset (i=1,2), so all we need is an expression for the covariance termcov
1, 2
. Now from the definition of theincremental net benefit (1A), we have
1 2 1 1 2 2
1 2 1 2 2 1 1 2
Cov , cov ,
cov , cov , cov , cov ,
E C E C
E E E C E C C C
(6A)
The first term on the right hand side of equation (6A) is
1 2 1 2
1 2 1 1 2 2
2
1 2 1 2 1 2 1 2
2
1 2 1 2
2
cov , cov ,
cov , cov , cov , cov ,
cov , cov ,
A A B B
B A B A
B B B A A B A A
B B A A
E E E E
E E E E E E
E E E E E E E E
E E E E
(7A)
The remaining terms on the right hand side of equation (6A) can be derived in a similar manner:
1 2 1 2
1 2 1 1 2 2
1 2 1 2 1 2 1 2
1 2 1 2
Cov
,
cov
,
cov
,C
cov
,C
cov
,C
cov
,C
cov
,C
cov
,C
A A B B
B A B A
B B B A A B A A
B B A A
E C E C
E
C
E
E
C
C
E
E
E
E
E
E
(8A)
2 1
2 1 2 1
Cov ,
A A B B
E C E C
E C
(9A)
2 1
2 1 2 1Cov ,
A A B B
C C C C
C C
(10A)
Substituting the results of equations (7A) to (10A) into equation (6A) gives equation (11A) as the covariance between two incremental net (monetary) benefits evaluated at a cost-effectiveness threshold, :
2
1 2 1 2
1 2 1 2
2 1 2 1
2 1 2 1
1 2 C C C C
Cov ,
A A B B A A B B A A B B A A B B
E E E E E E E E C C C C
21
When carrying out the analysis in practice, all parameters in equations (1A) to (11A) are replaced with their
sample counterparts ˆ A
C , EˆA ,
ˆCA
A
N
,
ˆEA
A
N
and , ˆC E
A A
A
N
in arm A and ˆ B
C , EˆA ,
ˆCB
B
N
,
ˆEB
B
N
and , ˆC E
B B
B
N
in arm
22
Appendix C: Methods of the PiPS trial economic evaluation
Study population
Probiotics in Preterm Infants Study (PIPS) trial
Probiotics in Preterm Infants Study (PIPS) was a multi-centre blinded randomised placebo controlled trial designed to test the effectiveness of the probiotic Bifidobacterium breve BBG-001 to reduce NEC, late-onset sepsis and death in preterm infants. Infants born between 23 weeks and 0 days and 30 weeks and 6 days of gestation with written parental consent were eligible for recruitment.
The National Neonatal Research Database (NNRD)
The National Neonatal Research Database (NNRD) has been created through the collaborative efforts of neonatal services across the country to be a national resource. The NNRD contains a defined set of data items (the Neonatal Dataset) that have been extracted from the Badger.net neonatal electronic health record of all admissions to NHS neonatal units. Badger.net is managed by Clevermed Ltd, an authorised NHS hosting company. The Neonatal Dataset is an approved NHS Information Standard (ISB1575). Contributing neonatal units are known as the UK Neonatal Collaborative. Variables that allowed for the creation of comparable resource use Items (directly available or derivable) were extracted from the NNRD
Combined dataset
An additional dataset was created by selecting a variable from either PIPS or NNRD that represented a resource use item more accurately.
For the purposes of our study only those infants were analysed for whom there was data available from both the PIPS trial and the NNRD.
Type of economic evaluation, study perspective and time horizon
23
before discharge from hospital), and for one secondary outcomes which was a composite of the three primary outcomes. The economic evaluation was conducted from a health system perspective and consequently only direct costs to the NHS were included (National Institute for Health and Care Excellence 2013). The time horizon of the study was birth to discharge or death whichever was earlier.
Measurement of resource use and costs
Relevant resource items were integrated into the trial data collection instruments described previously. The neonatal and maternal data collection forms captured a comprehensive profile of resource use by each infant, encompassing length of stay by intensity of care, surgeries, investigations, procedures, transfers and post mortem examinations until final hospital discharge or death (whichever was earliest). Variables that allowed for comparison of selected resource use items in the PIPS data directly or through derivation were extracted from the NNRD. Resource inputs were valued based on data collated from secondary national tariff sets (Curtis 2013, Department of Health 2014). All costs were expressed in pounds sterling and reflected values for the financial year 2012-13.
24
investigations excluded from these per diem costs were valued using a combination of primary and secondary costs. Where these costs were not available from national tariffs, clinicians were asked to identify the staff and material inputs required for these investigations. Staff time was valued using the Unit Costs of Health and Social Care tariffs(Curtis 2013).
Cost-effectiveness analytical methods
Neonatal characteristics and resource use items were summarised by trial arm (placebo or B. breve BBG). Differences between groups were analysed using t-tests for continuous variables and χ2 test for categorical variables. Mean (standard error (SE)) costs by cost category and mean (SE) total costs were estimated by trial arm and comparisons were carried out using Student t-tests.
Cost effectiveness was expressed as incremental cost per (i) adverse perinatal outcome avoided. Nonparametric bootstrapping, involving 1,000 bias-corrected replications of each of the incremental cost effectiveness ratios, was used to calculate uncertainty around all cost-effectiveness estimates(Thompson and Barber 2000). This was represented on four quadrant cost-effectiveness planes. Decision uncertainty was addressed by estimating net benefit statistics and constructing cost-effectiveness acceptability curves across cost-effectiveness threshold values of between £0 and £70,000 for the health outcomes of interest. A series of sub-group analyses repeated all analyses by selected sub-groups for the primary and secondary cost-effectiveness outcomes. All analyses were estimated using Stata version 12 (StataCorp. 2011) and R version 2.01 (R Core Team 2015).
References for appendix C
Curtis, L. (2013). Unit costs of health and social care 2013, Personal Social Services Research Unit.
Department of Health (2014). NHS reference costs 2012-2013. Appendix 1, National schedule of reference costs
National Institute for Health and Care Excellence, (NICE) (2013). "Guide to the methods of technology appraisal." National Institute for Health and Care Excellence (NICE).
R Core Team (2015). R: A language and environment for statistical computing. R Foundation for Statistical Computing, Vienna, Austria. URL http://www.R-project.org/.
25
StataCorp. (2011). "Stata Statistical Software: Release 12. College Station, TX: StataCorp LP.".
26 Tables
Table 1: Cost-effectiveness results from the PiPS trial datasets
Dataset1 Placebo arm Probiotic arm Cost-effectiveness
Costs (£) Outcome2 Costs (£) Outcome2 Incremental costs (95% confidence interval)3
Incremental effects (95% confidence interval)4
ICER
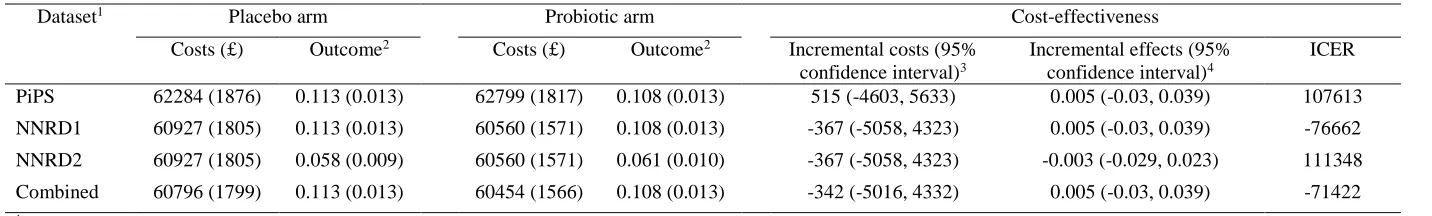
PiPS 62284 (1876) 0.113 (0.013) 62799 (1817) 0.108 (0.013) 515 (-4603, 5633) 0.005 (-0.03, 0.039) 107613
NNRD1 60927 (1805) 0.113 (0.013) 60560 (1571) 0.108 (0.013) -367 (-5058, 4323) 0.005 (-0.03, 0.039) -76662
NNRD2 60927 (1805) 0.058 (0.009) 60560 (1571) 0.061 (0.010) -367 (-5058, 4323) -0.003 (-0.029, 0.023) 111348
Combined 60796 (1799) 0.113 (0.013) 60454 (1566) 0.108 (0.013) -342 (-5016, 4332) 0.005 (-0.03, 0.039) -71422
1Datasets
PiPS dataset = trial case report forms as the sole source of information
NNRD1 dataset = NNRD as the source of information on resource inputs only with clinical outcomes extracted from the PiPS case report forms NNRD2 dataset = NNRD as a source of resource use and clinical outcomes
Combined dataset = Combined dataset created by the selection of a preferred data source (by clinical experts) for each data input.
2Outcome = proportion of sepsis
3Incremental costs (£) is defined as mean costs in probiotic arm minus mean costs in placebo arm
27
Table 2: Statistics comparing the agreement between cost-effectiveness estimates from the PiPS trial datasets
Comparison quadrant
Agreement Statistics
Difference in means Probability of
miscoverage‡
Concordance correlation
Dataset 1 Dataset 2
Mean INB (Std. err) from dataset 1
Mean INB (Std. err) from dataset 2
MD (SE) P-value†
c
(95% CI)
c0aP-value††
PiPS NNRD1 -372 (2808) 511 (2596) 882 (1021) 0.387 0.060 0.882 (0.870, 0.893) 0.856 <0.001
PiPS NNRD2 -372 (2808) 268 (2520) 640 (1129) 0.571 0.051 0.885 (0.874, 0.895) 0.858 <0.001
NNRD1 NNRD2 511 (2596) 268 (2520) -243 (454) 0.593 0.041 0.980 (0.977, 0.982) 0.954 <0.001
Combined PiPS 486 (2588) -372 (2808) -857 (1021) 0.401 0.049 0.884 (0.872, 0.895) 0.858 <0.001
Combined NNRD1 486 (2588) 511 (2596) 25 (44) 0.565 0.046 1.000 (1.000,1.000) 0.974 <0.001 Combined NNRD2 486 (2588) 268 (2520) -217 (457) 0.634 0.039 0.980 (0.978, 0.983) 0.955 <0.001
INB = Incremental net benefit evaluated at willingness-to-pay threshold of £30,000 per adverse event averted. Std. err. = Standard error of the estimate
MD = Difference between mean INB from dataset 1 and mean INB from dataset 2.
c
(95% CI) = Concordance correlation coefficient (95% confidence intervals) between the incremental net benefits at threshold of £30,000 per adverse event averted. †Two-sided p-value at 5% significance level
‡The first dataset in each pairwise comparison is designated as referent when estimating the probability of miscoverage.
P-value†† = One-sided test of the hypothesis thatc c0 where c0 is the least acceptable concordance correlation coefficient assuming 5% (c0a). A p-value greater than 0.025 suggest significant evidence of
28 Figures
29
30