Magnetization Transfer
Imaging
of the
Head
and Neck: Normative
Data
David M. Yousem, Mitchell D. Schnall, Lawrence Dougherty, Gregory S. Weinstein, and Richard E. Hayden
PURPOSE: To determine magnetization transfer ratios for normal head and neck structures so that evaluation of disease will be possible. METHODS: Two-dimensional magnetization transfer imaging was performed in 12 healthy volunteers and 20 patients. We used a repetition time of 500, echo time of 12, 20° flip angle, and a magnetization transfer pulse offset from the resonance frequency of water by 2000 Hz (pulse duration 19 milliseconds, waveform area approximately 1 0 times greater than that of a 90° pulse). Magnetization transfer ratios (1 - [intensity after suppression/intensity before suppression]) were calculated for normal structures. RESULTS: The magnetization transfer ratio of facial muscles (0.54) was equivalent to that of tongue muscles (0.54). These values exceeded those of parotid (0.39) and submandibular glands (0.41 ). Fat (0.07) and cerebrospinal fluid (0.05) had negligible transfer. CONCLUSION: Magnetization transfer imaging is a simple and effective means of studying the contribution of macromolecular protons to the MR image. Normal neck structures show a wide range of magnetization transfer rates, maximal for muscle and minimal for cerebrospinal fluid and fat.
Index terms: Head, magnetic resonance; Neck, magnetic resonance; Magnetic resonance, tech-nique; Magnetic resonance, tissue characterization
AJNR Am J Neuroradio/15:1117-1121, Jun 1994
Proton magnetic resonance (MR) is dominated
by the contribution of freely mobile water protons
because of their great abundance and their sharp
resonance frequency. Nevertheless, relaxation of
water protons by interactions with
macromolec-ular protons found in proteins and cellmacromolec-ular
mem-branes
does
contribute to the signal derived in
proton MR. The protons in the macromolecular
proteins have restricted motion, and they interact
with mobile water protons through dipolar
cou-pling and chemical exchange
(1-3).
The macromolecular proton pool appears as a
very broad peak in the MR spectrum, extending
over approximately 20 kHz. By placing a
sup-Received May 26, 1993; accepted after revision September 7.
Presented at the American Society of Head and Neck Radiology
course, May 16, 1993.
From the Departments of Radiology and Otorhinolaryngology (D.M.Y.,
M.D.S., L.D.) and Head and Neck Surgery (D.M.Y., G.S.W., R.E.H.), Hospital of the University of Pennsylvania, Philadelphia.
Address reprint requests to David M. Yousem, MD, Department of
Radiology, Hospital of the University of Pennsylvania, 3400 Spruce St,
Philadelphia, PA 19104.
AJNR 15:1117-1121, Jun 1994 0195-6108/94/1506-1117 © American Society of Neuroradiology
pressor pulse far away from the resonant
fre-quency of water
into
this broad macromolecular
pool
,
one can assess the contribution of the
macromolecular protons to the MR signal. This is
most easily done by comparing scans with and
without the suppressor pulse applied and/ or by
performing subtraction imaging of these two
se-quences.
Magnetization transfer imaging (MTI) has been
used
in
research institutions to evaluate lesions
of the brain (
4-8),
liver (9), knee ( 1 0), and heart
(11). Because the head and neck region contains
structures with a wide range of protein,
fat,
and
water content, the
implementation of MTI
in
the
head and neck would seem
to
have great
poten-tial. Additionally, because one of the drawbacks
of spin-echo MR scanning of the head and neck
is the inability to
distinguish
tumoral
edema from
tumor
cells
,
MTI
ultimately
may be useful
in
defining
boundaries of
rapidly
proliferating
can-cers. One would expect
that
differentiation of
freely mobile edema protons could be
distin-guished
from the
more restricted
tumor
cell
mem-brane
proton
pool.
In an
attempt
to determine the feasibility
of
MTI in the head
and
neck
,
we
studied 12
healthy
volunteers and 20 consecutive patients to provide
normative data for head and neck structures. We
sought to assess the intersubject and intrasubject
variability of magnetization transfer in normal
structures of the head and neck
.
Ultimately, these
baseline data points will be used to contrast with
those of head and neck lesions
.
Materials and Methods
Twelve healthy volunteers (staff, residents, and fellows of the Department of Radiology at the Hospital of the University of Pennsylvania) without known head and neck disease were recruited for normative MTI data accumula-tion. All subjects were required to complete informed consent documents, and the study was approved by the Institutional Review Board at the University of Pennsyl-vania. After the safety and feasibility of the technique in the 12 volunteers were shown to be acceptable, 20 con-secutive patients referred to the MR Imaging Center at the University of Pennsylvania for head and neck evaluation also had MTI pulse sequences as part of their scanning protocols. None of the anatomic regions used for accu-mulation of normative data in these patients had abnor-malities, and no patient had been previously treated with either radiation or chemotherapy for head and neck lesions. The age range for the 2 groups of patients was 28 to 72 years.
The MTI scanning protocol used a repetition time of 500 msec, an echo time of 12 msec, and a flip angle of 20° using a multiplanar gradient-echo pulse sequence in a two-dimensional mode. Scanning was performed with and without the magnetization transfer pulse using the same scanning, receive-attenuation, and transmit-attenuation pa-rameters. The magnetization transfer pulse had a duration of 19 milliseconds, was offset from the resonance fre-quency of water by 2000 Hz, and used an area of waveform approximately 10 times greater than that of the 90° spin-echo pulse. The technique used a single-cycle sine pulse (typical section selection pulses are 4 cycles) to induce a broad homogeneous suppression without peaks and valleys of side lobes. This suppression pulse is applied approxi-mately 1 millisecond before routine imaging pulses.
The matrix size was 256 X 128, and the section thick-ness was 5 mm with a 2.5-mm intersection gap. Overall scan time was 2 minutes 10 seconds with and without the MTI pulse applied.
Previous studies using this technique have demonstrated specific absorption rates from 1. 16 to 2.89 W /kg for patients with weights between 45 and 136 kg. The average Bl intensity is 3.67 X 10⁻⁶ T (9).
The sections through the patients' anatomy were se-lected to extend from the parotid gland to the infrahyoid neck in the 12 volunteers. In the patients, scans vlere centered at areas of abnormality but included normal structures for analysis. The anatomy covered and section locations were identical for the pre-and post-MTI suppres-sion scans.
All scans were performed on a 1.5-T General Electric Medical Systems (Milwaukee, Wis) MRI Signa scanner. A Medical Advances (Milwaukee, Wis) volume neck coil was used in each case.
Regions of interest for signal intensity measurements were sampled at the same locations for the scans before and after the magnetization transfer pulse was applied. This was achieved by keeping the position, shape, and volume of the cursor for the region of interest constant between measurements of the pre- and post-MTI sequence. Minor adjustments for patient motion were rarely required. The region of interest sampled was a 4-mm2 circle. This allowed calculation of the ratio of intensity after suppression to the intensity before suppression. The magnetization transfer ratio (MTR) was defined as 1 - (intensity after suppression/ intensity before suppression). By defining the MTR as such, the higher the number the greater the degree of transfer of relaxation. These values (with standard deviations) were obtained for various structures in the head and neck. Right and left asymmetry between the same structures within an individual subject provided intrasubject variability. lntersub-ject variability was reflected by standard deviations of MTR means for the 32 individuals.
Using the Command Language Image Processing Sys-tem menu of the General Electric Signa scanner, subtrac-tion images of the two sequences could be obtained. By subtracting the image after suppression from the image before suppression, one could obtain a magnetization trans-fer image in which higher signal intensity reflected greater magnetization transfer.
The regions of interest that were sampled included the masseter muscles, the pterygoid muscles, the tongue in-trinsic muscles, the submandibular glands, the parotid glands, the cerebrospinal fluid (CSF) within the cervical spinal canal, and the subcutaneous fat. The number of entries for different structures varied slightly, because some scans did not encompass all anatomic regions (ie, thyroid glands), or because the 20 patients' disease encompassed regions that would normally have been measured. This, plus the random selection of anatomy to determine right-to-left asymmetry, accounts for the nonuniformity of meas-urements.
The data were analyzed using the Student's two-tailed t
test for paired samples. Cases in which two anatomic regions were not examined in a single patient were dis-carded when looking at pairs of data.
Results
AJNR: 15, June 1994
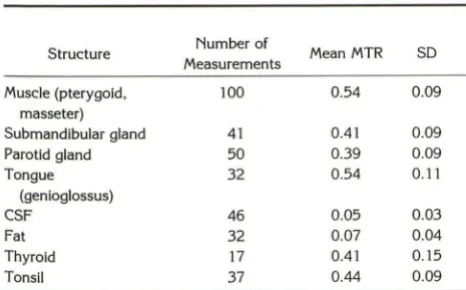
The MTRs of the masseter and pterygoid
mus-cles were similar and are grouped together in the
Table for the determination of muscle MTRs. The
Table shows the ratios of the other normal
struc-tures of the head and neck.
As expected, CSF and fat, with a
predomi-nance of mobile protons, had the lowest MTRs.
Muscle, on the other hand, had the highest MTRs,
reflective of the greater number of restricted
macromolecular protons. The MTR values of the
masseter and pterygoid muscle were similar to
the value for tongue musculature. Glandular
tis-sue (salivary and thyroid glands) had intermediate
values (Fig 1 ).
Of note was the fairly wide range of standard
deviations in the values of the MTRs
.
In the
parotid gland and thyroid glands, this may result
from the variable degree of fatty replacement and
active glandular tissue, respectively. However,
similar standard deviations were noted in all head
and neck structures.
When the right and left sides were compared
in the evaluation of muscles or glands, the mean
MTR variation was 0
.
11 with an SD of 0.10. To
an extent this may reflect inhomogeneities in the
magnetic field, surface coil asymmetric
place-ment, or the natural limitation of the MTI
tech-nique. These data alternatively may reflect
intra-subject variability. There was no consistent
pat-tern for
the right-to-left asymmetry, and
variability was found in all measured structures,
including muscles, glands, and tonsils.
Using the Student's
t
test, there was a
statisti-cally significant difference
(P<
.01) in MTR
values between muscle and the submandibular
gland, parotid gland, CSF, and fat, but not for
tongue, tonsils, or thyroid tissue (the latter
pos-sibly attributable to the small sample size of just
17 pairs of data). A statistically significant
differ-ence
(P<
.01) in MTR values between the
sub-Normal structures and MTRs
Structure Number of
Measurements Mean MTR SD
Muscle (pterygoid, 100 0.54 0.09
masseter)
Submandibular gland 41 0.41 0.09
Parotid gland 50 0.39 0.09
Tongue 32 0.54 0.11
(genioglossus)
CSF 46 0.05 0.03
Fat 32 0.07 0.04
Thyroid 17 0.41 0.15
Tonsil 37 0.44 0.09
MAGNETIZATION TRANSFER 1119
mandibular gland and tongue, tonsil
,
CSF, and
fat was noted but not between the submandibular
gland and parotid or thyroid glands. Similarly, the
parotid gland's MTR and all other structures
'
MTRs except the thyroid gland and tonsil were
different with statistical significance
.
The MTRs
of CSF and fat differed from those of all other
structures except each other. The thyroid gland
and tonsil MTR values did not differ significantly
.
Discussion
Although in many cases MR has improved on
computed tomography in the evaluation of head
and neck lesions, the boundaries of neoplasms
from adjacent normal structures may sometimes
be indistinct in all cross-sectional imaging
mo-dalities
.
Computed tomography is limited to the
evaluation of x-ray beam attenuation and iodine
enhancement in its contrast determination
,
but
MR is more diverse in the types of contrast
obtainable: T1 weighting
,
proton-density
weight-ing, T2 weightweight-ing, contrast enhancement, flow,
and response to gradient echoes. Nonetheless,
MR continues to be limited in the head and neck
(as elsewhere) in distinguishing tumor from
peri-tumoral edema
.
Additionally
,
histologic
discrimi-nation in distinguishing benign from malignant
neoplasms and inflammatory from neoplastic
processes continues to be elusive
.
Because of
these shortcomings, it is useful to evaluate new
MR imaging techniques for improvements to
cur-rent pulse sequences
.
MTI is a method of determining the
contribu-tion of macromolecular protein and cell wall
pro-tons to the MR signal. One would expect that
highly cellular or proteinaceous lesions would
provide greater magnetization transfer.
Neo-plasms, because of cellular proliferation
,
should
have greater magne
tization transfer than that of
inflammatory lesions or edema
,
which are
domi-nated by increased free water protons. A
hypo-thetical goal of head and neck MTI would be to
distinguish edema from normal tissue from
can-cer by virtue of the relative contributions of
macromolecular protein cross-relaxation
(mag-netization transfer) to signal intensity. lwama et
al have shown that cross-relaxation decreases
significantly in peritumoral edematous rat brains
compared with normal rat brains (12)
.
The
astro-cytic tumors themselves had a slight increase in
cross-relaxation compared with normal brain
tis-sue
.
Boorstein et al also have shown that MTRs
[image:3.614.51.284.595.740.2]A
8
c
fig. 1. Healthy volunteer with source images, MTI subtraction images.
A, Scan through the parotid gland level with multiplanar gradient-echo technique before magnetization transfer pulse was applied
(upper left), after magnetization transfer pulse applied (upper right), and subtraction image (before minus after) (bottom right). Compare
intensities of various tissues, and note greatest change in muscle.
8, Magnified subtraction image of scan before MTI minus scan after MTI provides an image on which the degree of change is reflected in signal intensity. CSF, fat, and fatty parotid have low intensity because little change (magnetization transfer) has occurred. Muscle is brighter because there has been more transfer.
C, A subtracted image through the submandibular glands shows intermediate intensity (transfer) compared with muscle and CSF. Note the asymmetry from right to left, possibly caused by inhomogeneity in field.
metastatic lesions in the human brain, both in
areas of bright signal on T2-weighted sequences
and in areas that appeared normal on all
spin-echo images (8). They propose that MTI
ulti-mately may help in mapping tumors for radiation
therapists. The utility of the technique in the head
and neck must be examined
.
Lundbom has examined the role of MTI in
determining the histologic grade of brain tumors
(7). The mean MTR of high-grade astrocytomas
was greater than that of low-grade astrocytomas
(P =.0005),
presumably because of a difference
in cellularity and nuclear material. The MTRs of
astrocytomas were significantly smaller than
those of meningiomas and pituitary adenomas.
Applied
to
the head and neck
,
MTI may prove
useful in predicting histologic grades of squamous
cell carcinoma because well-differentiated tumors
have more keratin and are less cellular
(a
lower
MTR), whereas poorly differentiated carcinomas
should have more
nuclear material (higher MTR)
.
Will MTI aid in distinguishing
lymphomas
from
squamous cell carcinomas, reactive
lymphade-nopathy from malignant nodes? Research in these
areas may prove
fruitful.
In this preliminary
study we have explored
MTRs of nondiseased anatomic structures of the
head and
neck
to provide normative data. By
providing early baseline values, as well as a
pro-tocol for an easily implemented MTI technique
,
we hope to encourage a uniform approach to the
evaluation of this technique. Comparing
tech-niques with varying scan parameters makes the
overall evaluation of a sequence much more
difficult
.
We advocate adopting a standardized,
universal approach to MTI of the head and neck
using the parameters provided herein. We hope
that the scan technique provided here will allow
head and neck investigators to define more
read-ily the role of MTI in the head and neck.
It is gratifying when the theoretical
expecta-tions of a technique are substantiated with clinical
implementation. One would expect that muscle,
because of the high macromolecular protein
pro-ton content, would have the highest MTR
.
This
is in fact what was demonstrated here. In a similar
vein, CSF, with an absence of macromolecular
proteins
,
would be expected to have negligible
transfer, as demonstrated
.
A small amount of
suppression of water by the broad magnetization
transfer suppressor pulse may explain why the
MTR values are not absolute zero
for
water. Fat,
also dominated by highly mobile protons without
protein contributions
,
also showed very low
AJNR: 15, June 1994
elements, and secretions. The intermediate
trans-fer
ratios
in these structures are therefore not
fully unexpected
.
Although the intrasubject variabilities from
right to left and intersubject variability in MTRs
was moderately large, we do not believe
that
these
ranges
will obviate the application of
the
technique for the evaluation of pathologic
condi-tions of the head and neck
.
As coil design allows
more and more homogeneous
fields,
and more
age- and sex-matched subjects are accrued in the
MTI data base, we expect these asymmetries and
variabilities to decline
.
At this time we have no
definite explanation for the variability, nor any
further suggestions for improving the
homoge-neity of values.
Previous investigators have
reported
magneti-zation transfer results in terms of intensities
be-fore and after suppression pulses. By using
1
minus this ratio, the higher number will
reflect
the greater transfer. Converting prior studies'
re-sults into our nomenclature shows remarkable
similarity with muscle MTRs ranging from 0.49
to 0.60 (9, 11, 13), fat from 0
.
0 to 0.05 (1, 9),
and CSF 0
.
0 to 0.07
(1,
6, 7, 9). Standard
devia-tions of means reported
in
these studies are also
similar to our results. These values are
remarka-bly consistent considering that the field strengths
,
scanning parameters
,
locations of structures, and
even species varied from our study.
Armed with normative data and a user-friendly
MTI pulse sequence, one
is
now prepared to
evaluate the applications of the technique in
path-ologic conditions. We predict that the
differentia-tion of inflammatory and neoplastic lesions,
hy-percellular and hypocellular masses, and edema
versus neoplasms will be distinguishable by MTI
in
the head and neck. One would hope
that
MAGNETIZATION TRANSFER 1121
creating subtraction
images, which currently
re-quires entering the scanner's software
programs,
will become easier
as the utility of
the technique
is
borne out.
References
1. Wolff SD, Balaban RS. Magnetization transfer contrast (MTC) and
tissue water proton relaxation in vivo. Magn Reson Med 1989; 10:
135-144
2. Eng J, Ceckler TL, Balaban RS. Quantitative 'H magnetization
trans-fer imaging in vivo. Magn Reson Med 1991;17:304-314
3. Fralix TA, Ceckler TL, Wolff SD, Simon SA, Balaban RS. Lipid bilayer and water proton magnetization transfer: effect of cholesterol. Magn
Reson Med 1991;18:214-223
4. Wolff SD, Eng J, Balaban RS. Magnetization transfer contrast: method for improving contrast in gradient-recalled-echo images. Radiology 1991 ;179:133-137
5. Lipton MJ, Sepponen RE, Tanttu Jl, Kuusela T. Magnetization transfer technique for improved magnetic resonance imaging contrast
en-hancement in whole body imaging. Invest Radiol1991 ;26:S255-S256 6. Dousset V, Grossman Rl, Ramer KN, et al. Experimental allergic encephalomyelitis and multiple sclerosis: lesion characterization with
magnetization transfer imaging. Radiology 1992; 182:483-491 7. Lundbom N. Determination of magnetization transfer contrast in
tissue: an MR imaging study of brain tumors. AJR Am J Roentgenol 1992; 159:1279-1285
8. Boorstein JM, Grossman Rl, Bolinger L. Magnetization transfer im-aging in metastatic disease to the brain. Radiology (in press) 9. Outwater E, Schnall MD, Braitman LE, Dinsmore BJ, Kresse! HY.
Magnetization transfer of hepatic lesions: evaluation of a novel con
-trast technique in the abdomen. Radiology 1992; 182:535-540 10. Wolff SD, Chesnick S, Frank JA, Lim KO, Balaban RS. Magnetization
transfer contrast: MR imaging of the knee. Radiology 1991; 179: 623-628
11. Balaban RS, Chesnick S, Hedges K, Samaha F, Heineman FW.
Magnetization transfer contrast in MR imaging of the heart. Radiology 1991;180:671-675
12. lwama T, Yamada H, EraS, et al. Proton nuclear magnetic resonance
studies on water structure in peritumoral edematous brain tissue.
Magn Reson Med 1992;24:53-63
13. Tanttu Jl, Kahn CE Jr, Sepponen RE, et al. Magnetization transfer