SOURCES AND MANAGEMENT OF NITROGEN IN SIDE
*
1Dionei Schmidt Muraro,
1BrenoRodolfo Maron,
1Department of Agronomic and Environmental Sciences, Federal University of Santa Maria Frederico
Westphalen, Rio Grande do Sul, Brazil
ARTICLE INFO ABSTRACT
The management of nitrogen fertilization in agriculture is one of the most important factors for obtaining high yields. The objective of this study was to evaluate nitrogen sources and managements on the
of Rio Grande do Sul. The experimental design was a randomized block with four replications, in a factorial 2 x 5two N sources in side
N application managem DAE +
urease inhibitor yielded higher
remaining parameters. The N management enable higher
with more late applications of nitrogen, however, not influencing the agronomic parameters. The absence of N application brings in fewer ears per square meter, number of grains per ears, plant height, dry matter,
Copyright©2016, Dionei Schmidt Muraro et al.This
unrestricted use, distribution, and reproduction in any medium, provided the original work is properly cited.
INTRODUCTION
Wheat (Triticumaestivum L.) is a major source of protein and calories for the world population, and its global demand is expected to grow 44% until 2027 (Meade et al
the major cereal producers, is the European Union as world's largest producer of wheat, approximately 142.9 million tons, followed by China, India and the United States with a production of 122, 92.4 and 57.9 million tons, respectively (USDA, 2014). In Brazil, the wheat crop has great economic and social importance, Brazilian wheat production is about 5.5 million tons per year, well below the annual demand, which is approximately 10.7 million tons (CONAB, 2016).However, soil conditions, climate and topography favorable to the cultivation of wheat, can make Brazil a country with great potential for expansion of this culture, with the prospect of providing self-sufficiency in domestic production (Filho 2010).
*Corresponding author: *1Dionei Schmidt Muraro
Department of Agronomic and Environmental Sciences, Federal University of Santa Maria Frederico Westphalen, Rio Grande do Sul, Brazil
ISSN: 0975-833X
International Journal of Current Research
Vol.
Article History:
Received 20th June, 2016
Received in revised form 17th July, 2016
Accepted 08th August, 2016
Published online 20th September,2016
Key words:
Triticumaestivum,
Nitrogen fertilization, Urease inhibitor.
Citation: Dionei Schmidt Muraro, Alieze Nascimento da Silva, Claudir José Basso, BrenoRodolfo Maron, Antonio Luis Santi and Diecson Ruy Orsolin da Silva.2016. “Sources and management of nitrogen in side
37585.
RESEARCH ARTICLE
SOURCES AND MANAGEMENT OF NITROGEN IN SIDE-DRESSING IN WHEAT CROP
Dionei Schmidt Muraro,
1Alieze Nascimento da Silva,
1Claudir José Basso,
1Antonio Luis Santi and
1Diecson Ruy Orsolin da Silva
Department of Agronomic and Environmental Sciences, Federal University of Santa Maria Frederico
Westphalen, Rio Grande do Sul, Brazil
ABSTRACT
The management of nitrogen fertilization in agriculture is one of the most important factors for obtaining high yields. The objective of this study was to evaluate nitrogen sources and managements on the agronomic performance in wheat crop (Triticumaestivum) in no
of Rio Grande do Sul. The experimental design was a randomized block with four replications, in a factorial 2 x 5two N sources in side dressing (conventional urea,
N application managements: Control (without N inside dressing);½ 30 DAE + ½ flowering; DAE + ⅓ flowering;⅓ 30 DAE + ⅓ stem elongation + ⅓ flowering andtotal dose 30 DAE. Urea with urease inhibitor yielded higher percentage of total proteinof the grains, however, did not affect the remaining parameters. The N management enable higher percentage of total protein
with more late applications of nitrogen, however, not influencing the agronomic parameters. The absence of N application brings in fewer ears per square meter, number of grains per ears, plant height, dry matter, percentage of total proteinand grain yield.
This is an open access article distributed under the Creative Commons Att use, distribution, and reproduction in any medium, provided the original work is properly cited.
) is a major source of protein and calories for the world population, and its global demand is
et al., 2011). Among
the major cereal producers, is the European Union as world's 142.9 million tons, followed by China, India and the United States with a production of 122, 92.4 and 57.9 million tons, respectively In Brazil, the wheat crop has great economic Brazilian wheat production is about 5.5 million tons per year, well below the annual demand, which is approximately 10.7 million tons (CONAB, 2016).However, soil conditions, climate and topography favorable to the cultivation of wheat, can make Brazil a country with great n of this culture, with the prospect of sufficiency in domestic production (Filho et al.,
Dionei Schmidt Muraro
Department of Agronomic and Environmental Sciences, Federal Frederico Westphalen, Rio Grande do Sul,
Nitrogen (N) is the soil nutrient most limiting to plant growth, mainly grasses, second only to water availability (
al., 2013; Kutman et al., 2011). The management of nitrogen
fertilization in agriculture is one of the most important factors for obtaining high yields (Snyder
approximately 30-50% of the yield increase of crops worldwide (Erisman et al., 2008).
nitrogen fertilizer due to its high nitrogen content (460 g N kg
1
), lower transport costs and hi
2006; Heffer and Prud'homme, 2011; Soares
However, its use has been associated, the high losses of nitrogen through volatilization of ammonia (NH
Cobeña et al., 2012), denitrification, lixiviation, espe when applied in harsh conditions, such as low humidity and high temperature soil (Ercoli et al
The best way to reduce N losses by NH
incorporation of fertilizer into the soil mechanically or by irrigation or rain water, however in some situations the incorporation is not possible,as in areas cultivated with conservation tillage (Cantarella, 2007).
effectiveness of the applied fertilizer and also brings environmental and health pro
Zhou and Butterbach-Bahl, 2014).
International Journal of Current Research
Vol. 8, Issue, 09, pp.37580-37585, September, 2016
INTERNATIONAL
Dionei Schmidt Muraro, Alieze Nascimento da Silva, Claudir José Basso, BrenoRodolfo Maron, Antonio Luis Santi and Diecson Ruy Sources and management of nitrogen in side-dressing in wheat crop”, International Journal of Current Research
DRESSING IN WHEAT CROP
Claudir José Basso,
Diecson Ruy Orsolin da Silva
Department of Agronomic and Environmental Sciences, Federal University of Santa Maria Frederico
The management of nitrogen fertilization in agriculture is one of the most important factors for obtaining high yields. The objective of this study was to evaluate nitrogen sources and managements ) in no-tillage system in the northwest of Rio Grande do Sul. The experimental design was a randomized block with four replications, in a urea with urease inhibitor) and five dressing);½ 30 DAE + ½ flowering;⅔ 30 ⅓ flowering;⅓ 30 DAE + ⅓ stem elongation + ⅓ flowering andtotal dose 30 DAE. Urea with of the grains, however, did not affect the percentage of total proteinin wheat grains with more late applications of nitrogen, however, not influencing the agronomic parameters. The absence of N application brings in fewer ears per square meter, number of grains per ears, plant
is an open access article distributed under the Creative Commons Attribution License, which permits
Nitrogen (N) is the soil nutrient most limiting to plant growth, mainly grasses, second only to water availability (Kawakami et ., 2011). The management of nitrogen fertilization in agriculture is one of the most important factors Snyder et al., 2009 ), it contributes 50% of the yield increase of crops ., 2008). Urea is the most widely used nitrogen fertilizer due to its high nitrogen content (460 g N kg
-), lower transport costs and high solubility (Glibert et al., 2006; Heffer and Prud'homme, 2011; Soares et al., 2012). However, its use has been associated, the high losses of nitrogen through volatilization of ammonia (NH3) (Sanz ., 2012), denitrification, lixiviation, especially when applied in harsh conditions, such as low humidity and
et al., 2012; Tasca et al., 2011).
The best way to reduce N losses by NH3 volatilization is the incorporation of fertilizer into the soil mechanically or by igation or rain water, however in some situations the incorporation is not possible,as in areas cultivated with conservation tillage (Cantarella, 2007). This reduces the effectiveness of the applied fertilizer and also brings environmental and health problems (Bodirsky et al., 2014;
Bahl, 2014).
INTERNATIONAL JOURNAL OF CURRENT RESEARCH
Dionei Schmidt Muraro, Alieze Nascimento da Silva, Claudir José Basso, BrenoRodolfo Maron, Antonio Luis Santi and Diecson Ruy
37580-The use of fertilizers more "efficient" is one of the strategies to reduce losses, fertilizer imports and, maximize production (Tilman et al., 2011). These include polymer coating treated with urea and urease inhibitors (Turner et al., 2010;Sanz-Cobeña et al., 2012; Halvorson et al., 2014). By preventing rapid hydrolysis,inhibitors increase the chances of N be absorbed by plants. Among the products tested as an inhibitor of urease, the NBPT (N- (n-butyl) thiophosphorictriamide) is what has achieved the best results (Beyrouty et al., 1988; Watson, 2000), increasing N use efficiency and crop productivity, it is effective at low concentrations (Cantarella et
al., 2008). Traditionally, annual crops at sowing receive only a
fraction of the total dose of N that need, and the remainder is applied to the side-dressing, during periods of peak demand (Filho et al., 2011). However, studies on the response of plant parameters and productivity of wheat grains with N sources of slow-release in side-dressing are scarce or insufficient, and should be studied in specific environmental conditions due to the complex dynamics of N in soil. Thus, the hypothesis underlying this work is that these N sources with slow release improve the efficiency of utilization of nitrogen by culture positive impact on the plant parameters and the final grain yield. Therefore, the objective of this work was to evaluate the efficiency of different managements and nitrogen sources with and without urease inhibitor in side-dressing on wheat agronomic performance in no tillage system in Southern Brazil.
MATERIAL AND METHODS
The experiment was conducted under field conditions in 2013, in the experimental area in the municipality of Ajuricaba, in the northwest part of the state of Rio Grande do Sul, in southern Brazil, whose coordinates are 28°14’S and 53°42’ W, at an altitude of 430 meters. The soil is classified as RhodicHapludox soil, or sandy clay loam soil in the Brazilian System of Soil Classification (EMBRAPA, 2013)with texture clayey. The climate according to Koppen classification, it is subtropical with wet spring, with average annual temperature of 18,1 ºC and annual rainfall of 1.900 mm. Precipitation occurred during the experiment are shown in Figure 1. The chemical characteristics of the soil of the experimental area at the depths from 0.0 to 0.20m were determined before the experiment was set up, according to methodology proposed by RAIJ & QUAGGIO (1983) and presented the following results:17,8mg dm 3 P (mehlich); 4.0% organic matter; 6,55 pH (H2O);263,6 mgdm-3 K; 10,3cmol dm-3Ca; 3,6cmol dm-3
Mg; 2,1cmol dm-3 H+Al; 14,6 cmol dm-3 effective CTCand 87% saturation by bases. The experimental area had been conducted for 15 years under no-till system being occupied previously with soybean. The experimental plot measured 3 x 3 meters, being considered as a useful area of each plot the 8 centerlines, despising 0.5 m end,totaled 2.72 m2.
The experimental design was a randomized block in a factorial 2 x 5, with 4 replications, in which were two urea sources in side-dressing(conventional urea and urea with urease inhibitor – Super N®), being applied 80kg ha N-1 as a fixed dose, in five of N application managements, as follows: M1- 0 kg ha
-1
(without Nin side-dressing);M2- ½30 days after emergence
(DAE)+½flowering;M3- ⅔30 DAE + ⅓ flowering;M4- ⅓ 30 DAE + ⅓ stem elongation + ⅓ flowering;M5- total dose DAE. Before sowing the experiment, the area was desiccated with the herbicide Paraquat (400 g ha-1 active ingredient) + Diuron(200g ha-1active ingredient). The seeds were treated with the fungicide mechanically Triadimenol (45g active ingredient100 kg-1seed) and the insecticide Imidacloprid (42g active ingredient100 kg-1seed). The wheat crop base fertilizer was mechanically held the day before sowing, distributed to haul with solid distributor with double disc for all treatments constantly, used a mineral commercial fertilizer NPK Yara Mila®, in the formulation 16-16-16, with dosage 200 kg ha-1, totalized 32 kg ha-1 N, P205 and K2Oat sowing. The wheat
sowing was held June 16, 2013, spaced between 0.17 m line directly with mechanized seeder 16 lines, at a depth of approximately 2 to 2.5 cm, set at approximately 160 kg ha-1 of seed, aiming at a density of about 320 plants per square meter.The genotype used was the Quartz OR / Biotrigo Genetics, medium cycle, classified as “wheat bread”.
The N applications were made manually, the haul distributed across the plot área.The first application was held on 14.07.2013; the second application, the treatments with application in stem elongation, held on 16.08.2013 and the third application, the treatments with application at the beginning of flowering made on 09.15.2013. The following assessments were made: a) dry matter: it was evaluated by cutting the plants at the time of the soil surface in full bloom, in three rows of 0.5m length, using 0.26 m2, after collection the samples were placed in paper bags and dried in an oven at a temperature of 60 to 70 ° C until constant weight; b) plant height: was selected ten plants randomly within the useful area of the plot, measuring from ground level to the wheat spike apex; c) number of ears per square meter: determined by counting the earsof four main lines per one meter long; d) number of grains per ears: determined by the random collection of ten spikes in the useful area, performing the manual threshing and then the mean grain count; e) grain yield: determined from the useful area of manual harvesting the plot and later track with stationary beater attached to tractor power outlet, then proceeding to clean manually by wind induction. Following held the weigh grain with precision scales, determination of moisture and weight of the correction to 13%; f)1,000 grains weight: was determined with the score of 6 sub sample of 100 grains weighed on a precision scale; g) test weight (TW) and;h) percentage of total protein:used grain analyzer Infratec™ 1241 of brand FOSS. Data were submitted to analysis of variance (ANOVA), and the means were compared by Tukey test, 5% probability. Statistical procedures were carried out in Genes (Cruz, 2013) and SAS (SAS, 2013) softwares.
RESULTS AND DISCUSSIONS
bv
[image:3.595.167.444.290.477.2]Figure 1. Rainfall during the wheat crop cycle. 1N: 1st application of nitrogen; 2N: 2nd application of nitrogen; 3rd nitrogen application. SO:sowing; EM:plant emergence; SE: stem elongation; FLO:flowering; HA: harvest
Figure 2. Protein content in grain according to different sources of N in wheat side-dressing Conventional urea and Urea with urease inhibitor
Table 1 - number of ears per square meter, number of grains per ears and 1,000 grains weight of wheat, submitted to N application managements
Managements Application Numberofears / m2 Numberofgrains/ears 1,000 grains weight
(number) (g)
M1 –Control (without N) 257,25 b* 37,90 b 36,37 a
M2 - ½ 30 DAE + ½ PF 307,37 a 42,02a 37,29 a
M3 - ⅔ 30 DAE + ⅓ PF 311,62 a 42,31 a 36,15 a
M4 - ⅓ 30 DAE + ⅓ SE + ⅓ PF 301,87 a 40,96 ab 37,06 a
M5 –Total dose 30 DAE 298,87 a 40,64 ab 36,79 a
Average 295,4 40,77 36,73
CV (%) 6,93 5,37 2,46
*
Average followed by the same letter in the column, do not differ, a 5% probability by Tukey test. 30 DAE: 30 days after emergence, PF: pre-flowering, SE: stem elongation.
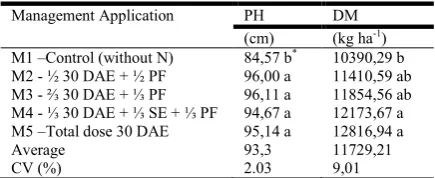
Table 2. Plant height (PH), dry matter (DM) of wheat subjected to N application managements
Management Application PH DM
(cm) (kg ha-1) M1 –Control (without N) 84,57 b* 10390,29 b
M2 - ½ 30 DAE + ½ PF 96,00 a 11410,59 ab M3 - ⅔ 30 DAE + ⅓ PF 96,11 a 11854,56 ab M4 - ⅓ 30 DAE + ⅓ SE + ⅓ PF 94,67 a 12173,67 a M5 –Total dose 30 DAE 95,14 a 12816,94 a
Average 93,3 11729,21
CV (%) 2.03 9,01
[image:3.595.114.490.551.639.2] [image:3.595.193.411.683.772.2]Studying nitrogen fertilizers with slow release and conventional in wheat crop, Theago et al.,(2014) and Filho et
al.,(2011) found no significant difference for the same
variables in this study, the authors explain that the high rainfall could affect the efficiency of N, along with wheat genotype, climate and management. As for the percentage of total protein, was no significant difference between the N sources with a greater accumulation trend (0.47%) in the treatment of urea with urease inhibitor (Figure 2). These data corroborate the Zaman et al. (2010), who also concluded that urea with urease inhibitor increases the grain protein content in relation to the common urea. This increase in wheat grains of protein content can be explained by the fact that nitrogen is the main component of the protein building block (Zaman et al., 2010). A high protein content wheat grain is important in milling and baking quality of wheat, resulting in greater economic return.Proper management of how to apply, wherein the certain amount of N and the right growth phase can help optimize the protein content, avoiding adverse effects on agricultural production and the environment. The environmental conditions are very important in determining the magnitude of the loss of NH3 volatilization after application of urea.
However, Cazetta et al., (2008) reported that by quantifying the N content grains, multiplied by 5.7 (conversion factor) obtains a value corresponding to protein content, as a percentage. Therefore, Prando et al., (2012) found no differences in N content of wheat grain with conventional urea and urea with urease inhibitor, both sources showed the same response. For the authors this lack of response may be associated with the occurrence of a period of 18 days without rain after side-dressing, this period without rainfall after nitrogen fertilization favors the loss of nitrogen through volatilization and hydrolysis of the urea on the surface. Even the increased efficiency of fertilizer (urea with urease inhibitor) depend on the occurrence of enough rainfall to incorporate them into the soil, and recommended that they present good efficiency up to seven days without rain after application. For the number of ears per square meter, there was a significant difference, and the treatment 0 kg ha-1 N showed an average reduction of 15.6% compared with the average of other treatments which were applied 80 kg ha-1 of nitrogen in side-dressing. As for the management of nitrogen there was no statistical difference (Table 1). Second, Bredemeier and Mundstock (2001) studied different management and N application times in wheat crop (Without N, 3rd leaf, 5th leaf, 7th leaf, booting, emergency + 7th leaf, 3rd leaf + 7th leaf and 5t leaf + 7th leaf), also observed a lower number of ears per
square meter when it was not applied nitrogen in side-dressing. Nitrogen fertilization in side-dressing is very important in determining the number of tillers per plant and ears per plant (Costa et al., 2013). According with Mundstock and Bredemeier (2001), N absorbed in plant growth early stage promotes tillering and a higher percentage of survival of tillers. As for the number of grains per ears (Table 1) shows that the average of the treatments with N application that was 9.17% higher than the control (without N). When comparing the different N management there was no significant difference between them. The lack of response to the number of grains per ears with N installment were also observed by Costa et al., (2013), however, they stressed that the greatest value was in the installment with ½ 20 DAEand ½ at booting orpre-bloom. There was no significant difference between treatments for the variable weight of a thousand grains (Table 1).
Coelho et al., (1998) studied N management strategies in wheat crop (Total dose to 20 DAE; ½ to 20 + ½ to 40 DAE; 1/3to 20 + 2/3 to 40 DAE and 2/3 to 20 + 1/3 to 40 DAE, andwithout N), thus observed similar results to this study about the weight of a thousand grains,no significant difference in the installment of N. According to Costa et al., (2013), the mass of 1000 grains is a measure that shows strong genetic control, but is also affected by temperature and humidity conditions during the ripening phase in the field. The managements N application do not interfere with plant height, unlike the control (without N), which was lower than the other treatments (Table 2). It is observed that there is an average increase of 10.9 cm in plant height with application of 80 kg ha-1 in comparison with the witness, which shows the importance of N for vegetative growth of wheat plants. In this same line of study N installment in side-dressing wheat crop, Cunha et al., (2013) also report that management parceled in side-dressing did not affect plant height of genotypes CD 105, IPR 130 and LD 052 114. Already Silva et al., (2008) performing a similar experiment in the Cerrado, found regarding the application of the time, there was a higher plant height in treatment: 100% N at sowing, 1/3 N at sowing + 2/3 N to 15 DAE and 1/3 N at sowing + 2/3 N 30 DAE.On the other hand, Yano et al., (2005) concluded that for plant height, is the more advance application of N, the greater the development of the wheat plant.
[image:4.595.165.435.85.173.2]Thus, Coelho et al., (1998) explain that in cereals, application of high nitrogen levels in the initial period increases the production of phytohormones promoters of the growth and development responsible for division processes and cellular
Table 3 – Grain yield, test weight (TW)and percentage of total percentage of total protein (PPT) of wheat grain subjected to N application managements
Managements Application Grainyield TW PPT
(kg ha-1) (kg 100 L-1) (%)
M1 –Control (without N) 3580,14 b* 79,80 a 10,77 c
M2 - ½ 30 DAE + ½ PF 4819,46 a 80,60 a 13,34 a
M3 - ⅔ 30 DAE +⅓ PF 4751,54 a 80,19 a 13,01 a
M4 - ⅓ 30 DAE + ⅓ SE + ⅓ PF 4574,18 a 80,45 a 12,97 a M5 –Total dose 30 DAE 4779,18 a 80,40 a 11,60 b
Average 4500,9 80,29 12,34
CV (%) 5,77 0.85 3,49
expansion, increasing stem elongation and consequently, the plant height. In the dry matter (Table 2),e was a significant difference for N management, but the M4 and M5 were statistically higher than the control (without N), an increase of 14.6 and 18.9%. As Da Ros et al., (2003) observed that the time of N application, considering the same dose did not affect the production of dry matter, but found only variations between the doses applied (zero, 30 and 90kg ha-1 N), regardless of times. These results are generally expected since nitrogen contributes to vegetative growth, acting in the rates of initiation and leaf expansion, the final size of the leaves and stem elongation (Schröder et al., 2000). For grain yield Table 3, there was no significant response regarding the N management, except for the control (without N) that was statistically different from the other treatments.Compared to the average of treatments, there was a 24% reduction in grain yield without N application in wheat. Even with no significant difference between treatments with management of N, it is observed that the M2 with application of 40 kg ha-1 N at 30 days after emergence and 40 kg ha-1 N in pre-flowering, the highest grain yield was observed, with an increase of 2.5% (117.2 kg ha-1) than the average for the other treatments with application N. This highlights the need for greater concentration of N in the early stages, since there was a trend of increases in grain yield with this anticipation of nitrogen (Table 3).
This may be associated with the critical period definition of income components that take place at this stage, which are: number of ears per plant, ears per plant, spikelets per spike, grains per spikelets and grains per square meter, which have high correlation with the grain yield (Bredemeiere andMundstock et al., 2001; Benin et al., 2012). The managements of N did not influence the test weight (TW) (Table 3) these results being similar to those observed by Yano
et al., (2005). Regarding the protein variable (Table 3), there
was a significant difference to the managements, where M2, M3 and M4, were statistically superior to M1 and M5, which had the lowest protein content. It can be observed that when the N application was performed at a later time, higher values were obtained protein percentage, on average 1.5% compared with the application of the dose at 30 DAE. On the other hand, the absence of N application results in slightly lower values give the percentage of decrease of 0.83 and 2.33% protein compared to the total applied at 30 DAE and the average of treatments that were split, respectively (Table 3).These results are similar to Yano et al., (2005), noting that the late application of nitrogen held at booting provided an increased production of proteins in grains for the application of nitrogen held in the tillering and seeding, a fact confirmed by Cuniberti (1996).
Conclusion
Urea with urease inhibitor yielded higher percentage of total protein, however, did not affect the remaining parameters. The N management enable higher percentage of total protein in wheat grains with more late applications of nitrogen, however, not influencing the agronomic parameters. The absence of N application brings in fewer ears per square meter, number of
grains per ears, plant height, dry matter, percentage of total protein and grain yield.
REFERENCES
Agron, J., 106: 715-722 http://dx.doi.org/10.2134/ agronj2013.0081
Benin, G., Bornhofen, E.,Beche, E., Pagliosa, E, S., Silva, C. S. Pinnow, C. 2012. Agronomic performance of wheat cultivars in response to nitrogen fertilization levels. Acta
Scientiarum Agronomy. Maringá. 34: 275-283.
Beyrouty, C. A., Sommers, L. E., Nelson, D. W. 1988. Ammonia volatilization from surface-applied urea as affected by several phosphoroamide compounds. Soil
Science Society of America Journal. Madison. 52:
1173-1178.
Bodirsky, B. L, Popp, A. ,Lotze-Campen, H., Dietrich, J.P., Rolinski, S. , Weindl, I. , Schmitz, C. , Müller, C. , Bonsch, M. , Humpenöder, F. , Biewald, A. , Stevanovic, M. 2014. Reactive nitrogen requirements to feed the world in 2050 and potential to mitigate nitrogen pollution. Nature
Communications. 5: 3858.
Bredemeier, C., Mundstock, C. M. Estádios fenológicos do trigo para a adubação nitrogenada em cobertura. 2001. Revista Brasileira de Ciência do Solo. Viçosa. 25:317-323. Cantarella, H. 2007. Uso eficiente de fertilizantes
nitrogenados: Uso eficiente de nitrogênio em novos fertilizantes no Brasil. Informações Agronômicas IPNI, 120:12-13.
Cantarella, H., Trivelin, P.C.O., Contin, T.L.M., Dias, F.L.F., Rossetto, R., Marcelino, R., Coimbra, R.B., Quaggio, J.A. 2008. Ammonia volatilisation from urease inhibitor-treated urea applied to sugarcane trash blankets. Scientia Agricola. 65: 397- 401.
Cazetta, DA., Fornasieri-Filho, D., Arf, O. AndGermani, R. 2008. Qualidade industrial de cultivares de trigo e triticale submetidos à adubação nitrogenada no sistema de plantio direto. Bragantia, 67:741-750.doi: 10.1590/S0006- 87052008000300024.
Coelho, M. A. O., Souza, M. A., Sediyama, T., Ribeiro, A. C., Sediyama, C. S. 1998. Resposta da produtividade de grãos e outras características agronômicas do trigo EMBRAPA-22 irrigado ao nitrogênio em cobertura. Revista Brasileira de Ciência do Solo, Viçosa. 22: 555-561.
Companhia nacional de abastecimento. Acompanhamento da safra brasileira de grãos. 2016. 1:1 Brasília. Conab, 2016. Costa, L., Zucareli, C., Riede, C. R. Parcelamento da adubação
nitrogenada no desempenho produtivo de genótipos de trigo. 2013. Revista Ciência Agronômica. 2: 215-224. Cruz, CD. 2013. GENES - a software package for analysis in
experimental statisticsandquantitativegenetics. Acta Scientiarum Agronomy, 35:271-276. doi: 10.4025/ actasciagron. V 35i3.21251.
Cuniberti, M. B. 1996. Fertilizacion nitrogenada, proteínas y calidaddel trigo. Córdoba: Estacion Experimental Agropecuária Marcos Juarez, (Informacion para Extension, n.33).
Ercoli, L., Arduini, L., Mariotti, M., Lulli, L., Masoni., A. 2012. Management of sulphurfertiliser to improve durum wheat production and minimise S leaching. European
Journal of Agronomy. 38: 74-82
Erisman, J. W., Sutton, M.A., Galloway, J., Klimont, Z., Winiwarter, W. 2008. How a century of ammonia synthesis changed the world. Nat. Geosci., 1: 636–639.
Filho, M. C. M. T., Buzetti, S., Andreotti, M., Arf, O., Sá, M. E. 2011. Application times, sources and doses of nitrogen on wheat cultivars under no till in the Cerrado region. Ciência Rural.41: 8.
Filho, M. C. M.T., Buzetti, S., Andreotti, M., Arf, O,. and Benett, C.G.S. 2010. Doses, fontes e épocas de aplicação de nitrogênio em trigo irrigado em plantio direto. Pesquisa Agropecuária Brasileira, Brasília, 45:797-804.
Glibert, P., Harrison, J., Heil, C., and Seitzinger, S.. 2006. Escalating Worldwide use of Urea – A Global Change Contributing to Coastal Eutrophication. Biogeochemistry 77: 441-463.
Halvorson, A.D., Snyder, C.S., Blaylock, A.D., Del Grosso, S.J. 2014. Enhanced-Efficiency Nitrogen Fertilizers: Potential Role in Nitrous Oxide Emission Mitigation. Heffer, H. and Prud'homme, M. 2011. Fertilizer outlook 2011–
2015. International Fertilizer Industry Association e IFA, Paris (Available at: http://www.fertilizer.org/ifa/
HomePage/LIBRARY/Conference-papers/Annual-Conferences/2011-IFAAnnual-Conference, accessed on 11.03.16)
Kawakami, E.M., Oosterhuis, D.M., Snider, J.L. 2013. Nitrogen assimilation and growth of cotton seedlings under NaCl salinity and in response to urea application with NBPT and DCD. J. Agron. Crop Sci., 199: 106–117. Kutman, U. B., Yildiz, B.,Cakmak, I. 2011. Effect of nitrogen
on uptake, remobilization and partitioning of zinc and iron throughout the development of durum wheat. Plant and
Soil. 342:149-164.
Prando, A. M., Zucareli, C., Fronza, V., Basso, M. C., Oliveira, F. A. 2012. Formas de ureia e doses de nitrogênio em cobertura no desempenho agronômico de genótipos de trigo. Semina: Ciências Agrárias, Londrina, 33: 621-632.
Raij, B. van and Quaggio, J.A. 1983.Métodos de análise de solo para fins de fertilidade. Campinas, Instituto Agronômico, 31p. (Boletim técnico, 81).
Ros, C.O.,Salet R.L.,Porn, R.L. and Machado, J.N.C. 2003. Disponibilidade de nitrogênio e produtividade de milho e trigo com diferentes métodos de adubação nitrogenada no sistema plantio direto. Ciência Rural, 33:799-804.
Sanz-Cobena, A., Sánchez-Martín, L., García-Torres, A., Vallejo, A. 2012. Gaseous emissions of N2O and NO and NO3− leaching from urea applied with urease and nitrification inhibitors to a maize (Zea mays) Crop. Agric.
Ecosyst. Environ., 149: 64–73.
SAS. 2013. Getting Started with the SAS® Learning Edition. Cary, NC: SAS Institute, 81 p.
Schröder, J.J., Neetesona, J.J., Oenemaa, O.,Struikb, P.C. 2000. Does the crop or the soil indicate how to save nitrogen in maize production? Reviewing the state of the art. Field Crops Research, Amsterdam, 66:151-164. Silva, S.A., Arf, O., Buzetti, S. and Silva, M.G. 2008. Fontes e
épocas de aplicação de nitrogênio em trigo em sistema plantio direto no cerrado. Revista Brasileira de Ciência do Solo, 32:2717-2722.
Snyder, C. S., Bruulsema, T.W., Jensen, T.L., Fixen, P.E. 2009. Review of greenhouse gas emissions from crop production systems and fertilizer management effects. Agric. Ecosyst. Environ. 133: 247–266 http://dx.doi.org/10.1016/j.agee.2009.04.021
Soares, J.R., Cantarella,H., Vargas, V.P., Carmo, J.B., Martins, A.A, Sousa, R.M, Andrade, C.A. 2015. Enhanced-efficiency fertilizers in nitrous oxide emissions from urea applied to sugarcane. J. Environ. Qual., 44:423–430. Tasca, F.A., Ernani, P.R., Rogeri, D.A., Gatiboni, L.C. &
Cassol, P.C. 2011. Volatilização de amônia do solo após a aplicação de ureia convencional ou com inibidor de uréase. R. Bras. Ci. Solo, 35:493-502.
Theago, E. Q., Buzetti, S., Filho, M. C. M. T., Andreotti, M., Megda, M. M., BENETT, C.G.S. 2014. Doses, fontes e épocas de aplicação de nitrogênio influenciando teores de clorofila e produtividade do trigo. Revista Brasileira de Ciência do Solo, 38:1826-1835.
Tilman, D., Balzer, C., Hill, J., Befort, B.L. 2011. Global food demand and the sustainable intensification of agriculture. Proc. Natl. Acad. Sci. EUA, 108:20260-20264.
Turner, D. A., Edis, R.B., Chen, D., Freney, JR., Denmead, O.T., Christie, R. 2010. Determination and mitigation of ammonia loss from urea applied to winter wheat with N-(n-butyl) thiophosphorictriamide. Agric. Ecosyst. Environ, 137:261-266.
United states department of agriculture – foreign agricultural service. Trigo em Números; Elaboração: Embrapa Trigo, Passo Fundo – RS. Janeiro, 2014.
Watson, C. J. Urease activity and inhibition – Principles and practice. 2000. In: The International Fertilizer Society Meeting, London, The International Fertilizer Society, Proceedings, 454:39.
Yano, G.T., Takahashi, H.W., Watanabe, T.S. 2005. Avaliação de fontes de nitrogênio e épocas de aplicação em cobertura para ocultivo do trigo. Semina.Ciências Biológicas e da Saúde, Londrina, 26: 41 148.
Zaman, M., Nguyen, M. L., Blennerhassett, J.D. 2010. The effect of different rates of urea with or without urease inhibitor (NBPT) on wheat yield and quality. Agricultural
Journal, 5: 309-312.
Zhou, M.H., Butterbach-Bahl, K. 2014.Assessment of nitrate leaching loss on a yield-scaled basis from maize and wheat cropping systems. Plant Soil, 374:977-991.