Review of Dimensionality Reduction Techniques in
Data Mining from Big Data
Dr Ajay Pratap1, Abhishek Dwivedi2, Dr Harsh Dev3
1
Assistant Professor, 2Research Scholar, AIIT, Amity University Uttar Pradesh, Lucknow Campus
3
Professor, DCS&E, Pranveer Singh Institute of Technology, Kanpur
Abstract: Big Data is a large data index that increases in volume or size with very high velocity and whose variability or complexness is multidimensional. Capturing, managing, and processing or analyzing big data is really a complicated job. At present, big data analysis has reached a new stage. This new stage is known as rapid data where an enormous volume of data in gigabytes congregates with a targeted big data structure efficiently. The present structures of big data accumulate characteristically complex streams of data with respect to the big data offering to 6Vs such as velocity, variability, volume, veracity, value, and variety. After big data processing, a resultant database to be more helpful as compared to noisy, redundant, incompatible, and raw data. Another logical aspect of reducing big data is that it normally contains a large number of variables that makes it tough to discover various patterns as per the requirements. This research paper represents a comprehensive review of diverse methods that are applied for the process of big data reduction and conjointly presents a comprehensive discussion on big data dimension reduction processes, redundancy elimination, automatic learning process, data extraction, size or volume reduction, and big data compression.
Keywords: Bigdata, data compression, data reduction, data complexity, dimensionality reduction
I. INTRODUCTION
The term “big data” connotes a resourceful technique that provides inventive processes for the collection, management, and analysis of amazingly bigger volumes of multidimensional data sets with unmatched speed and accurateness. System developed big data may be structured, semi-structured, or completely unstructured. So, data resultant comes as an authentic way of data management. Big data sets are developed from diverse sources and these data sets can enter into the main system at an applicable range. In simple term, big data is a data set whose volume or size, variability or complexity, and growth or velocity is so high that managing, processing, and analyzing become a tough matter for which specialized software systems like relational database management systems and statistical analysis or visualization software are required. Big data is the grouping of the large scale of data sets that have multi-level variables and that grow really fast. Volume is the most important aspect of big data apart from storage spaces and storage area networks. Extremely big size of data in big data forms multidimensional datasets. Hence, a suitable environment is necessary to segregate this large volume of data in smaller parts for perfect processing and analysis. Moreover, big data stream needs to be prepared online to get an excuse from subsidiary asset utilization for handling the capacity. Another vital aspect of big data is velocity. Velocity in this context depicts the frequency of data streams. Data streaming needs to be reduced for managing big data efficiently. For instance, the space observatories generate terabytes of data each day; it becomes a complex and time-consuming job to manage such huge quantities of data with multidimensional variables, so data reductions are important. At the same time, as stated before, big data comes with several dimensions with respect to features, attributes, and variables. It is, therefore, necessary to reduce its volume and velocity to understand the patterns. For example, individual genomic data throughput sequencing not just makes the data volume enormous, it adds to data dimension as well. In that condition data analysis becomes a tough job. Thus, data reduction becomes necessary to lessen the high measurements while holding highly essential information. This research paper presents an in-depth study of various techniques for big data reduction. A few other compatible research works accomplished in this field are also considered. These accomplished research works either show a non-specific process of big data reduction processes or specific strategies for the reduction of structures. Moreover, a number of open research issues are introduced simultaneously to show some ways of more research in the future.
The primary objectives of this research paper are as follows:
1) A comprehensive literature review and classification of various big data reduction techniques. 2) Analysis of currently available big data reduction techniques.
The research paper is organized in a number of sections for easing the research methods. In the second section, we discuss why big data reduction is necessary and what are the basic complexities in this context. The third section presents various processes of big data reduction. The fourth section presents the basic issues and challenges to the future researchers in this realm. The fifth or last part concludes the paper.
In big data, thousands of dimensions make a problem in data analysis. So, as a part of data pre-processing, data reduction is extremely important in many real-world projects. Multi-dimensionality of big data that may even run in millions in many projects need perfect reduction. This helps in removing unnecessary duplicities, thus, increases accuracy and improves decision-making processes. Most of the algorithms used in different environments today are not efficient enough to deal with high-dimensional data. Hence, big data may become tough to apply. One way to manage big data is to reduce high-dimensionality. High-dimensionality reduction process helps in defining the relationships between the variables more clearly. It also helps to spot the redundant data sets and maintain the integrity of actual information. For all these issues, the primary objective of this research paper is to propose a new process for a high-dimensionality reduction based on sampling methods keeping in focus all the key challenges to big data analysis as discussed before. The researcher uses both classification and statistical methods to improve the competence of the projected method. In the statistical method part, a standard deviation (SD) of the high-dimensionality reduction outcomes will be calculated for all sorts of databases comparing them with the high-dimensionality reduction methods existing now such as PCA, SPCA, SVD, and also with the approach developed in this research paper. The research paper tries to improve the efficacy of the classification methods applied in the dimensionality reduction with the help of full dimension sets from one side and dimensionality reduction processes for three classifiers, viz. Artificial Neural Network (ANN), na•ve Bayesian, and K-Nearest Neighbors.
II. LITERATUREREVIEW
Data mining process consists of three steps: (1) Data Pre-processing (2) Data Analysis, and (3) Data Analysis. The last step includes various models depending on various other variable factors. In this research paper, the research keeps focus on the second step, i.e. Data Pre-processing.
Data Pre-processing is an essential part of data mining. However, this essential part that is accounted for more than 60% of the whole data mining process is often neglected or given less attention. As a result, data comes for analysis is often found to be redundant, noisy, and undervalued. Data analysis with data sets that are not neatly pre-processed gives erroneous data [1]. It is often said, “No quality data, no quality results”. So, un-processed data often fetches erroneous and misleading outcomes. Data should be pre-processed according to the pre-determined ways or formats that could be comfortably acceptable for the news phase users (data analysts). The key tasks in data pre-processing phase are data cleaning, data integration, data transformation, and data reduction. In the data cleaning, all inconsistencies, noises, missing values, and outliers are cleared [2]. In the data integration process, data sets from different sources are merged to create a data warehouse. In the data transformation stage, algorithms are applied to give the same data a different look. In the data reduction stage, the huge volume of data is reduced to a smaller one without changing its basic characteristics [3]. In this research paper, our focus is on the high-dimensionality data reduction. Here, the most common techniques are mentioned in details and then the discussion is made on sampling as the best process for high-dimensionality data reduction keeping the basic characteristics intact.
A. Linear Dimensionality Reduction
Linear dimensionality reduction methods have been developed throughout statistics, ma-chine learning, and applied fields for over a century, and these methods have become in-dispensable tools for analyzing high dimensional, noisy data. These methods produce a low-dimensional linear mapping of the original high-dimensional data that preserves some feature of interest in the data. Accordingly, linear dimensionality reduction can be used for visualizing or exploring structure in data, denoising or compressing data, extracting meaningful feature spaces, and more. This abundance of methods, across a variety of data types and fields, suggests a great complexity to the space of linear dimensionality reduction techniques. As such, there has been little effort to consolidate our understanding.
Natural problem-specific objective occurs when the data X has associated class labels, of which Fisher’s linear discriminant analysis [4] is perhaps the most prominent example. The purpose of LDA is to project the data in such a way that separation between classes is maximized.
proposed [5]. Maximum likelihood approach is proposed by Zhai et al (2014) [8]. Then, there is a co-variance-based approach that is extended to estimate the possibility of errors in the resultant PCA decomposition. In this process, a direct estimation is made on the basis of the co-variance matrix extracted multi-sized data set with the help of non-linear optimization. Kerdprasop et al (2014) researched on the accuracy in recognition and times of executions of two distinct types of multi-dimensionality reduction techniques, viz. LDA (Linear Discriminate Analysis) and PCA (Principle Control Analysis) [9]. They applied these two techniques to biometric image data. There are some algorithms that are trained to recognize images. These algorithms are support vectors with both linear and polynomial Kernel functions. The key drawback in this system (with PCA) is that it can be used just for variables that are homogenous and correlated and in the condition when the datasets are normally distributed. PCA does not work if the actual variables are not assigned a normal condition. The Sparse Principle Component Analysis or SPCA proposed by Zou et al (2006) is an improved PCA classical technique [10]. Its aim is to overcome the issues of correlated methods of PCA with the help of LASSO technique. Lasso is a popular variable selection process often used to produce perfect sparse models. SPCA is founded on the assumption that PCA can be expressed as a problem of regression where the linear combination of the predictors can be used for predicting the response. So, several principal components coefficients become zero developing modified PCA that contains sparse loading. Shen and Huamg (2008) proposed an iterative algorithm generating SPCA through regularized SVD (Singular Value Decomposition) or RSVD that use a close connection between SVD and PCA of the used data matrix. It helps to extract the PCs with the help of low-rank matrix estimation problem [11]. Another effective method proposed by Bai et al (2015) that use SPCA for developing an efficient sparse feature PC for numerous physical symbols [12]. This process identifies an efficient set of index related to non-zero PC entries and follows the power iteration process in the best possible track. SVD is recognized as the most powerful technique for high-dimensionality reduction. It is closely related to PCA since it applies a matrix factorization approach. The major issue of SVD decomposition approach is to detect a low dimensional feature space using matrix products U, S, and V. here, U and V are two prime orthogonal matrices whereas S possesses diagonal features. SVD keeps just r and n positive results with singular value each with low effect to reduce the volume of data. Hence, S becomes a diagonal matrix with just r non-zero positive entries that lowers the dimensions of these three matrices, i.e. U, S, and V to m and r, r and r, and r and n respectively. Several studies on data reduction have used SVD. The studies of Watcharapinchai et al (2009) are based on SVD technique while the work of Lin et al (2014) is based on Sparse SVD (SSVD) [13][14]. The last one, i.e. SSVD can be applied to detect and eliminate unimportant features to ease the selection phase, analyze the limitations of applications, and complexities in basic computations. However, when applied on large datasets, SSVD showed accuracy loss and difficulty in value decomposition of AT A matrix product where A denotes the matrix of the source data.
B. Nonlinear Dimensionality Reduction
Nonlinear dimensionality reduction (NLDR) methods attempt to describe a given high-dimensional set of points as a low dimensional manifold by means of a nonlinear map preserving certain properties of the data. This kind of analysis has applications in numerous fields, such as color perception, pathology tissue analysis, enhancement of MRI images, shape recognition, face recognition, motion understanding, and biochemistry, to mention a few.
C. Sampling Dimensionality Reduction
In sampling dimensionality reduction massive datasets are sampled and the analysis algorithms are applied only on the sampled data. However, in order for smart sampling to be effective need to be able to extract conclusions from small parts of the dataset as if were working on the entire dataset.
In an attempt to make these data more tractable we perform smart sampling by considerably reducing their dimensionality, while retaining the most important information by exploiting the theoretical findings of the CS framework. However, in order to guarantee the correct functionality of CS, we need to know the optimal number of reduced dimensions. It has been theoretically proven that this number is strongly associated with the data sparsity/compressibility.
Other frequently used methods are mostly based on the sampling technique. These methods are applied for getting a representative subset of important and applicable data out of the voluminous dataset. In several occasions, it is found that sampling helps to reduce the cost drastically. However, the most obvious issue in this context is the selection of the correct dataset as a sample that can represent the whole domain. Literature available in this realm discusses different deterministic, random, density-dependent sampling. At the same time, pseudo-random number generator and non-uniform distribution strategies are also applied to bring accuracy in sampling [18]. However, not many works have been done on these two aspects, especially in the multi-dimensional environment of varied datasets. Nave sampling techniques are unsuitable if data is too noisy as the performance of algorithms go on changing without any prior notice and sometimes, such changes are highly significant. In the random sampling, all the information present in the samples that are not the parts of the reduced subsets is ignored at the very first instances [19]. At the same time, it is necessary to create an algorithm with all advanced data reduction features when the environment is multi-dimensional and real-world. In this situation, all heterogeneous aspects of data should be taken into consideration. The existing process of solving POMPD or Partially Observable Markov Decision Processes is proposed by Fakoor and Huber (2012) [20].
This current research study shows that the complicacy of POMPD can be reduced to a great extent by lowering the number of state variables depending on the state variable factors by drawing these sample distributions with the help of conditional distributions and Monte Carlo approach. Coelho et al (2010) applied high-dimensionality reduction techniques in Probabilistic Movement Primitives (ProMP) that are used in robotics [21]. The authors focused on the issue of setting a probabilistic version in the low-dimensional environment. The researchers traced the course of distributions and predicted the basic parameters with the help of model-related stochastic that is again dependent on the maximum likelihood method. According to this method, data uses a multivariate normal distribution that differs from the usual postulations regarding the relationship in the experiential data. It is possible to investigate the sensitivity levels of the results related to these different data distributions assumptions. That will help to understand the most advantageous space dimension of the data.
D. Similarity Measure Dimensionality Reduction
A common data mining task is the estimation of similarity among objects. A similarity measure is a relation between a pair of objects and a scalar number. Common intervals used to mapping the similarity are [-1, 1] or [0, 1], where 1 indicates the maximum of similarity.
Considering the similarity between two numbers x and y as:
Let two time series X = x1… xn, Y = y1… yn, some similarity measures are: - Mean similarity defined as:
- Root mean square similarity:
There are other widely used methods for data reduction based on similarity measures as per Dash et al (2015), when there are noisy or redundant features present, it deteriorates the performance of classification, needs huge loss of memory and also consumes huge time in computation has proposes a reduction technique of three-stage dimensionality for classification of microarray data involving a study of comparison between the four types of classifiers, artificial neural network (ANN), multiple linear regression (MLR), naive Bayesian classifier, and k-nearest neighbor (k-NN), for observing the performance improvement [22]. As evident in the experiment, authors try to decrease the dimension but not at the cost of model performance. Deegalla et al (2012) further put forward a method for reducing dimensionality which undertakes different approaches for classification that is, reliant on the rule of k-nearest neighbor [23]. The reduced set effectiveness can be measured with respect to the classification accuracy. The above method makes an attempt to deduce the consistent minimum set that is one set that can effectively classify the original samples. A discussion by Venugopalan et al (2014) on the ongoing work with respect to the pattern analysis eld for the signals of bio-medics employing a device of Radio Frequency Impedance Interrogation (RFII) to identify user [24]. Furthee a discussion is done on the dimension reduction feasibility of the above signals through the protection of several sub spaces at the time of preservation of the information discrimination and at the same time comparing the performance classification incorporating the reduction methods of traditional dimensionality like ICA, PCA, k-SVD and random projections. For most of the cases, authors seek the space attained on the basis of classification would have merit due to the multiple advantage of high classification and decreased dimension.
Development of methods of effective clustering for datasets of high-dimension is a crucial event. Further, Boutsidis et al (2015) did a study on the concept of the reduction of dimensionality for the clustering of k-means which then encompasses multiple approaches union: 1) an algorithm featured based on selection and chooses minimap set of the features of input there by applying the k-means on features selected. 2) An algorithm feature based on extraction draws a minimal set having artificial features and further applying the constricted features k means [25]. The method of rest feature extraction relies on the random projections where the second relies on SVD factorization based features. Sun et al (2014) has developed a factorization tensor that is dependent on the k mean clustering algorithm as referred to Dimensionality Reduction Assisted Tensor Clustering [26]. Here, the decomposition of tensor can be used for learning difficulties low-dimensional viewing of the tensors given and, at the same time conducting clustering through approximation coupling and learning constraints, that causes PCA Tensor Clustering or the models of Non-negative Tensor Clustering.
Here, we have developed a reduction technique that is based on sampling di-mensionality and can cope with dataset that are high-dimensional. The given approach considers the data's heterogeneous aspects and further models variant multivariate distribution of data incorporating the Copulas theory. It maintains the original information integrity thereby effectively reducing the dataset original high-dimension.
III. COMPLEXITYOFBIGDATAANDWHYWENEEDFORDATAREDUCTION
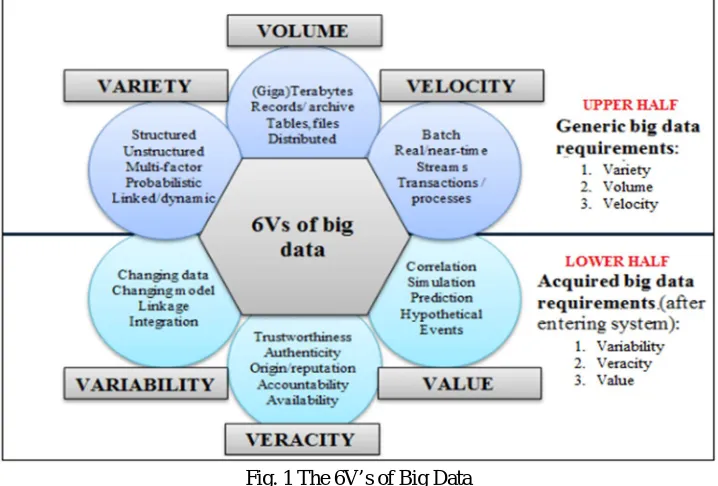
Collection of big data has various arrangements of the networking information online, modern system of sensor, logical framework of trial, associated welling, and some other regions. The large scale data gathered nearby along with the remote gadgets for detection and systems, information system that are empowered through internet as the framework, gadgets, systems logs ,all reveal multi source, heterogeneous, collected, multi-organize, and persistent streams of big data. Effectively taking care of the stream of big data for storing, filing, and questioning the hotspot of the information for handling sidelong information are the major issues that force to the analyst. To be the way it is, several researchers of data are seen to confront the issue of information storm while revealing the learning design of the level of fine grained for the efficient and the big data customization. It is seen that data storm is due to the big data 6Vs properties, mainly the variety, volume, velocity, value, variability and veracity. Then authors Gani et al (2016) hold a discussion on the 6Vs [27].
A. Volume
The data characteristics size appears as big data volume. Being the way it is, huge big data supply suggests that the data amount could be thought of as something big that maps the end goal required as, big data meaning. But, either of size of big data is attributed to the volume that cannot be handled as capable by the computer basic systems.
B. Velocity
C. Variety
System of big data catches data stream from several sources of data that forms multiple format data streams. In this way, system of big data should own the capacity for processing different data stream types to uncover the pattern of hidden knowledge.
D. Veracity
The system of big data value increments at the time of gathering of the data streams from different solid sources. Stream of data gathering can be done and it does not compromise on the data stream quality.
E. Variability
as all sources of data in the framework of big data fails creating information streams having same quality and speed. In these lines, property of variability empowers coping with significant issues.
F. Value
The big data esteem property segment the use ease, utility and big data value system. Such aproperty would bend towards the data analytics results and process of data processing which specifically corresponds to various 5Vs in framework of huge information. The framework of big data should be efficient enough when managing the prolific 6Vs by driving a harmony amidst the destination of information preparing and information handling cost in system of big data. Also, the big data, system complexity builds in three different structures: (1) quality information that is many-sided, (2) nature or computational multi faced, and (3) unpredictability framework. The complexity quality of data rises due to several arrangements and the information unstructured nature that holds several issues of measurements and the entomb complex connections that are dimensional or intra-dimensional.
[image:6.612.127.486.394.637.2]For example, the connection semantic amidst several estimations of same quality, for example, the level of commotion in cities specific territory would reply in the unpredictability dimension. The most recent properties of Big Data can be formulated as a 6V-Paradigm (cp. 5V concept of Mehmet Ulima) [1]. The mentioned V-factors are not undependable however are interlocked with each other (Fig. 2). These V-factors are as follows:
Fig. 1 The 6V’s of Big Data
1) Volume: the amount of generated and stored data is moving from 100PB up to 100EByte nowadays.
2) Velocity: it means the frequency and speed of data acquisition and processing (from slow batch techniques to real time with strong limitation on reaction time or latencies).
3) Variety: multiple codec types of multimedia data. This helps people who analyze it to effectively use the resulting insight. 4) Veracity: The quality of captured data can vary greatly, affecting accurate analysis.
5) Violation: The discussed data are often scattered, without any clustering or any structuring.
Fig. 2 Own 6V-Paradigm [31]
Unfortunately the depicted V-factors for Big Data are growing faster than the performance of their analysis (in Mbyte/s or in GFLOPS) via classical computational techniques.
Big data can also be called as the mining of huge information and is a difficult errand that interfaces endeavour superfluous to decrease the information to a considerable size revealing designs of extreme learning. To deem it useful for investigation of information, several methods of pre-handling to outline, draw, peculiar identification, measuring the commotion expulsion, diminishment, and recognition of exception has been interlinked to refine, lessen, and aid big data cleaning. A US paper, New York Times, states that the researchers of information invest around 50– 80% of energy to clean enormous data. Such a term has been used to be the business part for the earlier processing mentioned that are information wrangling, information robbing, or work of information janitor. A different issue in expansive dimension information of high scale examination is right for model taking which has been created from bigger characteristics quantities having different cases. Such models of learning fit inside the inform preparation, but the testing execution is corrupted [28].
Association of data is the most important part when it comes to talking on the issue of lessening of big data. Information that is of immense importance is the major part that helps secure the information for examination and also representation. Inspite of the statement that the sources for information security and different data set for enhancing the big data productivity, they building the preparing and also development of the information at several farm and bunches levels. Hence, the system of ordering as discussed Gani et al (2016) upgrades the administration of huge information; to be the way it is; several strategies surpass the overhead of information preparing [28]. Despite the fact that unstructured information transformation to organized or semi-organized configurations is important for the success of inquiry execution, this change is the period and a moment of devouring. Additionally, the data is huge in volume and circulated in several storerooms. Similarly, the learning model improvement that reveals worldwide information as enormously conveyed to the huge information is undertaking repetitively.
Lately, several organizations mainly focus on endeavors to transform themselves to system of big data. The big data stream accumulation from Web clients' adjacent to stream of home information (click-streams, geo-areas, ambulation exercises, and wellbeing records) along with the information stream mix that have customized administrations being the key test. The data stream unessential gathering creates computational weight which has a direct influence on the ventures operational cost. This in a way states, the fine grained social occasion, pertinent exceptionally, and reduced data spill against the clients is a test which need the consideration genuine when it plans the system of big data. As of now, the big data client gathered by the outsiders that does not expresses the data and assent related to the commercialization for raising the issues of protection.
The innovative center help for reduction techniques of big data relies on the design in multilayer. The stockpiling data has been empowered through farms of substantial scale server and several figuring bunch systems. Foundation of the capacity has been overseen through the administration of center systems, processing structures that is embarrassingly parallel dispersed, for instance, map reduce implementation of Hadoop and technology for the large- scale virtualization . Huge data's most reduced layers, design the lives of the information sources that are multi-organized that incorporate logical data large-scale streams in others. Such a engineering layered seek processing and the huge level of information that utilize various framework registered at several factors of shape. Likewise, broad model use scopes have been laid up and additional system build for handling of big data.
IV. REDUCTIONMETHODSOFBIGDATA
V. FEATURESELECTIONOFBIGDATA
Selection of features highlighted is the system that has been used for locating the significant highlight better nature from the dataset of the uses measurements of goal. Such days, the selection of Feature turns out to test the issues in the Pattern Recognition field Machine Learning, Mining of Data and Reasoning Case-Based [29]. Selection Highlight is the process to find the imperfect or the ideal set of the x highlight from the primer highlight of X. This needs a large extensive space for attaining the sunset of ideal component. The subset of ideal element has been measured through criteria of assessment. The element choice goal of fundamental is reducing the highlight quantities and the rendering of the repetitive, superfluous and boisterous data.
VI. FEATURESELECTIONPROCEDUREOFBIGDATA
Procedures of highlighting the big data feature have four fundamental stages; as subset age, stopping criterion, subset assessment, and validation of result [30].
A. Subset Generation
This is a huge procedure that will produce applicant having the subset using the technique of certain inquiry. There are two issues fundamental to the procedure. They include inquiry process and seek course. Right at start, they need to choose a beginning stage that affects the inquiry heading. Categorization of search strategies done in random search, complete search, and sequential search.
B. Subset Evaluation
This is the assessment done to assess subset that is recently created. The standard of assessment has been utilized for integrity decision of subset. The criteria of assessment are isolated to Independent, Hybrid and Dependent.
C. Stopping Criteria
This has been utilized for stopping the process of element determination. The process choice of component might stop in any of the given criteria. Several highlight that are predefined is chosen, emphases that are predefined come to, chances on the off, components expansion for delivering idea subset, superior subset, in term of the received assessment standard.
D. Validation
The procedure of validation has been utilized for measuring the final subset to utilize the prior information related to the information. For few applications, highlight pertinent get to be popular in advance, doing an examination of the arrangements known on highlights with the highlight chosen.
VII. FEATURESELECTIONAPPROACHESOFBIGDATA
Various approaches for feature selection on data like wrapper approach filter approach, and hybrid approach exists [15][32]. Few of the statistical measures that have been used to find the selection of feature are Gain Ratio, Information Theory, Information Gain, Mutual Information, Features Selection based on Correlation Symmetric Uncertainty (SU).
VIII. FEATUREEXTRACTIONOFBIGDATA
The extraction system of component has been utilized to attain the crucial data from information first and then speak to the lower dimension data space. Such process has been used for choosing highlight of another arrangement. The charge of component could be nonlinear or direct fusion of unique highlights. Such highlights have been utilized extricated of the technique accompanying. The Analysis of Principal Component (PCA) is the statistical technique classical that has been used for the reduction of the data dimensionality that has several forms of linked variables. It is seen that PCA would decrease the dimensionality through transformation of the dataset original to several variables set, known as principal components, in which the presence of largest variance in dataset original has been taken along with the component maximize for extraction of the important data.
IX. OPENRESEARCHISSUESOFBIGDATA
X. CONCLUSION
Complexity of Big data is a major issue and has to be mitigated. Such methods as said in the paper focus on the issue. All the review of literature as present suggests that no method exists for big data issue handling solely with the 6v. Further, the study discusses method for reducing data with respect to the variety and volume. Also, efforts are needed to decrease the stream of big data both as veracity and velocity. Furthee, several methods need reductions of big data right after the creation of data and the entry to the framework of big data. Being a rule, information diminishment strategies based on pressure appear to be helpful to decrease volume. Also, the overhead do decompression has to be considered for enhancement of effectiveness.
Here, a study done to find the issues related to the high dimensionality issue and is achieved by utilizing lessening distinctive techniques. The given paper made an attempt for giving total information on the choice of highlight of huge information and at the same time removing the highlighted choice or the techniques of highlight extraction. In the techniques of feature selection, selection of the most relevant features had done using the statistical measure and explaining few in detail. In the technique of feature extraction, attainment of the new feature done from original features taking help from several statistical techniques and the common statistical techniques has been defined. So, the paper would help beginners that are performing research in the domain of reduction techniques.
REFERENCES
[1] Rehman, M. H., Liew, C. S., Abbas, A., Jayaraman, P. P., Wah, T. Y., & Khan, S. U. (2016). Big Data Reduction Methods: A Survey. Data Science and Engineering, 1(4), 265–284.
[2] Jin, X., Wah, B. W., Cheng, X., & Wang, Y. (2015). Significance and Challenges of Big Data Research. Big Data Research, 2(2), 59–64.
[3] Battams, K. (2015). Stream mining for solar physics: Applications and implications for big solar data. Proceedings - 2014 IEEE International Conference on Big Data, IEEE Big Data 2014, 18–26.
[4] Chandramouli, B., Goldstein, J., & Duan, S. (2012). Temporal analytics on big data for web advertising. Proceedings - International Conference on Data Engineering, 90–101.
[5] Houari, R., Bounceur, A., & Kechadi, M.-T. (2013a). A new method for dimensionality reduction of multidimensional data using copulas. In Programming and Systems (ISPS), 2013 11th International Symposium on (pp. 40-46). IEEE.
[6] Han, J., & Kamber, M. (2006). Data Mining: Concepts and Techniques. 13: 978-1-55860-901-3 (2nd Ed.). Diane Cerra.
[7] Sasikala, S., & Balamurugan, S. A. A. (2013). Data classification using pca based on effective variance coverage (evc). In Emerging Trends in Computing, Communication and Nanotechnology (ICE-CCN), 2013 International Conference on (pp. 727-732). IEEE.
[8] Zhai, M., Shi, F., Duncan, D., & Jacobs, N. (2014). Covariance-based pca for multi-size data. In Pattern Recognition (ICPR), 2014 22nd International Conference on (pp. 1603-1608). IEEE.
[9] Kerdprasop, N., Chanklan, R., Hirunyawanakul, A., & Kerdprasop, K. (2014). An empirical study of dimensionality reduction methods for biometric recognition. In Security Technology (SecTech), 2014 7th International Conference on (pp. 26-29). IEEE.
[10] Zou, H., Hastie, T., & Tibshirani, R. (2006). Sparse principal component analysis. Journal of computational and graphical statistics, 15, 265-286.
[11] Shen, H., & Huang, J. Z. (2008). Sparse principal component analysis via regularized low rank matrix approximation. Journal of multivariate analysis, 99, 1015-1034.
[12] Bai, D., Liming, W., Chan, W., Wu, Q., Huang, D., & Fu, S. (2015). Sparse principal component analysis for feature selection of multiple physiological signals from light task. In Control, Automation and Systems (ICCAS), 2015 15th International Conference on (pp. 627-631). IEEE.
[13] Watcharapinchai, N., Aramvith, S., Siddhichai, S., & Marukatat, S. (2009). Dimensionality reduction of sift using pca for object categorization. In Intelligent Signal Processing and Communications Systems, 2008. ISPACS 2008. International Symposium on (pp. 1-4). IEEE.
[14] Lin, P., Zhang, J., &An, R. (2014). Data dimensionality reduction approach to improve feature selection performance using sparser svd. In Neural Networks (IJCNN), 2014 International Joint Conference on (pp. 1393-1400). IEEE.
[15] Gisbrecht, A., & Hammer, B. (2015). Data visualization by nonlinear dimensionality reduction. Wiley Interdisciplinary Reviews: Data Mining and Knowledge Discovery, 5, 51-73.
[16] Hettiarachchi, R., & Peters, J. (2015). Multi-manifold LLE learning in pattern recognition. Pattern Recognition, 48, 2947-2960.
[17] Zhang, T., Du, Y., Huang, T., & Li, X. (2016). Stochastic simulation of geological data using isometric mapping and multiple-point geostatistics with data incorporation. Journal of Applied Geophysics, 125, 14-25.
[18] Rubinstein, R. Y., & Kroese, D. P. (2011). Simulation and the Monte Carlo method volume 707. John Wiley & Sons.
[19] Whelan, M., Khac, N. A. L., Kechadi, M. et al. (2010). Data reduction in very large spatio-temporal datasets. In Enabling Technologies: Infrastructures for Collaborative Enterprises (WETICE), 2010 19th IEEE International Workshop on (pp. 104-109). IEEE.
[20] Fakoor, R., & Huber, M. (2012). A sampling-based approach to reduce the complexity of continuous state space POMDPs by decomposition into coupled perceptual and decision processes. In Machine Learning and Applications (ICMLA), 2012 11th International Conference on (pp. 687-692). IEEE volume 1. [21] Coelho, F., Braga, A. P., & Verleysen, M. (2010). Selection and Model Selection Based on Pearson’s Correlation Coefficient. Proceedings of the 2012
International Conference of Modern Computer Science and Applications, 509–516.
[22] Dash, R., Misra, B., Dehuri, S., & Cho, S.-B. (2015). Efficient microarray data classification with three-stage dimensionality reduction. In Intelligent Computing, Communication and Devices (pp. 805-812). Springer.
[24] Venugopalan, S., Savvides, M., Griofa, M. O., & Cohen, K. (2014). Analysis of low-dimensional radio-frequency impedance-based cardio-synchronous waveforms for biometric authentication. Biomedical Engineering, IEEE Transactions on, 61, 2324-2335.
[25] Boutsidis, C., Zouzias, A., Mahoney, M. W., & Drineas, P. (2015). Randomized dimensionality reduction for-means clustering. Information Theory, IEEE Transactions on, 61, 1045-1062.
[26] Sun, Y., Gao, J., Hong, X., Guo, Y., & Harris, C. J. (2014). Dimensionality reduction assisted tensor clustering. In Neural Networks (IJCNN), 2014 International Joint Conference on (pp. 1565-1572). IEEE.
[27] Gani, A., Siddiqa, A., Shamshirband, S., & Hanum, F. (2016). A survey on indexing techniques for big data: taxonomy and performance evaluation. Knowledge and Information Systems, 46(2), 241–284.
[28] Ma, C., Zhang, H. H., & Wang, X. (2014). Machine learning for Big Data analytics in plants. Trends in Plant Science, 19(12), 798–808.
[29] Balamurugan, S. A. A., & Rajaram, R. (2009). Effective and efficient feature selection for large-scale data using Bayes’ theorem. International Journal of Automation and Computing, 6(1), 62-71.
[30] Dong, M., Hua, J., & Li, Y. (2007). A Gaussian Mixture Model to Detect Clusters Embedded in Feature Subspace. Communications in Information and Systems, 7(4), 337–352.
[31] Kuiler, E. (2014). From Big Data to Knowledge: An Ontological Approach to Big Data Analytics, Review of Policy Research, 31(4).
![Fig. 2 Own 6V-Paradigm [31]](https://thumb-us.123doks.com/thumbv2/123dok_us/1241585.650185/7.612.122.493.78.166/fig-own-v-paradigm.webp)
