WordNet Based Features for Predicting Brain
Activity associated with meanings of nouns
Ahmad Babaeian Jelodar, Mehrdad Alizadeh, and Shahram Khadivi
Computer Engineering Department, Amirkabir University of Technology424 Hafez Avenue, Tehran, Iran
{ahmadb_jelodar, mehr.alizadeh, khadivi}@aut.ac.ir
Abstract
Different studies have been conducted for predicting human brain activity associated with the semantics of nouns. Corpus based approaches have been used for deriving fea-ture vectors of concrete nouns, to model the brain activity associated with that noun. In this paper a computational model is proposed in which, the feature vectors for each concrete noun is computed by the WordNet similarity of that noun with the 25 sensory-motor verbs suggested by psychologists. The feature vec-tors are used for training a linear model to predict functional MRI images of the brain as-sociated with nouns. The WordNet extracted features are also combined with corpus based semantic features of the nouns. The combined features give better results in predicting hu-man brain activity related to concrete nouns.
1
Introduction
The study of human brain function has received great attention in recent years from the advent of functional Magnetic Resonance Imaging (fMRI). fMRI is a 3D imaging method, that gives the abili-ty to perceive brain activiabili-ty in human subjects. A three dimensional fMRI image contains approx-imately 15000 voxels (3D pixels). Since its advent, fMRI has been used to conduct hundreds of studies that identify specific regions of the brain that are activated on average when a human performs a particular cognitive function (e.g., reading, mental imagery). A great body of these publications show that averaging together fMRI data collected over
multiple time intervals, while the subject responds to some kind of repeated stimuli (reading words), can present descriptive statistics of brain activity (Mitchell et al., 2004).
Conceptual meanings of different words and pic-tures trigger different brain activity. The represen-tation of conceptual knowledge in the human brain has been studied by different science communities such as psychologists, neuroscientists, linguists, and computational linguists. Some of these ap-proaches focus on visual features of picture stimuli to analyze fMRI activation associated with viewing the picture (O’Toole et al, 2005) (Hardoon et al., 2007). Recent work (Kay et al., 2008) has shown that it is possible to predict aspects of fMRI activa-tion based on visual features of arbitrary scenes and to use this predicted activation to identify which of a set of candidate scenes an individual is viewing. Studies of neural representations in the brain have mostly focused on just cataloging the patterns of fMRI activity associated with specific categories of words. Mitchell et al present a ma-chine learning approach that is able to predict the fMRI activity for arbitrary words (Mitchell et al., 2008).
In this paper a computational model similar to the computational model in (Mitchell et al., 2008) is proposed for predicting the neural activation of a given stimulus word. Mitchell et al performs pre-diction of the neural fMRI activation based on a feature vector for each noun. The feature vector is extracted by the co-occurrences of each individual concrete noun with each of the 25 sensory-motor verbs, gathered from a huge google corpus (Brants, 2006). The feature vector of each noun is used to
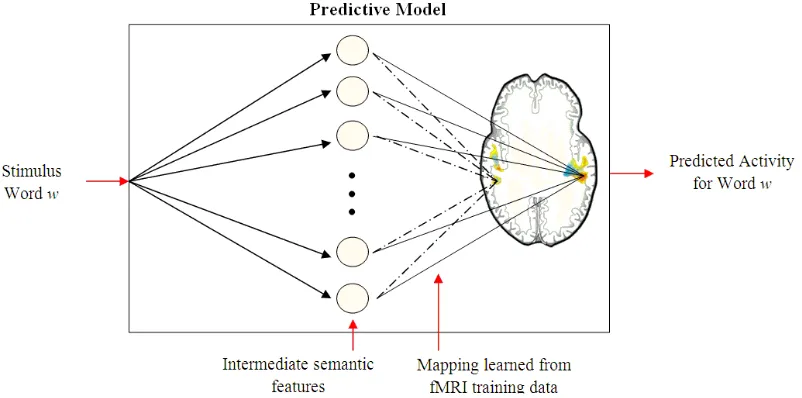
Figure 1 - Structure of the model for predicting fMRI activation for arbitrary stimuli word w
predict the activity of each voxel in the brain, by assuming a weighted linear model (Figure 1).
The activity of a voxel is defined as a conti-nuous value that is assigned to it in the functional imaging1 procedure. Mitchell et al applied a linear model based on its high consistency with the wide-spread use of linear models in fMRI analysis. In this paper focus is on using WordNet based tures (in comparison to co-occurrence based fea-tures), therefore the linear model proposed and justified by Mitchell et al is used and other models like SVM are not even considered. Mitchell et al, suggests that the trained model is able to predict brain activity even for unseen concepts and there-fore notes that a great step forward in modeling brain activity is taken in comparison to the pre-vious cataloging approaches for brain activity. This model does not work well in case of ambiguity in meaning, for example a word like saw has two meanings, as a noun and as a verb, making it diffi-cult to construct the suitable feature vector for this word. We try to alleviate this problem in this paper and achieve better models by combining different models in case of ambiguity.
In our work, we use the sensory-motor verbs which are suggested by psychologists and are also used by (Mitchell et al., 2008), to extract the
1Functional images were acquired on a Siemens (Erlangen,
Germany) Allegra 3.0T scanner at the Brain Imaging Re-search Center of Carnegie Mellon University and the Univer-sity of Pittsburgh (supporting online material of Mitchell et al. 2008).
ture vectors. But, instead of using a corpus to ex-tract the co-occurrences of concrete nouns with these verbs we use WordNet to find the similarities of each noun with the 25 sensory-motor verbs. We also combine the WordNet extracted model with the corpus based model, and achieve better results in matching predicted fMRI images (from the model) to their own observed images.
This paper is organized as follows: in section 2 a brief introduction to WordNet measures is de-scribed. In section 3, the WordNet approaches ap-plied in the experiments and the Mitchell et al linear model are explained. The results of the expe-riments are discussed in section 4 and finally in section 5 the results and experiments are con-cluded.
2 WordNet-based Similarity
2.1 WordNet
WorNet is a semantic lexicon database for English language and is one of the most important and widely used lexical resources for natural language processing tasks (Fellbaum, 1998), such as word sense disambiguation, information retrieval, auto-matic text classification, and autoauto-matic text sum-marization.
real world concept associated with that node. Se-mantic relations are like pointers between synsets. The synsets in WordNet are divided into four dis-tinct categories, each corresponding to four of the parts of speech – nouns, verbs, adjectives and ad-verbs (Pathwarden, 2003).
WordNet is a lexical inheritance system. The re-lation between two nodes show the level of gene-rality in an is–a hierarchy of concepts. For example the relation between horse and mammal
shows the inheritance of horse is-a mammal.
2.2 Similarity
Many attempts have investigated to approximate human judgment of similarity between objects. Measures of similarity use information found in is– a hierarchy of concepts (or synsets), and quantify how much concept A is like concept B (Pedersen, 2004). Such a measure might show that a horseis more like a cat than it is like a window, due to the fact that horseand catshare mammalas an ances-tor in the WordNet noun hierarchy.
Similarity is a fundamental and widely used concept and refers to relatedness between two con-cepts in WordNet. Many similarity measures have been proposed for WordNet–based measures of semantic similarity, such as information content (Resnik, 1995), JCN (Jiang and Conrath, 1997), LCH (Leacock and Chodorow, 1998), and Lin (Lin, 1998).
These measures have limited the part of speech (POS) of words, for example it is not defined to measure the similarity between verb see and noun
eye. There is another set of similarity measures which work beyond this boundary of POS limita-tion. These measures are called semantic related-ness measures; such as Lesk (Banerjee and Pedersen, 2003), and Vector (Patwardhan, 2003).
The simple idea behind the LCH method is to compute the shortest path of two concepts in a WordNet unified hierarchy tree. The LCH measure is defined as follows (Leacock and Chodorow, 1998):
(1)
Similarity is measured between concepts c1 and c2, and D is the maximum depth of taxonomy; therefore the longest path is at most 2D.
Statistical information from large corpora is used to estimate the information content of
con-cepts. Information content of a concept measures the specificity or the generality of that concept.
IC(c)= - log(freqfreq(root(c))) (2)
freq(c) is defined as the sum of frequencies of all concepts in subtree of conceptc. The frequency of each concept is counted in a large corpus. There-fore freq(root)includes frequency count of all con-cepts.
The LCS (Longest Common Subsummer) of concepts A and B is the most specific concept that is an ancestor of both A and B. Resnik defined the similarity of two concepts as follows (Resnik, 1995):
relatednessres(c1,c2)=IC(lcs(c1,c2)) (3)
IC(lcs(c1,c2))is the information content of Longest Common Subsummer of concepts c1and c2.
The Lin measure, augment the information con-tent of the LCS with the sum of the information content of concepts c1 and c2. The Lin measure scales the information content of the LCS by this sum. The similarity measure proposed by Lin, is defined as follows (Lin, 1998):
relatednesslin(c1,c2)=2.IC(lcs(c1,c2))
IC(c1)+IC(c2) (4)
IC(c1)and IC(c2) are information content of con-cepts c1and c2, respectively.
Jiang and Conrath proposed another formula named JCN as a similarity measure which is shown below (Jiang and Conrath, 1997):
relatednessjcn(c1,c2)=IC 1
(c1)+IC(c2)-2.IC(lcs(c1,c2)) (5) The Lesk is a measure of semantic relatedness between concepts that is based on the number of shared words (overlaps) in their definitions (glosses). This measure extends the glosses of the concepts under consideration to include the
glosses of other concepts to which they are re-lated according to a given concept hierarchy (Ba-nerjee and Pedersen, 2003). This method makes it possible to measure similarity between nouns and verbs.
3
Approaches
As mentioned in the previous section, different WordNet measures can be used to compute the similarities between two concepts. The WordNet similarity measures are used to compute the verb-concept similarities. The feature matrix comprises of the similarities between 25 verbs (features) and 60 concrete nouns (instances). In this section the computational model proposed by (Mitchell et al., 2008), WordNet-based models, and combinatory models are briefly described.
3.1 Mitchell et al Baseline Model
In our paper we used the Mitchell et al regression model for predicting human brain actively as our baseline. In all of the experiments in this paper, we use the fMRI data gathered by Mitchell et al. The fMRI data were collected from nine healthy, college age participants who viewed 60 different word-picture pairs presented six times each (Mitchell et al. 2008). In Mitchell et al, for each concept, a feature vector containing norma-lized co-occurrences with 25 sensory-motor verbs, gathered from a huge google corpus (Brants, 2006), is constructed. The computational model was evaluated using the collected fMRI data ga-thered by Mitchell et al. Mean fMRI images were constructed from the primary fMRI images, before training. A linear regression model was trained, using 58 (from 60) average brain images for each subject that maps these features to the correspond-ing brain image. For testcorrespond-ing the model, the two left out brain images were compared with their corres-ponding predicted images, obtained from the trained model. The Pearson correlation (Equation 6) was used for comparing whether each predicted image has more similarity with its own observed image (match1) or the other left out observed im-age (match2).
match1(p1=i1 & p2=i2)=
pearsonCorrelation(p1,i1)+
pearsonCorrelation(p2,i2) (6)
p1,p2 are predicted images, and i1, i2 are corres-ponding observed images.
For calculating the accuracy we check whether the classification is done correctly or not. By se-lecting two arbitrary concepts (of sixty concepts) as test, there would be 1770 different
tions. The overall percentage of correct classifica-tion represents the accuracy of the model.
We tried to use the same implementations in (Mitchell et al., 2008) as our baseline. We imple-mented the training and test models as described in the supporting online material of Mitchell et al’s paper, but due to some probable unseen differences for example in the voxel selection, the classifica-tion accuracies achieved by our replicated baseline of Mitchell et al’s is in average less than the accu-racies attained by (Mitchell et al., 2008). In the test phase we used 500 selected voxels for comparison. The training is done for all 9 participants.
This procedure is used in all the other approach-es mentioned in this section. We have contacted the authors of the paper and we are trying to re-solve the problem of our baseline.
3.2 WordNet based Models
As mentioned in section 2, several WordNet–based similarity measures have been proposed (Pedersen, 2004). We apply some of the known measures to construct the feature matrix, and use them to train the models of 9 participants.
WordNet::Similarity is a utility program availa-ble on web2 to compute information content val-ues. WordNet::Similarity implements measures of similarity and relatedness that are all in some way based on the structure and content of WordNet (Resnik, 2004).
As mentioned in section 2, every concept in WordNet consists of a set of words (synsets). The similarity between two concepts is defined as a series of similarities between synsets of the first concept and synsets of the second concept. In this paper the maximum similarity between synsets of two concepts is considered as the candidate simi-larity between two concepts.
In contrary to relatedness measures, similarity measures have the limitation of POS of words. In our case the verb-noun pair similarity is not de-fined when using similarity measures. To solve this problem the sense (POS) of verb features are as-sumed to be free (verb, noun, adjective and ad-verb). For most cases the meaning of a verb sense of a word is close to the non-verb senses of that
2
word. For example the verb clean can be seen as a noun, adjective, and adverb which all have close meanings. Some problems arise by this assump-tion. For example the verb Watch has a far mean-ing of the noun Watch or some verbs like eat do not have a non-verb sense. To handle these issues the combination of the relatedness measures and similarity measures is used. This approach is dis-cussed in section 3.3 to make a more suitable fea-ture matrix.
The two leave out cross-validation accuracies of regression models trained by feature matrices (computed from WordNet similarities) are depicted in Figure 2. The results helped us to select two measures for a final feature construction. The re-sults are discussed and analyzed in the next sec-tion.
3.3 Lin/Lesk and JCN/Lesk based features
The experiments show that, JCN similarity meas-ure gives the best results on extracting the featmeas-ure vectors for predicting brain activity. Unfortunately, some similarity measures like JCN and Lin feature matrices are to some extent sparse. In some cases, the feature (sensory-motor verb) or even a concept is represented by a null vector. The null input data do not affect the linear regression training, but lead to less data for training the model. This anomaly is originated from the fact that some verbs do not have related non-verb senses (POS).
On the other hand, relatedness measures (like Lesk) do not limit the POS of words. In conse-quence, we have non-zero values for every element of the feature matrix. This motivates us to combine Lesk similarity measure with Lin to alleviate the defect mentioned above.
Combination is based on finding a better feature matrix from the two Lin (JCN) and Lesk feature matrices. For this, a linear averaging is considered between Lin (JCN) and Lesk feature matrices.
3.4 Combinatory Schemes
In this paper, a new approach for extracting the feature matrix using WordNet is presented and dif-ferent similarity measures for representing this fea-ture matrix are investigated.
In this section, we propose new combinatory approaches for combining Mitchell et al’s corpus
based approach with our WordNet based approach. We assume that we have two feature matrices, one based on the corpus-based (baseline) method and the other based on a WordNet-based (Lin/Lesk similarity measure) method.
3.4.1 Linear combination
The first approach for combining WordNet and baseline models, is based on assigning weights (λ,1- λ) to the models, for calculation of match1
and match2. match1of baseline model is assigned weight λ, and match1 of WordNet model is as-signed weight (1- λ), for calculating the final
match1of the system (Equation 7).
match1=
λ.(match1Baseline)+(1-λ).(match1WordNet)(7)
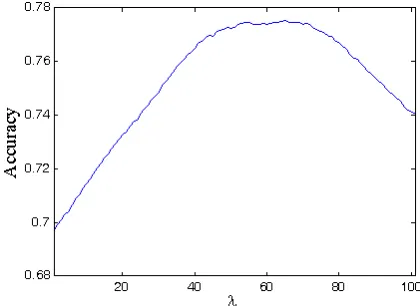
[image:5.612.318.528.366.519.2]match2 is calculated in the same way. Classifica-tion is assumed to be correct when match1 gets a greater value than match2. The parameter λ needs to be tuned. Different values of λ were tested and their output accuracies are depicted in Figure 2.
Figure 2 –accuracies of different λ values
3.4.2 Concept based combination
The performance of computational models can be analyzed from a different view. We are looking for a combination mechanism based on model accura-cies for classifying a concept pair. This combina-tion mechanism estimates weights for WordNet and baseline models for testing a left out pair. To have a system with the ability to work properly on unseen nouns, we leave out all the concept pairs that have concepts c1 or c2 (117 pairs). This
guar-antees that the trained model is blind to concepts c1
Table 1- Voting mechanism
training (1653 pairs).
The accuracies of WordNet and baseline models for the training set are derived and weight of base-line model is calculated as follows:
λ = Accuracy(BaseAccuracy)+ Accuracy(WordNet)(Base) (8)
weight of WordNet model is calculated in a similar way. Relation 7 is used for calculating match1and
match2. For calculating the accuracy we check whether the classification is done correctly or not. This procedure is repeated for each arbitrary pair (1770 iterations) to calculate the overall accuracy of the combinatory system.
3.4.3 Voting based combination schemes
In many intelligent combinatory systems, the ma-jority voting scheme is an approach for determin-ing the final output. Mitchell et al collected data for 9 participants. In this approach a voting is per-formed on the models of 8 participants (participant j=1:9, j≠i) for each concept pair (the two left out concepts), to select the better model amongst WordNet and baseline models. The better model is the model that leads to higher accuracy in classify-ing the left out concepts of 8 participants ( partici-pant j=1:9, j≠i). The selected model is used to test the model for pi(participant i).
Votes for selecting the better model for each participant is calculated as shown in Table 1.
match1Baseand match1WordNetrepresent match1
for baseline and WordNet models.
match1=voteBase
8 (match1Base)+
voteWordNet
8 (match1WordNet) (9) Another approach is linear voting combination. This approach is based on calculating match1and
match2 for a model, based on a weighted linear combination (relation 9). The weights for a combi-natory model are calculated by a voting mechan-ism (Table 1).
4 Results and Discussion
As mentioned in section 2, it is possible to con-struct the feature matrix based on WordNet simi-larity measures. Seven different measures were tested and models for 9 participants were trained using a 2-leave out cross validation. Four similarity measures (Lin, JCN, LCH, and Resnik), two simi-larity relatedness measures (Lesk and Vector), a combination of Lin/ Lesk and a combination of JCN/ Lesk are compared to the baseline. The re-sults based on accuracies of these tests are shown in Table 3. The accuracies are calculated from counts of match scores. The match score between the two predicted and the two observed fMRI im-ages was determined by which match (match1 or
match2) had a higher Pearson correlation, eva-luated over 500 voxels with the most stable res-ponses across training presentations.
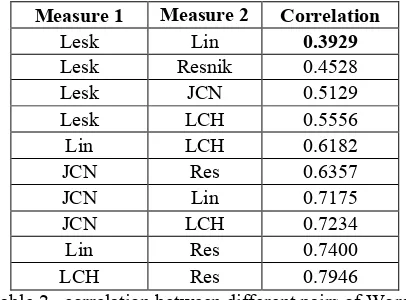
accuracies among all single measures (Table 3). Despite the lower average accuracy of the Lin me-thod, the combination of Lin/Lesk achieved a bet-ter average accuracy in comparison to JCN/Lesk combination. This is probably because of the lower correlation between Lin/Lesk feature vectors in comparison to JCN/Lesk feature vectors. The cor-relation between different pairs of feature matrices extracted by WordNet-based similarity measures are shown in Table 2. The result shows that Lesk feature matrix has minimum correlations with all other WordNet-based feature matrices. This is a good motivation to have the Lesk measure as a candidate to mix with other measures to extract a more informative feature matrix. The Lesk feature matrix has the least correlation with Lin feature matrix among all WordNet-based feature matrices. Therefore as noted before, results of Table 3 show better accuracy for Lin/Lesk in comparison to JCN/Lesk. But these accuracies are less than the accuracies attained by the base method proposed by Mitchell et al.
Measure 1 Measure 2 Correlation
Lesk Lin 0.3929
Lesk Resnik 0.4528
Lesk JCN 0.5129
Lesk LCH 0.5556
Lin LCH 0.6182
JCN Res 0.6357
JCN Lin 0.7175
JCN LCH 0.7234
Lin Res 0.7400
[image:7.612.316.535.105.339.2]LCH Res 0.7946
Table 2– correlation between different pairs of Word-Net-based similarity (relatedness) measures
One important reason of this shortage can be the difference in sense (POS) between concepts (with noun POS) and features (with verb POS). This leads to limitation of WorldNet-based measures for constructing better feature matrices. Investigating new features of the same sense of POS between concepts and features (associated with sensory-motor verbs) might lead to even better results.
The Base and WordNet use ultimately different approaches to compute the similarity of each pair of concepts. Several experiments like the union of features and the combination of system outputs
[image:7.612.321.527.217.348.2] [image:7.612.83.286.356.506.2]was designed. The union of the two feature matric-es (baseline feature matrix and Lin/Lmatric-esk feature matrix) does not lead to a better result (0.646). In contrary to the united features the combination of these systems gives a better performance. Three different schemes of combinatory systems are pro-posed in section 4. The first scheme (linear combi-nation) uses a fixed ratio (λ) for combining the output match of the two systems. As depicted in Figure 2 the λvalue is tuned and an optimum value of λ=0.64 achieved an average accuracy of 0.775 (Table 4).
Figure 3- Improvement of linear combinatory scheme
The accuracies of participants P1and P5for our implemented baseline are almost the same as the accuracies of P1 and P5 in Mitchell et al. A com-parison of the accuracies for P1and P5attained by the baseline model and the linear combination scheme is illustrated in Figure 3. The results show considerable improvement in accuracies when the combinatory model is used.
[image:7.612.318.537.503.645.2]Measure/
Partic-ipant P1 P2 P3 P4 P5 P6 P7 P8 P9 Average
Baseline 0.828 0.845 0.752 0.798 0.776 0.658 0.705 0.615 0.680 0.740
Lin 0.73 0.624 0.739 0.727 0.591 0.507 0.64 0.501 0.632 0.632
Lesk 0.725 0.629 0.668 0.688 0.601 0.519 0.604 0.584 0.580 0.622
Vector 0.603 0.599 0.551 0.553 0.567 0.451 0.509 0.446 0.476 0.529
LCH 0.685 0.613 0.671 0.617 0.574 0.468 0.577 0.506 0.587 0.589
RES 0.610 0.558 0.594 0.622 0.505 0.555 0.603 0.449 0.490 0.554
JCN 0.797 0.638 0.765 0.713 0.671 0.525 0.504 0.568 0.642 0.647
Lin/Lesk 0.807 0.677 0.767 0.812 0.672 0.645 0.690 0.502 0.697 0.697
[image:8.612.74.539.63.362.2]JCN/Lesk 0.790 0.604 0.718 0.789 0.641 0.593 0.593 0.514 0.667 0.656
Table 3- Results of Different similarity measures compared to baseline
Approach/
Par-ticipant P1 P2 P3 P4 P5 P6 P7 P8 P9 Average
Linear 0.877 0.847 0.827 0.862 0.798 0.696 0.734 0.605 0.728 0.775
Concept-based 0.887 0.832 0.836 0.87 0.793 0.687 0.736 0.588 0.734 0.774
Binary voting 0.894 0.837 0.829 0.858 0.796 0.684 0.758 0.612 0.736 0.778
Weighted voting 0.905 0.840 0.861 0.882 0.808 0.710 0.761 0.614 0.755 0.793 Table 4- Accuracies of different combinatory approaches
The improvement of this combinatory scheme can be viewed from another aspect. Concept accu-racy, defined as classification accuracy of the concept paired with each of the other 59 concepts, shows the performance of the system for each con-cept (Figure 4). The concon-cept accuracies of the li-near combinatory scheme are compared with the Baseline and WordNet systems and results are illustrated in Figure 4. The accuracy of some ambiguous concrete nouns like ‘saw’ are improved in WordNet-based model and this improvement is maintained by linear combinatory model. Im-provements have been seen in combinatory model. The second scheme uses a cross validation of the remaining 58 concepts to train the system, for deciding on each pair of concepts. After training, each system (WordNet and Base) is assigned a weight according to its accuracy. Decision on the test pair is based on a weighted combination of the systems. The results of this scheme are shown in Table 4. It has an improvement of 3.4% in compar-ison to the baseline model.
The third scheme chooses another combinatory strategy to decide on each test pair of concepts for
participant Pi. This scheme gathers votes from the other 8 participants as described in section 3. The results are shown in Table 4. Improvement of bi-nary voting scheme to baseline is almost as much as the Improvement of linear and concept-based schemes to baseline. The weighted voting used a more flexible combination scheme, and led to an improvement of about 5.3% in comparison to base-line.
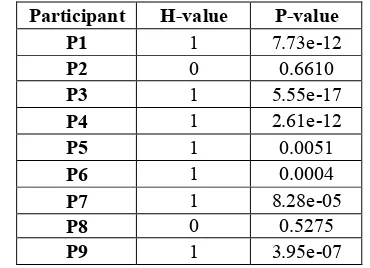
A result is called statistically significant if it is improbable to have occurred by chance. T-test
Participant H-value P-value
P1 1 7.73e-12
P2 0 0.6610
P3 1 5.55e-17
P4 1 2.61e-12
P5 1 0.0051
P6 1 0.0004
P7 1 8.28e-05
P8 0 0.5275
[image:8.612.332.517.552.686.2]P9 1 3.95e-07
was used to show whether the improvement achieved in this paper is statistically significant or not. The t-test was tested on output accuracies of baseline (with average accuracy 0.74) and weighted voting combinatory scheme (with aver-age accuracy 0.793) for 9 participants. The results are shown in Table 5. The weighted voting scheme does not have improvement on P2 and P8 and results are almost similar to baseline, therefore the null hypothesis of equal mean is not rejected (H-value=0) at 0.05 confidence level. For all par-ticipants with improvement on results, null hypo-thesis of equal mean is rejected (H-value=1) at 0.05 confidence level. This rejection shows that the improvements are approved to be statistically sig-nificant for all participants with improvement. The t-test on overall 9 participants rejected null hypo-thesis with a P-value of almost zero. This experi-ment shows the improveexperi-ment achieved in this paper is statistical significant.
5 Conclusion
In this work, a new WordNet-based similarity ap-proach for deriving the sensory-motor feature vec-tors associated with the concrete nouns was introduced. A correlation based combination of WordNet measures is used to attain more informa-tive feature vectors. The computational model trained by these feature vectors are combined with the computational model trained with feature vec-tors extracted by a corpus based method.
The combinatory scheme achieves a better aver-age accuracy in predicting the brain activity asso-ciated with the meaning of concrete nouns. Investigating new features of the same sense (POS) between concepts and non-verb features (asso-ciated with sensory-motor verbs) might lead to even better results for WordNet-based Models.
Acknowledgements
The authors would like to thank the anonymous reviewers for their thorough review and their con-structive comments.
References
Banerjee, S., and Pedersen, T. 2003. Extended gloss overlaps as a measure of semantic relatedness. In
Pro-ceedings of the Eighteenth International Joint Confe-rence on Artificial Intelligence, 805–810.
Brants T., and Franz A., 2006,
www.ldc.upenn.edu/Catalog/CatalogEntr y.jsp?catalogId=LDC2006T13. Linguistic Data Consortium, Philadelphia.
Fellbaum C., 1998. WordNet: An Electronic Lexical Database.The MIT Press, Cambridge, MA.
Hardoon D. R., Mourao-Miranda J., M. Brammer, Shawe-Taylor J. 2007. unsupervised analysis of fMRI data using kernel canonical correlation. Neuroimage, pp. 1250-1259.
Kay K. N., Naselaris T., Prenger R. J., Gallant J. L. 2008. Identifying Natural Images from Human Brain Activity, Nature, pp. 352-355.
Leacock C. and Chodorow M. 1998. Combining lo-cal context andWordNet similarity for word sense iden-tification. In C. Fellbaum, editor, WordNet: An electronic lexical database, pages 265–283. MIT Press.
Lin D. 1998. An information-theoretic definition of similarity. In Proceedings of the International Confe-rence on Machine Learning, Madison.
Mitchell T. M., et al. 2008. Predicting Human Brain Activity Associated with the Meanings of Nouns, Ameri-can Association for the Advancement of Science.
Mitchell T. M., Hutchinson R. A., Niculescu R. S., Pereira F., and Wang X.. 2004. Learning to Decode Cognitive States from Brain Images, Machine Learning, pp. 145-175.
O’Toole A. J., Jiang F., Abdi H., and Haxby J. V.. 2005. Partially distributed representations of objects and faces in ventral temporal cortex. Journal of Cogni-tive Neuroscience, pp. 580-590.
Patwardhan S. 2003. Incorporating dictionary and corpus information into a context vector measure of semantic relatedness. Master’s thesis, University of Minnesota, Duluth.
Pedersen T., Patwardhan S., and Michelizzi J. 2004. WordNet::Similarity - Measuring the relatedness of Concepts. Proceedings of Fifth Annual Meeting of the North American Chapter of the Association for Compu-tational Linguistics (NAACL-04), pp. 38-41.