Recent Trends in Monetary Policy
R. Kelleher
Special Article
in
QUARTERLY
ECONOMIC
COMMENTARY
January 1980
Introduction
RECENT TRENDS IN MONETARY POLICY by R. Kelleher
It is generally agreed that since our entry into the European Monetary System (EMS) and the establishment of exchange controls the conduct of monetary policy has become a more important element of general economic policy. In recent times, considerable attention and discussion has been devoted to the control of one element of monetary expansion, i.e. bank lending to the private sector. On the other hand, there has been much less attention to public sector credit creation.
This paper outlines a framework for monetary policy which links both private and public sector credit creation. Recent experience of monetary expansion is examined and the role of fiscal policy in facilitating monetary stability is outlined. The conclusion is that unless Government borrowing is significantly reduced from its current level, excessive monetary creation will continue to put pressure on the external reserves and ultimately the exchange rate.
A Framework for Monetary Policy
The framework suggested here for the formulation of monetary policy revolves around a basic identity which is second nature to those familiar with U.K. financial markets. The identity is given below:
1. Money Supply Growth (M3)
equals 2. Government borrowing requirement less sales of debt to the non-bank public
+ 3. Increase in Bank Loans to Non-Government Sector
2+3
=
Domestic Credit Expansion (D.C.E.)± 4. Increase in the combined net foreign assets (liabilities) of the Central Bank and the Government
± 5. Increase in the net foreign assets (liabilities) of the
commercial banking system
- 6. Non-Deposit liabilities of the banking system
There are two major domestic sources of money supply growth, viz. that portion of government borrowing financed by monetary means (i.e. any finance other than sales of debt to the non-bank public) and bank lending to the private sector. The total of these two major sources of growth (i.e. 2+3) is normally defined as Domestic Credit Expansion (D.C.E.).
The impact of Domestic Credit Expansion on the money supply can either be augmented or offset by flows across the foreign exchanges. The sum of items 4 and 5 measures the outflows through the balance of payments deficit on current account and the net capital outflows (inflows) of the private non-bank sector. As the overall balance of payments must be zero, these flows are equal but opposite in sign to flows through the commercial banks, the Central Bank and the Government.
Item 4 measures the increase in the level of external reserves minus the increase in Government indebtedness abroad. Thus, it measures the change in the net foreign position of the public authorities. Item 5 measures the extent to which private outflows are financed by increases in the foreign liabilities of the banks rather than falls in the level of official reserves. Finally, item 6 relates mainly to the retained profits of the commercial banks.
Having outlined the mechanical relationship between the components of the money supply, how can we use this framework for formulating monetary policy? The starting point is a forecast of the demand for money based on forecasts of the growth in nominal incomes and interest rates. The object of monetary policy should then be to see that D.C.E. does not exceed this forecast growth in money demand. Assuming that the banking system will be unwilling to let its net foreign liability position rise continuously and given that non-deposit liabilities are small vis-a-vis other magnitudes, it is readily seen that domestic credit expansion in excess of the growth in money demand is reflected in an increase in the net foreign liability of the public sector (i.e. the combined position of the Central Bank and the Government). This can take the form of a fall in the level of official reserves or a rise in foreign borrowing. It has been a feature of Irish financial comment in recent times that there has been much more concern with a fall in public sector foreign asset holdings than with a rise in public sector foreign liabilities.
It is true that the country still has a high credit rating internationally and can still fund its borrowing requirement abroad without any difficulty It should, however, be realised that a good credit rating is something that can change fairly dramatically and that unless the fundamental barometers of financial prudence such as the balance of payments deficit, the level of the borrowing requirement, money supply growth etc. improve, we must expect some change in that rating in the future.
Recent Monetary Experience
Having identified D.C.E. as the appropriate target variable, it is useful to look at recent movements in this variable. Since monetary policy at present seems to concentrate on just one part of D.C.E., i.e. bank lending to the private sector, figures for the magnitude are not directly available. It is possible, however, to collect the figures from a variety of sources on an annual basis. Intra-year figures are more difficult, the main deficiency being the sales of public sector debt to the non-bank domestic public. The experience over the past number of years is summarised in Table 1.
TABLE 1: Domestic Credit Expansion (£m)
Government Sales of Borrowing Securities*
1976 506 138
1977 545 135
1978 810 187
1979** 1009 200
*To non-bank domestic public **Estimate
Small Bank Lending to Savings Non-Government Sector
53 391
102 552
65 836
30 850
D.C.E.***
706 860 1394 1629
***Government Borrowing - Sales of Securities - Small Savings+ Bank Lending= D.C.E. Source: Central Bank Quarterly Bulletin - Winter 1979
Budget 1976, 1977, 1978, 1979
It can be seen that both bank lending to the private sector and Government borrowing expanded rapidly over the period, leading to an extremely high level of Domestic Credit Expansion in the past two years. It is also evident that the ability of the Government to finance its borrowing in a non-monetary way has not grown in line with its overall borrowing requirement.
The same information is presented in a slightly different manner in Table 2.
[image:5.533.62.430.240.419.2]TABLE 2: D.C.E. 1975-1979
Government Contribution Non-Government Contribution
to D.C.E. to D.C.E.
As% of As%of
£m Previous Year's £m Previous Year's
Money Supply Money Supply
1976 315 12.9 391 16.0 1977 308 11.0 552 19.7 1978 558 17.1 836 25.7 1979* 779 18.5 850 20.3
*Estimate
Source: Central Bank Quarterly Bulletin - Winter 1979 Budget 1976,1977,1978,1979.
Total D.C.E.
As%of £m Previous Year's
Money Supply
706 28.8 860 30.7 1394 42.8 1629 38.9
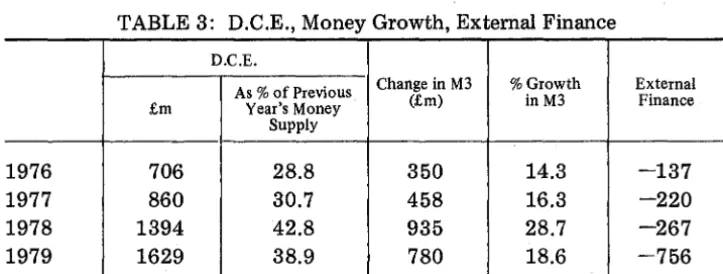
The final column shows D.C.E. as a percentage of the money stock outstanding at the end of the previous period, i.e. the contribution of domestic monetary creation to the overall growth in money supply. If the demand for money expands by less than this figure, then equilibrium is restored by a fall in the net foreign assets of the banking system and a rise in the net foreign liabilities of the Public Authorities. Columns 2 and 4 break down the overall D.C.E. figure as between the Government contribution and the private sector contribution-the Government contribution being defined as total borrowing less sales of securities to the non-bank domestic public and small savings.
Table 3 shows, in fact, the demand for money has expanded at a much more moderate pace than the D.C.E.
TABLE 3: D.C.E., Money Growth, External Finance
D.C.E.
As % of Previous Change in M3 %Growth External
£m Year's Money (£m) inM3 Finance
Supply
1976 706 28.8 350 14.3 -137 1977 860 30.7 458 16.3 -220 1978 1394 42.8 935 28.7 -267 1979 1629 38.9 780 18.6 -756
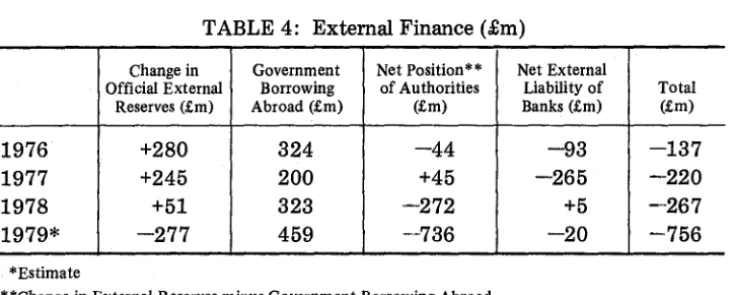
[image:6.527.100.458.33.189.2] [image:6.527.98.460.366.503.2]external finance item is made up of the increase in the net foreign liabilities of the authorities (i.e. foreign borrowing ± change in reserves) and the increase in the net foreign liabilities of the commercial banks. Table 4 gives the distribution.
TABLE 4: External Finance (£m)
Change in Government Net Position** Net External
Official External Borrowing of Authorities Liability of Total Reserves (£m) Abroad (£m) (£m) Banks (£m) (£m)
1976 +280 324 -44 -93 -137 1977 +245 200 +45 -265 -220 1978 +51 323 -272 +5 -267 1979* -277 459 --736 -20 -756
*Estimate
**Change in External Reserves minus Government Borrowing Abroad.
Column 3 shows that in the past two years the surge in Government borrowing combined with a rapid expansion of bank lending has resulted in the net foreign position of the authorities worsening by more than £1,000 million.
There seems little doubt that a combination of this trend is not consistent with the exchange rate commitment of the European Monetary System. At some stage, our ability to borrow abroad would diminish and real pressure would then emerge on the level of external reserves, forcing a devaluation of the currency.
The Appropriate Level of Public Borrowing
Corrective action requires policy measures which will reduce the growth in credit expansion (as measured by our D.C.E. variable) to a level in line with the likely growth in money demand. The current credit policy of the Central Bank will reduce the contribution of the private sector to D.C.E. well below the levels of recent years. However, public sector credit creation is still extremely high. This raises the question of the appropriate level of borrowing which is consistent with monetary stability.
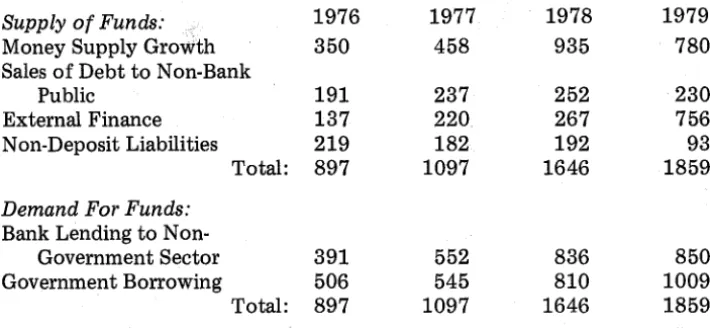
One way of approaching the question is to reorganise the money stock equation into two sides of a balance sheet and interpret one side as the supply of funds and the other as the demand for funds. This is done in Table 5, where the figures for the period of 1976-1979 are given.
[image:7.530.71.437.82.229.2]TABLE 5: Supply and Demand for Funds 1976-1979 (£m)
Supply of Funds: 1976 1977 1978 1979
Money Supply Growth 350 458 935 780 Sales of Debt to Non-Bank
Public 191 237 252 230 External Finance 137 220 267 756 Non-Deposit Liabilities 219 182 192 93 Total: 897 1097 1646 1859
Demand For Funds: Bank Lending to
Non-Government Sector 391 552 836 850 Government Borrowing 506 545 810 1009 Total: 897 1097 1646 1859
Table 6 looks at the figures for 1980 and examines the policy implica-tions of setting a target level of zero for the external finance item.
TABLE 6: Supply and Demand for Funds-· 1980 (£m)
Supply of Funds
Money Supply Growth Sales of Debt. to
non-bank public External Finance
900
300
Non-Deposit Liabilities 150
Total: 1350
Demand for Funds
Bank Lending
Govt. Borrowing
640
710
1350
On the basis of expected growth in nominal GNP in the Irish economy in 1980, the demand for money is projected to grow by 18 per cent. Given an institutional cash flow of between £250 million and £300 million, purchases of Government Securities and small savings by the non-bank public should amount to some £300 million.
[image:8.528.103.458.37.201.2] [image:8.528.97.458.266.414.2]external reserves that external finance should be a negative source of finance and allow some decline in the net foreign liability of the authorities.
Adding on £150 million for non-deposit liabilities gives a total supply of funds of £1,350 million to finance the Government borrowing requirement and bank lending to the private sector. The figure of £640 million for bank lending assumes the Central Bank guideline will be reduced from 18% per annum to 15%. The Government borrowing requirement, thus, comes out as a residual of £710 million. It should be stressed that Table 5 is not a forecast. Rather it is an illustration of the level of the borrowing requirement consistent with a total credit expansion which would leave the net foreign liability position of the authorities unchanged and which would not unduly squeeze the non-Government sector.
At present it seems unlikely that borrowing will be held down to a level of £710 million. What happens if borrowing remains at about £1,000 million in 1980? Any of the following three scenarios is possible.
Firstly, bank lending could be correspondingly reduced so that the overall level of credit creation would remain unchanged. If borrowing were raised to £1,000 million, bank lending would be reduced to £350 million or a growth rate of 8 per cent for the year. This would be a classic example of the private sector being 'crowded out' by an expansionary fiscal policy in combination with an unchanged monetary policy.
If the demand for credit significantly exceeded this 8 per cent growth, it could result in significant effects on output and demand. This is because domestic borrowers would not be prepared to augment domestic borrowing with overseas loans because of the currency risk. Current regulations prevent the covering of this risk in the forward exchange market--transactions in this market being limited to trade-related transactions. The reasons for this particular regulation are not obvious as the freeing of this market would substantially reduce the deflationary impact of restrictive monetary policy.
Secondly, the authorities could try to finance the increased borrowing by increased sales of debt to the non-bank public. This, however, would be a particularly difficult task as the major operators in the gilt-edge market are the pension funds and life assurance companies in conjunction with the building societies. The cash flow of these institutions is, to a large extent, fixed in the short-run due to the contractual nature of the majority of their inflows. Therefore, sales of debt on the scale required to finance the extra borrowing would be unlikely without dramatic movements in yield levels.
foreign borrowing, ultimately putting pressure on our ability to maintain a stable exchange rate.
It should be pointed out that the monetary 'model' underlying the above calculations is recursive in nature. The level of nominal GNP and interest rates are wholly determined outside the monetary sector and feed into a demand for money function to determine the level of the money stock outstanding. This 'model' was particularly appropriate under our previous fixed exchange rate relationship with sterling. However, under our present regime where the exchange rate can vary, in short-run, by moving up and down the EMS bands and in the medium term by central parity changes within the system, it would seem more appropriate that interest rates, at least, would be endogenous to the monetary sector. This does not invalidate the underlying approach of this paper. In technical terms, all that would be required is a simultaneous solution of an economy-wide model incorporating a monetary sector rather than the recursive solution method outlined above.
Conclusion
This paper has set out to examine broad trends in monetary policy in recent years. It has concentrated on a measure of monetary expansion (D.C.E.) which takes account both of private and public sector credit creation. The figures show an excessive growth in credit creation which has become particularly pronounced in the past two years. This has resulted in a large increase in the combined net foreign liability of the Government and the Central Bank.
A continued deterioration in this net foreign position is not consistent with a stable exchange rate within the EMS. If exchange rate stability is to be maintained there is a need for policy actions which will reduce overall credit expansion in line with the growth in the demand for money. The Central Bank has already taken action which will ensure that one component of credit creation, viz. bank lending to the non-Government sector will grow at a more moderate pace than has been the case in recent years. However, it is equally important to contain the level of monetary financing of the Government borrowing requirement. Unless this borrowing is reduced significantly, excessive monetary growth seems likely to continue if the private sector is not to be totally 'squeezed out: and this would give rise to doubts about our ability to maintain our position within the EMS.