Title: fMRI activation during response inhibition and error processing: the role of the DAT1 gene in typically developing adolescents and those diagnosed with ADHD.
Authors: Wouter Braet, Katherine A. Johnson, Claire T. Tobin, Ruth Acheson, Caroline McDonnell, Ziarah Hawi, Edwina Barry, Aisling Mulligan, Michael Gill, Mark A. Bellgrove, Ian H. Robertson, Hugh Garavan
PII: S0028-3932(11)00003-0
DOI: doi:10.1016/j.neuropsychologia.2011.01.001 Reference: NSY 3951
To appear in: Neuropsychologia
Received date: 26-10-2009 Revised date: 3-12-2010 Accepted date: 1-1-2011
Please cite this article as: Braet, W., Johnson, K. A., Tobin, C. T., Acheson, R., McDonnell, C., Hawi, Z., Barry, E., Mulligan, A., Gill, M., Bellgrove, M. A., Robertson, I. H., & Garavan, H., fMRI activation during response inhibition and error processing: the role of the DAT1 gene in typically developing adolescents and those diagnosed with ADHD.,Neuropsychologia(2008), doi:10.1016/j.neuropsychologia.2011.01.001
Accepted Manuscript
The DAT1 10R allele was associated with more effortful response inhibition
However, this group showed a reduced response to errors, suggesting less learning
The ADHD group displayed underactivation in parietal, medial and frontal regions
Accepted Manuscript
12 3 4 5 6 7 8 9 10 11 12 13 14 15 16 17 18 19 20 21 22 23 24 25 26 27 28 29 30 31 32 33 34 35 36 37 38 39 40 41 42 43 44 45 46 47 48 49 50 51 52 53 54 55 56 57 58 59 60 61 62
fMRI activation during response inhibition and error processing: the role of the
DAT1 gene in typically developing adolescents and those diagnosed with ADHD.
Wouter Braet1,2,*, Katherine A. Johnson1, Claire T. Tobin1, Ruth Acheson1, Caroline McDonnell3, Ziarah Hawi3, Edwina Barry3, Aisling Mulligan3, Michael Gill3, Mark A.
Bellgrove4, Ian H. Robertson1, Hugh Garavan1
¹School of Psychology and Trinity College Institute of Neuroscience, Trinity College Dublin, Dublin 2, Ireland; 2Laboratory of Experimental Psychology, University of Leuven, Belgium; 3 School of Medicine,
Trinity College Dublin; 4 The University of Queensland, School of Psychology and Queensland Brain Institute, Australia.
*corresponding author: [email protected]
Running title: DAT1 effects on response inhibition in ADHD
Corresponding author:
Wouter Braet
Laboratory of Experimental Psychology University of Leuven
Tiensestraat 102 B 3000 Leuven Belgium
Tel: +32 (0)16 32 59 57 Fax: +32 (0)16 32 60 99
Accepted Manuscript
45 6 7 8 9 10 11 12 13 14 15 16 17 18 19 20 21 22 23 24 25 26 27 28 29 30 31 32 33 34 35 36 37 38 39 40 41 42 43 44 45 46 47 48 49 50 51 52 53 54 55 56 57 58 59 60 61 62
Abstract
The DAT1 gene codes for the dopamine transporter, which clears dopamine from the
synaptic cleft, and a variant of this gene has previously been associated with
compromised response inhibition in both healthy and clinical populations. This variant
has also been associated with ADHD, a disorder that is characterised by disturbed
dopamine function as well as problems with response inhibition. In the present study we
used fMRI to investigate the role of dopaminergic genetic variation on executive
functioning by comparing how activation associated with successful and unsuccessful
inhibitions differs based on DAT1-genotype and ADHD-diagnosis in adolescents
performing a go/nogo task. The results identify regional specificity concerning which
functional differences can be attributed to the possession of the high risk DAT1 genotype,
the clinical condition or an interaction between the two. During response inhibition,
individuals with two copies of the 10-repeat allele showed increased activation in frontal,
medial, and parietal regions, which may indicate that inhibition is more effortful for this
group. Conversely, this group displayed a reduced error response in the parahippocampal
gyrus, suggestive of reduced learning from errors. There were also a number of frontal,
parietal, medial and occipital regions, where the relationship between genotype and
fMRI-activation differed between the ADHD group and typically developing adolescents.
Finally, the ADHD group displayed decreased activation in parietal and (pre)frontal
regions during response inhibition, and in frontal and medial brain regions on error trials.
Accepted Manuscript
45 6 7 8 9 10 11 12 13 14 15 16 17 18 19 20 21 22 23 24 25 26 27 28 29 30 31 32 33 34 35 36 37 38 39 40 41 42 43 44 45 46 47 48 49 50 51 52 53 54 55 56 57 58 59 60 61 62
Introduction
Controlling and inhibiting actions are important cognitive abilities that allow us to
function successfully in a changing and complex environment. Individual differences in
executive functioning such as response inhibition and error monitoring have been related
to genetic variation (Goldberg & Weinberger, 2004), for example, by studying unaffected
family members of clinical groups with deficits in response inhibition (Slaats-Willemse
et al., 2003) and by comparing groups who differ in genotype. Earlier studies suggest an
important role for the dopamine system in response inhibition: typically developing
children homozygous for the 10-repeat allele of DAT1 perform less well on a test of
response inhibition (Cornish et al., 2005), though this effect can be modulated by
genotypic variation on other dopaminergic genes such as DRD4 (Congdon, Lesch &
Canli, 2007). In this study we investigate the role of dopaminergic functioning in
response inhibition and error-monitoring, by comparing the effects of variation in
DAT1-genotype in typically developing adolescents and in adolescents diagnosed with ADHD.
Attention Deficit/Hyperactivity Disorder (ADHD) is a childhood disorder
characterised by symptoms of inattention, hyperactivity and impulsivity (DSM-IV). The
disorder is relatively common, with between 3-5% of school-age children affected
(Buitelaar, 2002). ADHD symptoms persist into adulthood in about 65% of cases
(Faraone, Biederman, & Mick, 2006) and individuals with ADHD often show
impairments of executive function, including the ability to control and inhibit behaviour
(Nigg, 2005).
ADHD is thought to have a strong genetic component, with additive effects of
Accepted Manuscript
45 6 7 8 9 10 11 12 13 14 15 16 17 18 19 20 21 22 23 24 25 26 27 28 29 30 31 32 33 34 35 36 37 38 39 40 41 42 43 44 45 46 47 48 49 50 51 52 53 54 55 56 57 58 59 60 61 62
(Albayrack, Friedel, Schimmelmann, Hinney & Hebebrand, 2008). More than a decade of
molecular genetics research into ADHD has confirmed associations of small effect size
for a number of candidate genes, including those for the dopamine transporter (DAT1)
(Mick & Faraone, 2008). Since individual genetic influences on clinical phenotypes, such
as ADHD, are likely to be small and potentially heterogeneous, recent studies have
sought to link DNA variation in candidate genes to objective constructs such as a specific
psychological process or markers of brain function that are hypothesised to lie
intermediate between gene and disorder.
Within the cognitive genetics literature of ADHD, multiple lines of evidence
suggest that executive function measures, such as response inhibition, might index
susceptibility to ADHD. First, recent twin studies have demonstrated a remarkably strong
genetic contribution to executive functions, including response inhibition (Friedman et
al., 2008). Second, familial risk profiles for response inhibition deficits in ADHD have
also been established. Response inhibition deficits are more pronounced in ADHD
probands of affected as compared to non-affected parents (Crosbie, Pérusse, Barr &
Schachar, 2008). Non-affected siblings of children with ADHD have response inhibition
deficits that fall intermediate between typically developing children and children with
ADHD (Slaats-Willemse, Swaab-Barneveld, de Sonneville, van der Meulen & Buitelaar,
2003). Neuroimaging studies of response inhibition have shown similar hypo-activation
of prefrontal areas in ADHD probands and their unaffected siblings, compared with
typically developing children (Durston, Mulder, Casey, Ziermans, & van Engeland,
2006). Finally, a number of molecular genetic studies in both children with ADHD and
Accepted Manuscript
45 6 7 8 9 10 11 12 13 14 15 16 17 18 19 20 21 22 23 24 25 26 27 28 29 30 31 32 33 34 35 36 37 38 39 40 41 42 43 44 45 46 47 48 49 50 51 52 53 54 55 56 57 58 59 60 61 62
and DAT1 and measures of response inhibition (Cornish et al., 2005; Johnson et al.,
2008; though also see Kebir, Tabbane, Sengupta, & Joober, 2009; Rommelse et al.,
2008). More recently, Durston and colleagues (2008) found that DNA variation in DAT1
influenced brain activation during response inhibition in the striatum and cerebellum.
In the present study, we used functional magnetic resonance imaging (fMRI) to
investigate the effects of the DAT1 40 base pair (bp) variable number of tandem repeat
(VNTR) polymorphism on the neural networks underlying response inhibition, in
adolescents diagnosed with ADHD as well as typically developing adolescents. The
dopamine transporter gene (DAT1) codes for the production of the dopamine transporter
(DAT) which clears dopamine from the synaptic cleft back into the neuron and is the
primary site of action for psychostimulants. Allelic variation within DAT1 has been
shown to affect the level of DAT expression, with increased expression associated with
the 10R-allele (Mill, Asherson, Browes, D‟Souza, & Craig, 2002; though also see Van
Dyck et al., 2005). Thus, it is plausible that tonic levels of available dopamine are lower
in individuals homozygous for the 10R-allele, compared to other genotypes, and this may
affect cognitive control processes that rely on dopamine, such as response inhibition and
error-related processing. Individuals diagnosed with ADHD often show impairments in
error-monitoring (van Meel, Heslenfeld, Oosterlaan, & Sergeant, 2007) and/or response
inhibition (Vaidya et al., 1998).
Comparing the relative contribution of genotype and diagnosis allows us to
distinguish which brain differences in activation are affected by variation in DAT1
genotype, and which are likely caused by other (genetic or environmental) factors that
Accepted Manuscript
45 6 7 8 9 10 11 12 13 14 15 16 17 18 19 20 21 22 23 24 25 26 27 28 29 30 31 32 33 34 35 36 37 38 39 40 41 42 43 44 45 46 47 48 49 50 51 52 53 54 55 56 57 58 59 60 61 62
effects of diagnosis suggests that DAT1 genotype explains most of the variation in
activation in this region, with little additional contributions from other (genetic or
environmental) factors associated with ADHD. Similarly, regional brain functioning for
which ADHD-related impairment is mediated by genotype may be expected to show
genotype by diagnosis interactions while ADHD-related impairments not mediated by
genotype might be expected to show just main effects of diagnosis. In total, this approach
enables us to determine the contribution that the DAT1 gene makes to specific cognitive
and specific regional functional impairments that might be observed in those with
ADHD.
MATERIAL AND METHODS
Participants
A total of 58 right-handed adolescents were included in this study: 20 diagnosed
with ADHD (mean age: 14.1, SD: 2.1; 3 female) and 38 typically developing adolescents
(mean age: 13.26, SD: 1.98; 7 female); the proportion of genders did not differ between
the two groups (p=.476, Fisher‟s exact test), nor did their ages (t(56)=1.5, p=.14) (also
see Table 1, left panel). The participants with ADHD were referred by consultant
psychiatrists in Ireland. All participants with ADHD met DSM-IV criteria for ADHD, as
determined through semi-structured interviews by psychiatrists using the parent form of
the Child and Adolescent Psychiatric Assessment (CAPA) (Angold et al., 1995) or the
Parental Account of Children's Symptoms (PACS) (Taylor, 1986). Control participants
Accepted Manuscript
45 6 7 8 9 10 11 12 13 14 15 16 17 18 19 20 21 22 23 24 25 26 27 28 29 30 31 32 33 34 35 36 37 38 39 40 41 42 43 44 45 46 47 48 49 50 51 52 53 54 55 56 57 58 59 60 61 62
for ADHD were asked to discontinue their medication for at least 24 hours1 prior to the
scan session.
Exclusion criteria included known neurological conditions or pervasive
developmental disorders, serious head injuries and below average intelligence (below 70
on the WISC (Wechsler‟s Intelligence Scale for Children)), and MRI-exclusion criteria
(metal anywhere in the body (excluding the mouth), pregnancy, claustrophobia). In
addition, the parents of all participants completed the Conners‟ ADHD Rating
Scale-Revised: Long Version (Connors, 1996). Control adolescents had Conners‟ Global Index
H-scores ≤60, and adolescents with ADHD had scores ≥65. Participants diagnosed with
ADHD had lower scores on the WISC, as well as on both spelling and reading subtests
of the WRAT (Wide Range Achievement Test), and scored higher on the Conner‟s scale
(all F≥11.6, p≤.001). There were no significant effects on these variables of genotype (all
F≤.67, p≥.42), nor were there significant interactions between genotype and diagnosis (all
F≤1.2, p≥.28). We also present analyses on a subsample of the participants, who were
matched for their scores on the WISC and WRAT (all F<2.8, p≥.105), and which
included only boys (see Table 1, right panel).
After the study was described, participant and parental consent was provided. The
study was approved by the local ethics committee, and was carried out in accordance
with the Declaration of Helsinki (1964; 2000).
The data from some of the controls were previously reported in a developmental
study of inhibitory control (Braet et al., 2009).
1
Accepted Manuscript
45 6 7 8 9 10 11 12 13 14 15 16 17 18 19 20 21 22 23 24 25 26 27 28 29 30 31 32 33 34 35 36 37 38 39 40 41 42 43 44 45 46 47 48 49 50 51 52 53 54 55 56 57 58 59 60 61 62
Table_1_(a+b)
Genotyping
DNA was extracted from blood, or from saliva using Oragene DNA
self-collections kits (DNAgenotek, Canada). Polymerase chain reaction (PCR) amplification
and genotyping of the variable number of tandem repeats (VNTR) of the 3‟ untranslated
region (UTR) of the DAT1 gene were conducted as described by Cook and colleagues
(1995). All genotypes were in Hardy Weinberg Equilibrium. Children were grouped
according to possession of the 10 repeat VNTR: the “high risk” (HR) group possessed
two copies and the “low risk” (LR) group possessed one or no copies of the 10 repeat
allele [ADHD: 9 HR, 11 LR and Control: 18 HR and 20 LR]. There was no significant
association between allele possession for the 3‟ UTR VNTR DAT1 and clinical diagnosis
[χ2(1)=0.03, p=0.864]. The categorisation of the genotypes as either HR or LR was done
similar to prior studies (see e.g. Bellgrove, Hawi, Kirley, Gill, & Robertson, 2005), based
on statistical grounds.
Sustained attention to response task (SART)
Participants performed the random SART, a go/no-go test that measures both
inhibitory function (no-go trials) and sustained attention (go trials) (see O‟Connell et al.,
Accepted Manuscript
45 6 7 8 9 10 11 12 13 14 15 16 17 18 19 20 21 22 23 24 25 26 27 28 29 30 31 32 33 34 35 36 37 38 39 40 41 42 43 44 45 46 47 48 49 50 51 52 53 54 55 56 57 58 59 60 61 62
order, and participants are asked to make a buttonpress response to each number, except
„3‟. Each trial consisted of the (go or no-go) target (313 ms), after which a mask was
presented (563 ms, which consisted of 125ms mask, 63ms response cue, and a further
375ms mask), followed by a fixation cross (563 ms); inter-stimulus interval (ISI) was
1439 ms. (see Figure 1). The task was presented using E-prime (Psychology Software
Tools, Pittsburgh, USA), in a single block of 450 trials (consisting of 400 go trials and 50
no-go-trials), which included two 30s breaks after 150 and 300 trials.
We chose this design to be optimised to detect activation related to both
successful and unsuccessful nogo-trials (which are assumed to reflect response inhibition
and error-monitoring, respectively). To ensure a sufficient number of nogo-trials, while
keeping their proportion low (compared to the total number of trials, to encourage a
prepotent tendency to respond), the duration of individual trials was kept relatively short.
This design allows for reliable estimation of response maps for response inhibition and
error-monitoring, but is not ideal to investigate activation relating to tonic processes such
as sustained attention or motor processes given the fast pace of go-trials (faster than the
scan acquisition time) which means that hemodynamic response curves cannot be fitted
to go-events. Consequently, the baseline for assessing successful and unsuccessful
nogo-related activation is comprised of these tonic attentional and motoric processes. An
alternative approach would be to include a number of fixation-only trials which could
then serve as a low-level baseline against which tonic attentional and motor activity could
be assessed. Several factors motivated the choice of our design. First, our main interest
was response inhibition/error detection rather than sustained attention, and for this we
Accepted Manuscript
45 6 7 8 9 10 11 12 13 14 15 16 17 18 19 20 21 22 23 24 25 26 27 28 29 30 31 32 33 34 35 36 37 38 39 40 41 42 43 44 45 46 47 48 49 50 51 52 53 54 55 56 57 58 59 60 61 62
research question to assess go-related activation: Previous studies have shown that go-
and nogo-trials lead to distinct maps with minimal overlap (Garavan, Ross & Stein,
1999), and their differential time courses as revealed by ERP studies (e.g. O‟Connell et
al., 2009) further confirm that both trial types elicit independent cognitive processes.
Second, the present design ensures that every trial is used in the analysis (either as
baseline, or as an effect of interest), which reduces the time that participants are in the
scanner which, in turn, makes it easier for participants (particularly the ADHD group) to
keep movement to a minimum. Third, response inhibition is commonly investigated by
comparing activation during nogo-trials to a baseline of go-trials (Braet et al., 2009;
Durston et al., 2008; Ramautar, Slagter, Kok & Ridderinkhof, 2006) with one advantage
being that one employs an active baseline condition with similar visual stimuli to the
nogo trials.
Figure_1
MRI data acquisition
All scanning was conducted on a Philips Intera Achieva 3.0 Tesla MR system.
Each scanning sequence began with a reference scan to resolve sensitivity variations. 180
high-resolution T1-weighted anatomic MPRAGE axial images (FOV 230 mm, thickness
0.9 mm, voxel size 0.9 × 0.9 × 0.9) were then acquired (total duration 325 s), to allow
subsequent activation localization and spatial normalization.
Functional data were collected using a T2*-weighted echo-planar imaging (EPI)
Accepted Manuscript
45 6 7 8 9 10 11 12 13 14 15 16 17 18 19 20 21 22 23 24 25 26 27 28 29 30 31 32 33 34 35 36 37 38 39 40 41 42 43 44 45 46 47 48 49 50 51 52 53 54 55 56 57 58 59 60 61 62
entire brain (TE = 35 ms, TR = 2000 ms, FOV 224 mm, 64 × 64 mm matrix size in
Fourier space). The functional scans had a total duration of 730 s, and were collected in a
single sequence.
fMRI analysis
The data were analysed under the general linear model using AFNI
(http://afni.nimh.gov) (Cox, 1996). Images were corrected for motion (using a
least-squares alignment allowing translations and rotations). These motion parameters were
also included as variables-of-no-interest in the first-level fMRI analyses; there were no
reliable differences in any of the 6 motion parameters between participants diagnosed
with ADHD and controls (all t≤1.5, p≤.139) (no participants were excluded due to
excessive motion), and activation outside the brain was removed. MR signal drift was
estimated by fitting a 5th-order polynomial function. Separate impulse response functions
(IRFs) were estimated for successful inhibitions and commission errors using
deconvolution techniques (the time course of the two 30s breaks was also included as a
variable-of-no-interest). Gamma-variate functions were fit, voxelwise, to these IRFs
using a non-linear regression programme. A percentage signal-change score (%SC) was
calculated by dividing the area under the curve of these functions by the area under the
baseline which, in this case, reflects tonic ongoing processes involved in Go trial
responses2. Individual %SC maps were then spatially blurred using a 3mm rms isotropic
2
Accepted Manuscript
45 6 7 8 9 10 11 12 13 14 15 16 17 18 19 20 21 22 23 24 25 26 27 28 29 30 31 32 33 34 35 36 37 38 39 40 41 42 43 44 45 46 47 48 49 50 51 52 53 54 55 56 57 58 59 60 61 62
Gaussian kernel, and transformed into MNI space using the MNI (Montréal Neurological
Institute) 152-brain template.
For both commission errors and successful inhibitions, activation maps for each
group of interest were then determined using one-sample t-tests against 0 (i.e. against the
null hypothesis of no change in activation compared with the baseline). Significant
voxels passed a voxelwise statistical threshold (ADHD HR: t=5.04; ADHD LR: t=4.78;
control HR: t=3.97; control LR: t=3.88, p≤.001; these t-values varied as the sample sizes
differed between groups), and were required to be part of a cluster of significant voxels
with a minimum volume of 135 μl. This minimum cluster-size was determined using
Monte-Carlo simulations (1000 iterations), resulting in a 0.05 (corrected) probability of a
cluster surviving due to chance. Separate maps were generated for the four groups, and
these were subsequently combined into separate maps (containing every voxel that was
part of a significant cluster in any of the four groups) for successful inhibition and
commission errors. The clusters of activation in these resulting maps (one map for
successful inhibitions and one for commission errors) were then used for
functionally-defined region of interest (ROI) analyses wherein we extracted mean activation values for
each region for every participant (these same ROIs were used for the analyses on the
matched sample). These data were analysed as two-way ANOVAs with diagnosis and
genotype as grouping factors.
This method was chosen (rather than constructing a single map for all
participants), as it ensures that every region which was activated by at least one of the 4
groups is included in the ROI-analyses, rather than just regions which were commonly
Accepted Manuscript
45 6 7 8 9 10 11 12 13 14 15 16 17 18 19 20 21 22 23 24 25 26 27 28 29 30 31 32 33 34 35 36 37 38 39 40 41 42 43 44 45 46 47 48 49 50 51 52 53 54 55 56 57 58 59 60 61 62
activated (and which would otherwise likely be determined primarily by the (larger)
control group). This method tends to be more sensitive to identify group-differences (and
particularly, interaction-effects between multiple grouping-factors), as activation at the
ROI-level is more reliable than at the level of individual voxels (due to the reduction of
noise by averaging over a larger cortical area). While there are differences in the number
of events (e.g. ommission errors) between the adolescents diagnosed with ADHD and the
controls, we have previously shown that performance-matching (in terms of the number
of omission and commission errors as well as response variability) between two groups
has only limited effects on the results of the ROI-analysis (Braet et al., 2009). This makes
it unlikely that the effects reported here are directly related to differences between the
groups in the number of errors they make, or even differences in performance on go-trials
(which were used as the baseline).
Analysis of behavioural data
Errors of commission (responses made on the no-go digit 3, which indicate failure
of inhibitory processes) and omission (non-responses on the go-trials, believed to reflect
temporary lapses in attention) and the mean and standard deviation (SD) of the response
times (RTs) on the go-trials were calculated for each participant. Differences between the
groups (as well as interactions between genotype and diagnosis) were assessed using
univariate analyses under the general linear model, with diagnosis (ADHD or control)
Accepted Manuscript
45 6 7 8 9 10 11 12 13 14 15 16 17 18 19 20 21 22 23 24 25 26 27 28 29 30 31 32 33 34 35 36 37 38 39 40 41 42 43 44 45 46 47 48 49 50 51 52 53 54 55 56 57 58 59 60 61 62
RESULTS
Behavioural performance
Adolescents diagnosed with ADHD made significantly more omission errors
(F(1,54)=18.48, p<.001), and were significantly more variable in RT (higher SD) on
go-trials (F(1,54)=6.46, p=.014) than typically developing adolescents, as well as displaying
a trend for a higher number of commission errors (F(1,54)=3.36, p=.072). Participants
diagnosed with ADHD and typically developing adolescents had similar RTs for both go
trials (485s and 512s, respectively, p>.05) and commission errors (425s and 426s,
respectively, p>.05). There were no interactions between diagnosis and genotype on any
of the behavioural measures, nor were there any main effects of genotype.
The matched sample showed the same pattern of results: significantly more
omission errors (F(1,32)=16, p<.001) and higher variability on go-trial RTs (F(1,32)=4.8,
p=.035) for adolescents diagnosed with ADHD compared to typically developing
adolescents, but there were no other significant main effects or interactions (all F≤2.6,
p≥.117).
Participants successfully responded to the majority of go trials (93% for
adolescents diagnosed with ADHD, and 98% for the control group), suggesting that both
groups had a prepotent tendency to respond on each trial. Response inhibition during
Accepted Manuscript
45 6 7 8 9 10 11 12 13 14 15 16 17 18 19 20 21 22 23 24 25 26 27 28 29 30 31 32 33 34 35 36 37 38 39 40 41 42 43 44 45 46 47 48 49 50 51 52 53 54 55 56 57 58 59 60 61 62
relatively high error rates for nogo trials (39% errors for participants from the ADHD
group, and 30% for the control group) (see Figure 2).
Figure_2
fMRI-analysis: successful inhibitions
Table_2
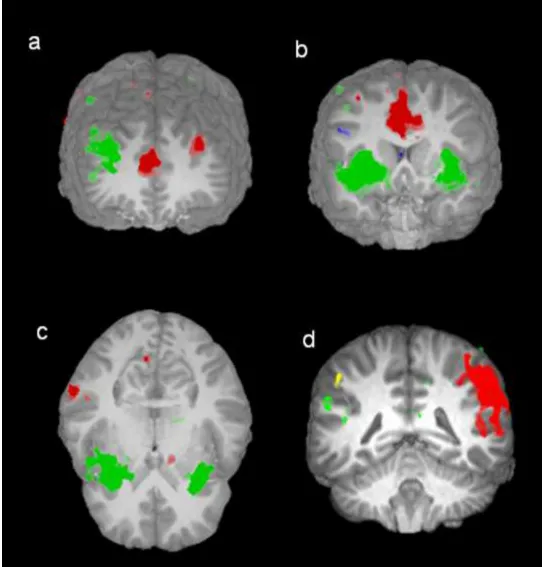
Table 2 lists the areas that showed significant activity when participants
successfully inhibited their response on no-go trials (also see Figure 3).
Adolescents with ADHD showed reduced activation, compared with controls, in
the right cuneus and in the left inferior parietal cortex.
There were also main effects of genotype, with greater activation for HR
compared with LR in the following regions: the right middle frontal gyrus, the ACC,
bilateral caudate, the right middle temporal gyrus and the right middle occipital gyrus.
One region, the left inferior temporal gyrus showed reduced activation for HR
participants.
There were also eight regions where there was an interaction between diagnosis
and genotype: the left superior frontal gyrus, the ACC, the left cingulate gyrus, the left
lentiform nucleus, the right supramarginal gyrus, the right precuneus, the right cuneus,
and the right middle occipital gyrus. In all these regions, there was a larger effect of
Accepted Manuscript
45 6 7 8 9 10 11 12 13 14 15 16 17 18 19 20 21 22 23 24 25 26 27 28 29 30 31 32 33 34 35 36 37 38 39 40 41 42 43 44 45 46 47 48 49 50 51 52 53 54 55 56 57 58 59 60 61 62
The matched sample showed the same pattern of results, though the difference in
a number of ROIs was no longer significant: there were no longer main effects of
diagnosis in the right cuneus and in the left inferior parietal cortex; the main effect of
genotype was no longer reliable in the left inferior temporal gyrus, though the other 5
clusters still showed increased activation for the HR group; finally, the right cuneus and
left cingulate gyrus no longer showed a reliable interaction between diagnosis and
genotype.
Figure_3
Figure_4
fMRI analysis: commission errors
Table_3
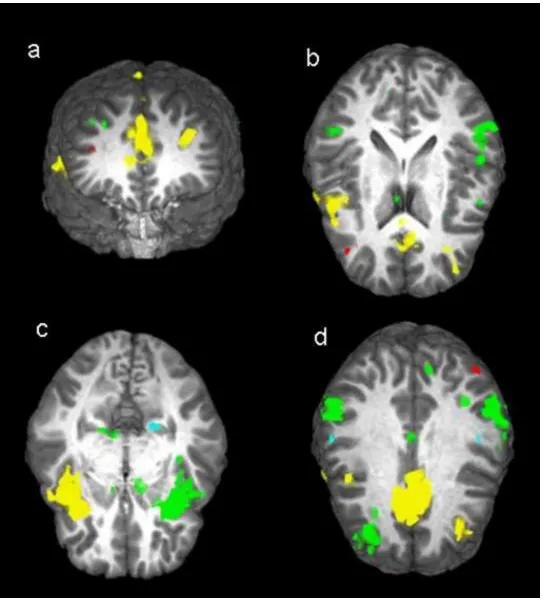
Table 3 lists the areas that showed significant activity when participants made a
commission error (responded on no-go trials) (also see Figure 5).
Adolescents diagnosed with ADHD showed reduced activation in three regions:
Accepted Manuscript
45 6 7 8 9 10 11 12 13 14 15 16 17 18 19 20 21 22 23 24 25 26 27 28 29 30 31 32 33 34 35 36 37 38 39 40 41 42 43 44 45 46 47 48 49 50 51 52 53 54 55 56 57 58 59 60 61 62
Participants with the HR-genotype showed reduced activation compared with
those with the LR-genotype in the following regions: the left parahippocampal gyrus, and
the left and right postcentral gyri.
Two regions showed an interaction between diagnosis and genotype: the right
middle frontal gyrus and the left angular gyrus (see Figure 6). In both regions, activation
levels were similar for the HR adolescents with ADHD and LR controls (both t≤.63,
p≥.53) with both groups showing activations in the right middle frontal gyrus and
deactivations in the left angular gyrus. The other two groups (LR ADHD and HR
controls) showed little activation in either region (all t≤1.2, p≥.24).
The matched sample showed the same pattern of results, though the differences in
a number of ROIs were no longer significant: the ACC no longer showed a reliable effect
of diagnosis; the difference between HR and LR was no longer significant in the right
postcentral gyrus; the left angular gyrus no longer showed a significant interaction
between diagnosis and genotype.
Figure_5
Accepted Manuscript
45 6 7 8 9 10 11 12 13 14 15 16 17 18 19 20 21 22 23 24 25 26 27 28 29 30 31 32 33 34 35 36 37 38 39 40 41 42 43 44 45 46 47 48 49 50 51 52 53 54 55 56 57 58 59 60 61 62
Discussion
Behavioural data
In line with findings from other studies, we observed significantly more omission
errors made by adolescents with ADHD compared with typically developing adolescents,
indicative of impaired sustained attention (Marchetta, Hurks, De Sonneville,
Krabbendam, & Jolles, 2007) as well as increased response variability (Castellanos et al.,
2005; Johnson et al., 2007). While the results were less clear in terms of response
inhibition, there was also a trend for a higher number of commission errors, suggestive of
impaired response inhibition for adolescents with ADHD, compared with typically
developing adolescents. Impaired response inhibition has been proposed as a core deficit
in ADHD (Wodka et al., 2007; but see e.g. Banaschewski et al., 2004 for an opposing
view) as well as a potential endophenotype for ADHD (Aron & Poldrack, 2005).
No effects of DAT1 genotype on any of the behavioural performance measures
were found, despite previous studies showing effects of DAT1 genotype on both response
inhibition (Cornish et al, 2005) and response variability (Bellgrove et al., 2005) (though
also see Kebir et al., 2009; Rommelse et al., 2008). Given the small effect size associated
with the DAT1 gene, our study may simply lack the statistical power to replicate these
effects (the HR-group in our sample did make more commission and omission errors, had
higher response variability and slower RTs, but none of these differences were
Accepted Manuscript
45 6 7 8 9 10 11 12 13 14 15 16 17 18 19 20 21 22 23 24 25 26 27 28 29 30 31 32 33 34 35 36 37 38 39 40 41 42 43 44 45 46 47 48 49 50 51 52 53 54 55 56 57 58 59 60 61 62
Genetic influence on functional activation patterns
In contrast to the behavioural effects, the neuroimaging data provided a more
sensitive measure of the downstream effects of genetic variation on cognition (also see
Greene, Braet, Johnson, & Bellgrove, 2008), insofar as they did reveal effects of
genotype in the absence of behavioural effects (e.g. Durston et al., 2008; also see Bédard
et al., 2009). During successful inhibitions, there was increased activation for the
HR-genotype in the right middle frontal gyrus, the ACC and caudate, as well as the right
middle temporal and middle occipital gyri, while there was reduced activation in the left
inferior temporal gyrus. The right prefrontal cortex, as well as medial brain regions
including the ACC and caudate are often implicated in response inhibition (Fassbender et
al., 2004), and increased activation in these regions may imply that response inhibition is
more effortful or less efficient for the HR-group.
During commission errors, however, the HR-group displayed reduced activation
in the left parahippocampal gyrus, as well as in both the left and right postcentral gyri.
The (para)hippocampal region has been associated with the regulation of
arousal-mechanisms (Gray & McNaughton, 2000), and error-related activation in this region has
been associated with subsequent improvements in performance in a task in which one
needed to learn from one‟s errors (Hester, Barre, Murphy, Silk & Mattingley, 2008).
Consequently, activation of this region during commission errors may reflect an
arousal-mediated response to error-detection required to engage additional top-down control
processes and prevent or reduce further errors. Given the role of dopamine in
Accepted Manuscript
45 6 7 8 9 10 11 12 13 14 15 16 17 18 19 20 21 22 23 24 25 26 27 28 29 30 31 32 33 34 35 36 37 38 39 40 41 42 43 44 45 46 47 48 49 50 51 52 53 54 55 56 57 58 59 60 61 62
due to the lower tonic levels of dopamine in the HR group, caused by increased
expression of the transporter associated with the 10-repeat allele.
Interaction of genotype and diagnosis status on functional activation patterns
There were a number of regions where genotype interacted with diagnosis. During
successful inhibitions, such interactions were observed in frontal (the left superior frontal
gyrus), medial and subcortical (the ACC, the left cingulate gyrus, and the left caudate),
and parietal regions (the right supramarginal gyrus, the right precuneus, and the right
cuneus), as well as in the right middle occipital gyrus. For all these regions we observed a
similar pattern: DAT1 genotype accounted for significant heterogeneity in
neurophysiological networks for response inhibition in children with ADHD (where
higher activation was observed in the HR group compared to LR) but not in controls
(where there were no differences in activation between the two genotypes). These data
demonstrate that the gene had greater penetrance at the level of brain activation
associated with response inhibition in the adolescents with ADHD (suggestive of more
effortful/ less efficient inhibition) but not in the typically developing adolescents. These
data further suggest that physiological heterogeneity in response inhibition networks in
the ADHD group might be predicted by variation in the DAT1. This may indicate that
the effect that DAT1 genetic variation has on the response inhibition endophenotype in
those with ADHD is not “self-contained” insofar as the same effect is not observed in the
control participants. Instead, other genetic or enviromental influences particular to the
ADHD group must combine with DAT1 status to produce the observed brain activation
Accepted Manuscript
45 6 7 8 9 10 11 12 13 14 15 16 17 18 19 20 21 22 23 24 25 26 27 28 29 30 31 32 33 34 35 36 37 38 39 40 41 42 43 44 45 46 47 48 49 50 51 52 53 54 55 56 57 58 59 60 61 62
activation associated with commission errors, in the right middle frontal gyrus and the
left angular gyrus, though here the pattern was different, with similar engagement of both
regions for the LR control and the HR ADHD groups, while neither of the other groups
showed significant activation in these regions. Although the dopaminergic mechanisms
underlying these effects are unclear, this type of result indicates that dopaminergic
variation in healthy controls can produce some endophenotypic effects that are similar to
those with ADHD. This idea is consistent with the notion that ADHD is characterised by
a multifactorial polygenetic etiology (see Gizer, Ficks & Waldman, 2009), where the
effects of a large number of genes (on e.g. dopaminergic function) combine to form a
continuum of phenotypic variation in e.g. response inhibition.
It has been argued that the brain regions that show interactions between diagnosis
and genotype may contribute knowledge to aid development of new treatments for
ADHD, as a surrogate endpoint in individualized treatments targeting genotype/fMRI
activation profiles (Durston et al., 2008). The exact relationship between neurotransmitter
levels and changes in fMRI activation however is still unknown, and different studies
have often found contradictory effects. For the DAT1 gene, both the 10R and 9R alleles
have been associated with increased expression of the transporter (Mill et al., 2002 vs.
Van Dyck et al., 2005) and with deficits in sustained attention (Bellgrove et al., 2005 vs.
Kim, Kim & Cho, 2006). In a prior study by Durston and colleagues (2008), which also
investigated the interaction of ADHD diagnosis and DAT1 genotype using a similar
behavioural paradigm, increased activation was observed during successful inhibitions in
the vermis of the cerebellum for the 10R compared with the 9R allele. Although we also
Accepted Manuscript
45 6 7 8 9 10 11 12 13 14 15 16 17 18 19 20 21 22 23 24 25 26 27 28 29 30 31 32 33 34 35 36 37 38 39 40 41 42 43 44 45 46 47 48 49 50 51 52 53 54 55 56 57 58 59 60 61 62
difference was not significant in our sample. Durston and colleagues also observed an
interaction between diagnosis and genotype in the caudate nucleus in the striatum, but the
direction of this interaction effect was opposite to our result. It is unclear why our results
differ from those of Durston and colleages. One possibility may be related to differences
in the difficulty of the respective go/nogo tasks that were used in both studies: in our
paradigm a single trial lasted only 1.4s, compared to 4s, and the proportion of nogo-trials
was 10%, compared to 25%. It is therefore likely that in the present study, response
inhibition was more difficult, and successful inhibitions more rewarding, leading to
significant differences in baseline dopaminergic release in the striatum between the two
studies. Similar to our own findings, a recent study by Bédard and colleagues (2009) also
found increased striatal activation in individuals diagnosed with ADHD who possess two
copies of the 10R allele. Further research will be required to clarify the nature of these
interactions, as well as their consistency across different study samples.
There were also a number of regions that showed differences between participants
diagnosed with ADHD and typically developing adolescents. During successful
inhibitions, the ADHD group showed reduced activation in two parietal regions, the right
cuneus and the left inferior parietal cortex, while during commission errors they showed
reduced activation of the left superior frontal gyrus, as well as the ACC and the right
insula, two key regions for response-monitoring. This confirms previous findings of
hypofunction in ADHD in frontal and parietal regions (Durston, 2003). The insula
projects to striatal regions, where deactivation during response inhibition has also been
ADHD-Accepted Manuscript
45 6 7 8 9 10 11 12 13 14 15 16 17 18 19 20 21 22 23 24 25 26 27 28 29 30 31 32 33 34 35 36 37 38 39 40 41 42 43 44 45 46 47 48 49 50 51 52 53 54 55 56 57 58 59 60 61 62
related effects are not attributable to genetic variations in DAT1 but instead may be
driven by other genetic or environmental effects.
Conclusions
Imaging individuals with known genetic variation provides us with an exciting
opportunity to understand better the functional effects of DNA variation for brain and
cognition. Although we lack a full understanding of the pathways leading from gene to
changes in BOLD signaling, the current data suggest that fMRI indices may improve our
ability to detect subtle genetic effects compared with behavioural measures of cognition
alone. Here we have shown that DAT1 genotype influences the physiological substrates
of response inhibition and error processing, with effects for response inhibition being
most pronounced in children with ADHD. Our data add to a growing body of evidence
suggesting that differences in activation in brain regions underlying response inhibition in
ADHD are driven by genetic factors. By showing which behavioural effects and which
areas of cortical and subcortical activation are influenced by DAT1 genetic variation,
ADHD status or the interaction between the two, these results identify the specific
contribution of the dopamine transporter to executive functions such as response
Accepted Manuscript
45 6 7 8 9 10 11 12 13 14 15 16 17 18 19 20 21 22 23 24 25 26 27 28 29 30 31 32 33 34 35 36 37 38 39 40 41 42 43 44 45 46 47 48 49 50 51 52 53 54 55 56 57 58 59 60 61 62
Acknowledgements
This study was supported by grants from the Science Foundation Ireland, the Irish
Health Research Board, the Irish Higher Education Authority's Programme for Research
in Third-Level Institutions, the Australian National Health and Medical Research Council
Howard Florey Centenary Fellowship, and the FWO Research Foundation - Flanders.
Data-analysis was performed on computers of the Trinity Centre for High Performance
Computing. The authors would like to thank all participants, as well as their parents.
Legend to the figures and tables:
Figure 1: The Sustained Attention to Response Task (SART): timecourse of a single trial.
Figure 2: Behavioural performance measures. Error bars represent 1 S.E.
Figure 3: Brain regions activated during successful inhibitions. a) superior frontal gyri
and ACC, b) ACC, middle frontal gyrus and insulae, c) insulae and parietal lobe, d)
parietal lobes. Green: areas activated but showing no diagnosis or genotype differences,
Yellow: reduced activation for ADHD participants relative to controls; Dark Blue:
increased activation for HR relative to LR; Red: diagnosis x genotype interaction.
Figure 4: Interactions between diagnosis x genotype, in percentage signal change during
Accepted Manuscript
45 6 7 8 9 10 11 12 13 14 15 16 17 18 19 20 21 22 23 24 25 26 27 28 29 30 31 32 33 34 35 36 37 38 39 40 41 42 43 44 45 46 47 48 49 50 51 52 53 54 55 56 57 58 59 60 61 62
Figure 5: Brain regions activated during commission errors. a) superior and middle
frontal gyri and ACC, b) ACC, middle and superior frontal gyri, and left and right
inferior parietal lobes c) insulae and parahippocampal gyrus, d) ACC, left angular gyrus,
left and right superior frontal gyri, left and right parietal lobes and postcentral gyri.
Green: areas activated but showing no diagnosis or genotype differences; Yellow:
reduced activation for ADHD participants relative to controls; Light Blue: increased
activation for LR relative to HR; Red: diagnosis x genotype interaction.
Figure 6: Interactions between diagnosis x genotype, in percentage signal change during
commission errors.
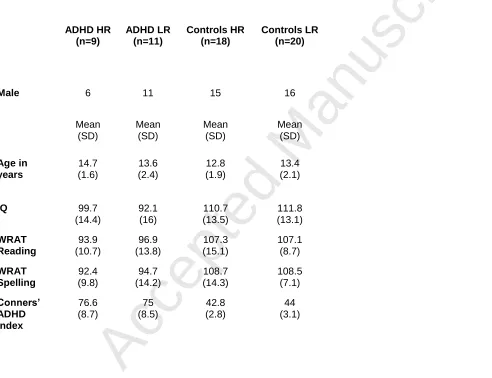
Table 1: Demographic information on the ADHD and control adolescents. The full
sample is displayed on the left, and the matched sample on the right.
Table 2: Brain regions activated during successful inhibitions. From left to right: location,
hemisphere, Brodman area(s), cluster-volume, coordinates (MNI), significance levels (*:
<.05; **:<.001) and direction for main effect of diagnosis, main effect of genotype, and
the interaction between diagnosis and genotype. Underlined effects were no longer
significant in the matched sample.
Table 3: Brain regions activated during commission errors. From left to right: location,
hemisphere, Brodman area(s), cluster-volume, coordinates (MNI), significance levels (*:
Accepted Manuscript
45 6 7 8 9 10 11 12 13 14 15 16 17 18 19 20 21 22 23 24 25 26 27 28 29 30 31 32 33 34 35 36 37 38 39 40 41 42 43 44 45 46 47 48 49 50 51 52 53 54 55 56 57 58 59 60 61 62
the interaction between diagnosis and genotype. Underlined effects were no longer
significant in the matched sample.
References:
Albayrak, O., Friedel, S., Schimmelmann, B. G., Hinney, A., & Hebebrand, J. (2008).
Genetic aspects in attention-deficit/hyperactivity disorder. Journal of Neural
Transmission, 115, 305-315.
Angold, A., Predergast, M., Cox, A., Harrington, R., Simonoff, E., & Rutter, M. (1995).
The Child and Adolescent Psychiatric Assessment (CAPA). Psychological Medicine, 25,
739-753.
Aron, R.A., Poldrack, R.A. (2005). The cognitive neuroscience of response inhibition:
Relevance for genetic research in attention-deficit/hyperactivity disorder. Biological
Psychiatry, 57, 1285–1292.
Banaschewski, T., Brandeis, D., Heinrich, H., Albrecht, B., Brunner, E., & Rothenberger,
A. (2004). Questioning inhibitory control as the specific deficit of ADHD – evidence
from brain electrical activity. Journal of neural transmission, 117, 841-864.
Bédard, A. C., Schulz, K. P., Cook, E. H. Jr, Fan, J., Clerkin, S. M., Ivanov, I., Halperin,
J. M., & Newcorn, J. H. (2009). Dopamine transporter gene variation modulates
activation of striatum in youth with ADHD. Neuroimage,
doi:10.1016/j.neuroimage.2009.12.041
Bellgrove, M, A., Hawi, Z., Kirley, A., Gill, M., & Robertson, I. H. (2005). Dissecting
Accepted Manuscript
45 6 7 8 9 10 11 12 13 14 15 16 17 18 19 20 21 22 23 24 25 26 27 28 29 30 31 32 33 34 35 36 37 38 39 40 41 42 43 44 45 46 47 48 49 50 51 52 53 54 55 56 57 58 59 60 61 62
response variability and spatial attentional asymmetries in relation to dopamine
transporter (DAT1) genotype. Neuropsychologia, 43, 1847-1857.
Braet, W., Johnson, K. A., Tobin, C. T., Acheson, R., Bellgrove, M. A., Robertson, I. H.,
& Garavan, H. (2009). Functional developmental changes underlying response inhibition
and error-detection processes. Neuropsychologia, 47, 3143-3151.
Buitelaar, J. K. (2002). Epidemiology: what have we learned over the last decade? In:
Sandberg S. (editor), Hyperactivity and attention-deficit disorders. Cambridge, UK:
Cambridge University Press.
Burock, M. A., Buckner, R. L., Woldorff, M. G., Rosen, B. R., & Dale, A. M. (1998).
Randomized event-related experimental designs allow for extremely rapid presentation
rates using functional MRI. Neuroreport, 9, 3735-3739.
Carlson, G. A., & Kelly, K. L. (2003). Stimulant rebound: how common is it and what
does it mean? Journal of Child and Adolescent Psychopharmacology, 13, 137-142.
Castellanos, F.X., Sonuga-Barke, E.J.S., Scheres, A., Di Martino, A., Hyde, C. &
Walters, J.R. (2005). Varieties of attention-deficit/hyperactivity disorder-related
intra-individual variability. Biological Psychiatry, 57, 1416–1423.
Conners, K. (1996). Rating scales in ADHD, Duke University Medical Center.
Cook, E. H., Stein, M. A., Krasowski, M. D., Cox, N. J., Olkon, D. M., Kieffer, J. E., &
Leventhal, B. L. (1995). Association of Attention-Deficit Disorder and the Dopamine
Transporter Gene. American Journal of Human Genetics, 56, 993-998.
Congdon, E., Lesch, K. P., & Canli, T. (2007). Analysis of DRD4 and DAT
polymorphisms and behavioral inhibition in healthy adults : implications for impulsivity.
Accepted Manuscript
45 6 7 8 9 10 11 12 13 14 15 16 17 18 19 20 21 22 23 24 25 26 27 28 29 30 31 32 33 34 35 36 37 38 39 40 41 42 43 44 45 46 47 48 49 50 51 52 53 54 55 56 57 58 59 60 61 62
Cornish, K. M., Manly, T., Savage, R., Swanson, J., Morisano, D., Butler, N., Grant, C.,
Cross, G., Bentley, L., & Hollis, C. P. (2005). Association of the dopamine transporter
(DAT1) 10/10-repeat genotype with ADHD symptoms and response inhibition in a
general population sample. Molecular Psychiatry, 10, 686-698.
Cox, R. W. (1996) AFNI: software for analysis and visualization of functional magnetic
resonance neuroimages. Computers and Biomedical Research, 29, 162-173.
Crosbie, J., Pérusse, D., Barr, C. L., & Schachar, R. J. (2008). Validating psychiatric
endophenotypes: inhibitory control and attention deficit hyperactivity disorder.
Neuroscience and Biobehavioral Reviews, 32, 40-55.
Durston, S. (2003). A review of the biological bases of ADHD: what have we learned
from imaging studies? Mental Retardation and Developmental Disabilities Research
Reviews, 9, 184–195.
Durston, S., Fossella, J. A., Mulder, M. J., Casey, B. J., Ziermans, T. B., Vessaz, M. N.,
& Van Engeland, H. (2008). Dopamine transporter genotype conveys familial risk of
attention-deficit/hyperactivity disorder through striatal activation. Journal of the
American Academy for Child and Adolescent Psychiatry, 47, 61-67.
Durston S, Mulder M, Casey BJ, Ziermans T, & van Engeland H. (2006). Activation in
ventral prefrontal cortex is sensitive to genetic vulnerability for attention-deficit
hyperactivity disorder. Biological Psychiatry, 60, 1062-1070.
Faraone, S. V., Biederman, J., & Mick, E. (2006). The age-dependent decline of attention
deficit hyperactivity disorder: a meta-analysis of follow-up studies. Psychological
Accepted Manuscript
45 6 7 8 9 10 11 12 13 14 15 16 17 18 19 20 21 22 23 24 25 26 27 28 29 30 31 32 33 34 35 36 37 38 39 40 41 42 43 44 45 46 47 48 49 50 51 52 53 54 55 56 57 58 59 60 61 62
Fassbender, C., Murphy, K., Foxe, J., Wylie, G., Javitt, D.C., Robertson, I.H., &
Garavan, H. (2004). A Topography of Executive Functions revealed by functional
Magnetic Resonance Imaging. Cognitive Brain Research, 20, 132-143.
Garavan, H, Ross, T. J., & Stein, E. A. (1999). Right hemispheric dominance of
inhibitory control: an event-related functional MRI study. Proceedings of the National
Academy of Sciences of the United States of America, 96, 8301-8306.
Friedman, N. P., Miyake, A., Young, S. E., Defries, J. C., Corley, R. P., & Hewitt, J. K.
(2008). Individual differences in executive functions are almost entirely genetic in origin.
Journal of Experimental Psychology: General, 137, 201-225.
Gizer, I. R., Ficks, C., & Waldman, I. D. (2009). Candidate gene studies of ADHD: a
meta-analytic review. Human Genetics, 126, 51–90.
Goldberg, T. E., & Weinberger, D. R. (2004). Genes and the parsing of cognitive
processes. Trends in Cognitive Sciences, 8, 325-335.
Gray, J. A. & McNaughton, N. (2000). The neuropsychology of anxiety: an enquiry into
the functions of the septo-hippocampal system (second edition), Oxford University Press,
Oxford.
Greene, C. M., Braet, W., Johnson, K. A., & Bellgrove, M. A. (2008). Imaging the
genetics of executive function. Biological Psychology, 79, 30-42.
Hester, R., Barre, N., Murphy, K., Silk, T., & Mattingley, J. B. (2008). Human medial
frontal cortex activity predicts learning from errors. Cerebral Cortex, 18, 1933-1940.
Johnson, K. A., Kelly, S. P., Bellgrove, M. A., Barry, E., Cox, M., Gill, M., & Robertson,
I. H. (2007). Response variability in attention deficit hyperactivity disorder: evidence for
Accepted Manuscript
45 6 7 8 9 10 11 12 13 14 15 16 17 18 19 20 21 22 23 24 25 26 27 28 29 30 31 32 33 34 35 36 37 38 39 40 41 42 43 44 45 46 47 48 49 50 51 52 53 54 55 56 57 58 59 60 61 62
Johnson, K. A., Kelly, S. P., Robertson, I. H., Barry, E., Mulligan, A., Daly, M., Lambert,
D., McDonnell, C., Connor, T. J., Hawi, Z., Gill, M., & Bellgrove, M. A. (2008).
Absence of the 7-repeat variant of the DRD4 VNTR is associated with drifting sustained
attention in children with ADHD but not in controls. American Journal of Medical
Genetics Part B Neuropsychiatric Genetics, 147B, 927-937.
Kebir, O., Tabbane, K., Sengupta, S., & Joober, R. (2009). Candidate genes and
neuropsychological phenotypes in children with ADHD: review of association studies.
Journal of Psychiatry and Neuroscience, 34, 88-101.
Kim, J. W., Kim, B. N., & Cho, S. C. (2006). The dopamine transporter gene and the
impulsivity phenotype in attention deficit hyperactivity disorder: a case-control
association study in a Korean sample. Journal of Psychiatric Research, 40, 730-737.
Krämer, U. M., Cunillera, T., Càmara, E., Marco-Pallarés, J., Cucurell, D., Nager, W.,
Bauer, P., Schüle, R., Schöls, L., Rodriguez-Fornells, A., & Münte, T. F. (2007). The
impact of catechol-O-methyltransferase and dopamine D4 receptor genotypes on
neurophysiological markers of performance monitoring. Journal of Neuroscience, 27,
14190-14198.
Langleben, D. D., Acton, P. D., Austin, G., Elman, I., Krikorian, G., Monterosso, J. R.,
Portnoy, O., Ridlehuber, H. W., & Strauss, H. W. (2002). Effects of methylphenidate
discontinuation on cerebral blood flow in prepubescent boys with attention deficit
hyperactivity disorder. Journal of Nuclear Medicine, 43, 1624-1629.
Marchetta, N. D., Hurks, P. P., De Sonneville, L. M., Krabbendam, L., & Jolles, J.
(2007). Sustained and focused attention deficits in adult ADHD. Journal of Attention
Accepted Manuscript
45 6 7 8 9 10 11 12 13 14 15 16 17 18 19 20 21 22 23 24 25 26 27 28 29 30 31 32 33 34 35 36 37 38 39 40 41 42 43 44 45 46 47 48 49 50 51 52 53 54 55 56 57 58 59 60 61 62
Mick, E., & Faraone, S. V. (2008). Genetics of attention deficit hyperactivity disorder.
Child and Adolescent Psychiatric Clinics of North America, 17, 261-284.
Mill, J., Asherson, P., Browes, C., D‟Souza, U., & Craig, I. (2002). Expression of the
dopamine transporter gene is regulated by the 3‟ UTR VNTR: Evidence from brain and
lymphocytes using quantitative RT-PCR. American Journal of Medical Genetics, 114,
975–979.
Nigg, J. T. (2005). Neuropsychologic theory and findings in
attention-deficit/hyperactivity disorder: the state of the field and salient challenges for the coming
decade. Biological Psychiatry, 57, 1424–1435.
O'Connell, R. G., Dockree, P. M., Bellgrove, M. A., Turin, A., Ward, S., Foxe, J. J., &
Robertson, I. H. (2009). Two Types of Action Error: Electrophysiological Evidence for
Separable Inhibitory and Sustained Attention Neural Mechanisms Producing Error on
Go/No-go Tasks. Journal of Cognitive Neuroscience, 21, 93-104.
Ramautar, J. R., Slagter, H. A., Kok, A., & Ridderinkhof, K. R. (2006). Probability
effects in the stop-signal paradigm: the insula and the significance of failed inhibition.
Brain Research, 1105, 143-154.
Rommelse, N. N., Altink, M. E., Arias-Vásquez, A., Buschgens, C. J., Fliers, E., Faraone,
S. V., Buitelaar, J. K., Sergeant, J. A., Franke, B., & Oosterlaan, J. (2008). A review and
analysis of the relationship between neuropsychological measures and DAT1 in ADHD.
American Journal of Medical Genetics Part B: Neuropsychiatric Genetics, 147B,
1536-1546.
Slaats-Willemse, D., Swaab-Barneveld, H., de Sonneville, L., van der Meulen, E., &
Accepted Manuscript
45 6 7 8 9 10 11 12 13 14 15 16 17 18 19 20 21 22 23 24 25 26 27 28 29 30 31 32 33 34 35 36 37 38 39 40 41 42 43 44 45 46 47 48 49 50 51 52 53 54 55 56 57 58 59 60 61 62
ADHD. Journal of the American Academy of Child and Adolescent Psychiatry, 42,
1242-1248.
Taylor, E. A. (1986), Childhood hyperactivity. British Journal of Psychiatry, 149, 562–
573.
Vaidya, C. J., Austin, G., Kirkorian, G., Ridlehuber, H. W., Desmond, J. E., Glover, G.
H., & Gabrieli, J. D. (1998). Selective effects of methylphenidate in attention deficit
hyperactivity disorder: a functional magnetic resonance study. Proceedings of the
National Academy of Sciences of the United States of America, 95, 14494 –14499.
van Meel, C. S., Heslenfeld, D. J., Oosterlaan, J., & Sergeant, J. A. (2007). Adaptive
control deficits in attention-deficit/hyperactivity disorder (ADHD): the role of error
processing. Psychiatry Research, 151, 211-220.
Van Dyck, C. H., Malison, R. T., Jacobsen, L. K., Seibyl, J. P., Staley, J. K., Laruelle,
M., Baldwin, R. M., Innis, R. B., & Gelernter, J. (2005). Increased dopamine transporter
availability associated with the 9-repeat allele of the SLC6A3 gene. Journal of Nuclear
Medicine, 46, 745-751.
Wodka, E.L., Mahone, E.M., Blankner, J.G., Larson, J.C., Fotedar, S., Denckla, M.B., &
Mostofsky, S. H. (2007). Evidence that response inhibition is a primary deficit in ADHD.
Accepted Manuscript
ADHD HR (n=9)
ADHD LR (n=11)
Controls HR (n=18)
Controls LR (n=20)
Male 6 11 15 16
Mean (SD)
Mean (SD)
Mean (SD)
Mean (SD)
Age in years
14.7 (1.6)
13.6 (2.4)
12.8 (1.9)
13.4 (2.1)
IQ 99.7
(14.4)
92.1 (16)
110.7 (13.5)
111.8 (13.1)
WRAT Reading
93.9 (10.7)
96.9 (13.8)
107.3 (15.1)
107.1 (8.7)
WRAT Spelling
92.4 (9.8)
94.7 (14.2)
108.7 (14.3)
108.5 (7.1)
Conners’ ADHD Index
76.6 (8.7)
75 (8.5)
42.8 (2.8)
[image:35.792.75.567.87.465.2]Accepted Manuscript
ADHD HR (n=5)
ADHD LR (n=8)
Controls HR (n=10)
Controls LR (n=10)
Male 5 8 10 10
Mean (SD)
Mean (SD)
Mean (SD)
Mean (SD)
Age in years
14.2 (1.9)
12.8 (2.4)
13.0 (2.1)
13.1 (2.1)
IQ 104
(12.1)
98.9 (12.8)
106.3 (13.5)
107.2 (12.6)
WRAT Reading
100.2 (9.8)
101.5 (8.5)
104.1 (15.3)
105.8 (8.8)
WRAT Spelling
97.8 (8.3)
100.1 (12)
102.1 (8.4)
106.7 (6.8)
Conners’ ADHD Index
75.4 (8.8)
76 (8.6)
43.6 (3.4)
Accepted Manuscript
name HS BA Vol (μl) X Y Z P(diagnosis) P(genotype) P(interaction)
frontal lobes
ACC BI 6 28478 3 9 45 * HR>LR *
superior frontal gyrus R 9/10 15167 36 39 34
superior frontal gyrus L 9/10 6041 -34 44 34 **
inferior frontal gyrus R 9/6 1011 45 2 42
middle frontal gyrus L 365 -28 -8 46
middle frontal gyrus R 46/9 176 46 15 31 * HR>LR
precentral gyrus R 6 211 48 -9 60
precentral gyrus L 4 172 -25 -25 70
cingulate gyrus L 24/31 155 -15 -21 37 *
subcortical regions
PCC BI 23 3674 0 -29 25
insula R 13 16400 34 14 -1
insula L 47 8724 -33 18 1
thalamus R 285 8 -22 8
thalamus L 227 -18 -26 6
caudate BI 223 3 0 9 * HR>LR
lentiform nucleus L 183 -12 5 5 *
mammilary body BI 188 0 -11 -8
cerebellum
cerebellar vermis BI 847 2 -27 -25
parietal lobes
supramarginal gyrus R 40 17116 51 -47 32 *
supramarginal gyrus L 40 247 -54 -49 23
precuneus R 7 3824 8 -77 34 *
precuneus R 31 628 13 -38 40
cuneus R 18 306 11 -72 -5 * c>a **
angular gyrus L 39 607 -33 -61 34
superior parietal lobule R 7/39 720 30 -66 33
inferior parietal lobule L 40 479 -58 -46 20
inferior parietal lobule L 40 168 -50 -45 43 * c>a
temporal lobes
middle temporal gyrus R 20 862 50 -25 -15 ** HR>LR
inferior temporal gyrus L 20 398 -48 -24 -22 * LR>HR
superior temporal gyrus L 13 153 -45 -41 16
superior temporal gyrus L 38 152 -55 11 -10
occipital lobes
Accepted Manuscript
ACC BI 32 23659 0 14 43 * c>a
superior frontal gyrus L 9/10 2179 -33 41 31 * c>a
superior frontal gyrus R 9/10 1992 31 42 37
middle frontal gyrus R 10 179 40 39 22 *
precentral gyrus R 13 263 45 -15 8
subcortical regions
PCC BI 23 885 0 -24 29
insula R 44 18975 42 10 7 * c>a
insula L 13 11383 -37 13 0
thalamus L 270 -12 -19 6
caudate R 979 10 5 6
caudate L 684 -9 4 1
parahippocampal gyrus BI 4030 3 -24 -18
parahippocampal gyrus L 30 270 -20 -40 -6 * LR>HR
culmen L 36 189 -21 -36 -21
cerebellum
declive L 37 157 -49 -55 -25
parietal lobes
inferior parietal lobule L 40 5689 -58 -44 27
inferior parietal lobule R 40 4007 56 -49 34
supramarginal gyrus L 40 354 -39 -54 36
cuneus L 7 162 -12 -78 32
cuneus R 18 216 10 -76 19
precuneus R 7 198 12 -78 39
angular gyrus L 39 152 -46 -77 33 **
postcentral gyrus L 3 956 -53 -26 42 * LR>HR
postcentral gyrus R 40 281 57 -26 32 * LR>HR
temporal lobes
superior temporal gyrus R 22 637 53 -47 12
transverse temporal
gyrus L 41 544 -54 -22 13