Is There an Energy Efficiency Gap?*
Hunt Allcott and Michael Greenstone
Reprint Series Number 239
*Reprinted from The Journal of Economic Perspectives, Vol. 26, No. 1, pp. 3-28, 2012, with kind permission from AEA. © All rights reserved.
public and private sectors in the U.S. and internationally.
The views expressed herein are those of the authors and do not necessarily reflect those of the Massachusetts Institute of Technology.
Journal of Economic Perspectives—Volume 26, Number 1—Winter 2012—Pages 3–28
M
M
any analysts of the energy industry have long believed that energy any analysts of the energy industry have long believed that energy effi ciency offers an enormous “win-win” opportunity: through effi ciency offers an enormous “win-win” opportunity: through aggres-sive energy conservation policies, we can both save money and reduce sive energy conservation policies, we can both save money and reduce negative externalities associated with energy use. In 1979, Pulitzer Prize-winning negative externalities associated with energy use. In 1979, Pulitzer Prize-winning author Daniel Yergin and the Harvard Business School Energy Project made an author Daniel Yergin and the Harvard Business School Energy Project made an early version of this argument in the bookearly version of this argument in the book Energy Future::
If the United States were to make a serious commitment to conservation, it might well consume 30 to 40 percent less energy than it now does, and still enjoy the same or an even higher standard of living . . . Although some of the barriers are economic, they are in most cases institutional, political, and social. Overcoming them requires a government policy that champions con-servation, that gives it a chance equal in the marketplace to that enjoyed by conventional sources of energy.
Thirty years later, consultancy McKinsey & Co. made a similar argument in its Thirty years later, consultancy McKinsey & Co. made a similar argument in its 2009 report,
2009 report, Unlocking Energy Effi ciency in the U.S. Economy ::
Energy effi ciency offers a vast, low-cost energy resource for the U.S. economy— but only if the nation can craft a comprehensive and innovative approach to
Is There an Energy Effi ciency Gap?
■
■ Hunt Allcott is Assistant Professor of Economics, New York University, New York City, New
York. Michael Greenstone is 3M Professor of Environmental Economics, Massachusetts Institute of Technology, Cambridge, Massachusetts. Allcott is a Faculty Research Fellow and Greenstone is a Research Associate, both at the National Bureau of Economic Research, Cambridge, Massachusetts. Their e-mail addresses are 〈〈[email protected]@nyu.edu〉〉 and 〈〈[email protected]@mit.edu〉〉.
doi=10.1257/jep.26.1.3
unlock it. Signifi cant and persistent barriers will need to be addressed at mul-tiple levels to stimulate demand for energy effi ciency and manage its delivery . . . If executed at scale, a holistic approach would yield gross energy savings worth more than $1.2 trillion, well above the $520 billion needed through 2020 for upfront investment in effi ciency measures (not including program costs). Such a program is estimated to reduce end-use energy consumption in 2020 by 9.1 quadrillion BTUs, roughly 23 percent of projected demand, potentially abating up to 1.1 gigatons of greenhouse gases annually.
In economic language, the “win-win” argument is that government In economic language, the “win-win” argument is that government interven-tion to encourage energy effi ciency can improve welfare for two reasons. First, the tion to encourage energy effi ciency can improve welfare for two reasons. First, the consumption of fossil fuels, which comprise the bulk of our current energy sources, consumption of fossil fuels, which comprise the bulk of our current energy sources, causes externalities such as harm to human health, climate change, and constraints causes externalities such as harm to human health, climate change, and constraints on the foreign policy objectives of energy-importing countries. Second, other forces on the foreign policy objectives of energy-importing countries. Second, other forces such as imperfect information may cause consumers and fi rms not to undertake such as imperfect information may cause consumers and fi rms not to undertake privately profi table investments in energy effi ciency. These forces, which we refer privately profi table investments in energy effi ciency. These forces, which we refer to as “investment ineffi ciencies,” would create what is popularly called an Energy to as “investment ineffi ciencies,” would create what is popularly called an Energy Effi ciency Gap: a wedge between the cost-minimizing level of energy effi ciency and Effi ciency Gap: a wedge between the cost-minimizing level of energy effi ciency and the level actually realized. Yergin, McKinsey & Co., and other analysts have argued the level actually realized. Yergin, McKinsey & Co., and other analysts have argued that this gap represents a signifi cant share of total energy use: in their view, the that this gap represents a signifi cant share of total energy use: in their view, the ground is littered with $20 bills that energy consumers have failed to pick up. ground is littered with $20 bills that energy consumers have failed to pick up.
The energy effi ciency policy debate often comingles these two types of market The energy effi ciency policy debate often comingles these two types of market failures—energy use externalities and investment ineffi ciencies—causing failures—energy use externalities and investment ineffi ciencies—causing impreci-sion in research questions and policy goals. In this paper, we distinguish between sion in research questions and policy goals. In this paper, we distinguish between the two market failures and clarify their separate policy implications. If energy use the two market failures and clarify their separate policy implications. If energy use externalities are the only market failure, it is well known that the social optimum externalities are the only market failure, it is well known that the social optimum is obtained with Pigouvian taxes or equivalent cap-and-trade programs that is obtained with Pigouvian taxes or equivalent cap-and-trade programs that inter-nalize these externalities into energy prices, and that substitute policies are often nalize these externalities into energy prices, and that substitute policies are often much less economically effi cient. If investment ineffi ciencies also exist, the fi rst-best much less economically effi cient. If investment ineffi ciencies also exist, the fi rst-best policy is to address the ineffi ciency directly: for example, by providing policy is to address the ineffi ciency directly: for example, by providing informa-tion to imperfectly informed consumers. However, when these interveninforma-tions are tion to imperfectly informed consumers. However, when these interventions are not fully effective and investment ineffi ciencies remain, policies that subsidize or not fully effective and investment ineffi ciencies remain, policies that subsidize or mandate energy effi ciency might increase welfare. The central economic question mandate energy effi ciency might increase welfare. The central economic question around energy effi ciency is thus whether there are investment ineffi ciencies that a around energy effi ciency is thus whether there are investment ineffi ciencies that a policy could correct—in other words, “Is there an Energy Effi ciency Gap?”
policy could correct—in other words, “Is there an Energy Effi ciency Gap?”
We examine two classes of evidence on the existence and magnitude of We examine two classes of evidence on the existence and magnitude of invest-ment ineffi ciencies that could cause the Energy Effi ciency Gap. First, we examine ment ineffi ciencies that could cause the Energy Effi ciency Gap. First, we examine choices made by consumers and fi rms, testing whether they fail to make investments choices made by consumers and fi rms, testing whether they fail to make investments that would increase utility or profi ts. Second, we focus on specifi c investment that would increase utility or profi ts. Second, we focus on specifi c investment inef-fi ciencies, testing for evidence consistent with each. After presenting the evidence, fi ciencies, testing for evidence consistent with each. After presenting the evidence, we discuss policy implications. Throughout the paper, we highlight how the we discuss policy implications. Throughout the paper, we highlight how the economics of energy effi ciency connects to important questions in other applied economics of energy effi ciency connects to important questions in other applied micro fi elds, including behavioral economics, industrial organization, and micro fi elds, including behavioral economics, industrial organization, and develop-ment microeconomics.
Hunt Allcott and Michael Greenstone 5
Three key conclusions arise. First, although there is a long literature assessing Three key conclusions arise. First, although there is a long literature assessing investment ineffi ciencies related to energy effi ciency, this body of evidence frequently investment ineffi ciencies related to energy effi ciency, this body of evidence frequently does not meet modern standards for credibility. A basic problem is that much of the does not meet modern standards for credibility. A basic problem is that much of the evidence on the energy cost savings from energy effi ciency comes from engineering evidence on the energy cost savings from energy effi ciency comes from engineering analyses or observational studies that can suffer from a set of well-known biases. analyses or observational studies that can suffer from a set of well-known biases. Furthermore, even if the energy cost savings were known, energy effi ciency Furthermore, even if the energy cost savings were known, energy effi ciency invest-ments often have other unobserved costs and benefi ts, making it diffi cult to assess ments often have other unobserved costs and benefi ts, making it diffi cult to assess welfare effects. This problem is general to other economic applications: in order to welfare effects. This problem is general to other economic applications: in order to argue that an agent is not maximizing an objective function, the analyst must argue that an agent is not maximizing an objective function, the analyst must cred-ibly observe that objective function in full. We believe that there is great potential ibly observe that objective function in full. We believe that there is great potential for a new body of credible empirical work in this area, both because the questions for a new body of credible empirical work in this area, both because the questions are so important and because there are signifi cant unexploited opportunities for are so important and because there are signifi cant unexploited opportunities for randomized controlled trials and quasi-experimental designs that have advanced randomized controlled trials and quasi-experimental designs that have advanced knowledge in other domains.
knowledge in other domains.
Second, when one tallies up the available empirical evidence from different Second, when one tallies up the available empirical evidence from different contexts, it is diffi cult to substantiate claims of a pervasive Energy Effi ciency Gap. contexts, it is diffi cult to substantiate claims of a pervasive Energy Effi ciency Gap. Some consumers appear to be imperfectly informed, and the evidence suggests Some consumers appear to be imperfectly informed, and the evidence suggests that investment ineffi ciencies do cause an increase in energy use in various settings. that investment ineffi ciencies do cause an increase in energy use in various settings. However, the empirical magnitudes of the investment ineffi ciencies appear to be However, the empirical magnitudes of the investment ineffi ciencies appear to be smaller, indeed substantially smaller, than the massive potential savings calculated smaller, indeed substantially smaller, than the massive potential savings calculated in engineering analyses such as McKinsey & Co. (2009).
in engineering analyses such as McKinsey & Co. (2009).
Third, because consumers are quite heterogeneous in the degree of their Third, because consumers are quite heterogeneous in the degree of their investment ineffi ciencies, it is crucial to design targeted policies. Subsidizing energy investment ineffi ciencies, it is crucial to design targeted policies. Subsidizing energy effi cient durables, for example, changes relative prices for all consumers. While this effi cient durables, for example, changes relative prices for all consumers. While this policy will increase welfare for some consumers, such benefi ts must be traded off policy will increase welfare for some consumers, such benefi ts must be traded off against distortions to consumers not subject to ineffi ciencies. Policy evaluations must against distortions to consumers not subject to ineffi ciencies. Policy evaluations must therefore consider not just how much a policy increases energy effi ciency, but what therefore consider not just how much a policy increases energy effi ciency, but what types of consumers are induced to become more energy effi cient. Welfare gains will types of consumers are induced to become more energy effi cient. Welfare gains will be larger from a policy that preferentially affects the decisions of consumers subject be larger from a policy that preferentially affects the decisions of consumers subject to investment ineffi ciencies.
to investment ineffi ciencies.
Background Facts on Energy Demand
Overview of Energy Demand and Energy Effi ciency
Table 1 presents the breakdown of total energy demand across the sectors of Table 1 presents the breakdown of total energy demand across the sectors of the U.S. economy. Much of our discussion focuses on household energy use and the U.S. economy. Much of our discussion focuses on household energy use and personal transportation instead of commercial and industrial energy use, because personal transportation instead of commercial and industrial energy use, because these are areas where ineffi ciencies of imperfect information might be more severe. these are areas where ineffi ciencies of imperfect information might be more severe. In 2007, the average U.S. household spent $2,400 on gasoline for their autos and In 2007, the average U.S. household spent $2,400 on gasoline for their autos and another $1,900 on natural gas, electricity, and heating oil (U.S. Bureau of Labor another $1,900 on natural gas, electricity, and heating oil (U.S. Bureau of Labor Statistics 2007). Of this latter fi gure, heating and cooling are the most signifi cant Statistics 2007). Of this latter fi gure, heating and cooling are the most signifi cant end uses, which suggests that they may also be the areas where energy conservation end uses, which suggests that they may also be the areas where energy conservation could have the largest effect.
The smaller the variance in energy costs across products relative to the total The smaller the variance in energy costs across products relative to the total purchase price, the more likely it is that consumers will choose to remain purchase price, the more likely it is that consumers will choose to remain imper-fectly informed about, or inattentive to, these costs (Sallee 2011). Figure 1 shows fectly informed about, or inattentive to, these costs (Sallee 2011). Figure 1 shows the lifetime energy cost of a selection of energy-using durables, discounted at the lifetime energy cost of a selection of energy-using durables, discounted at 6 percent over each good’s typical lifetime, as well as the ratio of energy cost to 6 percent over each good’s typical lifetime, as well as the ratio of energy cost to the purchase price. For example, if gasoline costs $3 per gallon, lifetime gasoline the purchase price. For example, if gasoline costs $3 per gallon, lifetime gasoline costs are $19,000 for a typical pickup truck, or 83 percent of the purchase price, costs are $19,000 for a typical pickup truck, or 83 percent of the purchase price, and $10,000 for a relatively energy effi cient sedan, or about 66 percent of purchase and $10,000 for a relatively energy effi cient sedan, or about 66 percent of purchase price. Typical lifetime energy costs are fi ve times greater than purchase prices for price. Typical lifetime energy costs are fi ve times greater than purchase prices for air conditioners and 12 times greater for incandescent light bulbs, but only about air conditioners and 12 times greater for incandescent light bulbs, but only about one-third of purchase price for a typical refrigerator.
one-third of purchase price for a typical refrigerator.
The most aggregate measure of energy effi ciency is the ratio of GDP to total The most aggregate measure of energy effi ciency is the ratio of GDP to total energy use, with different energy sources combined using common physical units. As energy use, with different energy sources combined using common physical units. As shown in Figure 2, U.S. “energy productivity” per unit of GDP is 2.4 times higher than shown in Figure 2, U.S. “energy productivity” per unit of GDP is 2.4 times higher than in 1949. Various factors drive this continual improvement, including compositional in 1949. Various factors drive this continual improvement, including compositional changes in the economy toward less-energy-intensive industries, energy effi ciency changes in the economy toward less-energy-intensive industries, energy effi ciency policies, and other forces that drive total factor productivity growth. Energy prices policies, and other forces that drive total factor productivity growth. Energy prices also induce factor substitution and technical change: the fi gure suggests this effect, also induce factor substitution and technical change: the fi gure suggests this effect, showing that the fastest improvements in energy productivity were in the 1970s showing that the fastest improvements in energy productivity were in the 1970s and the most recent 15 years, both periods of relatively high energy prices. The and the most recent 15 years, both periods of relatively high energy prices. The fi gure also shows that U.S. energy productivity has grown faster than total factor fi gure also shows that U.S. energy productivity has grown faster than total factor productivity since the beginning of that data series in 1987, meaning that through productivity since the beginning of that data series in 1987, meaning that through some combination of directed technical change and factor substitution, the United some combination of directed technical change and factor substitution, the United States is economizing on energy faster than it is economizing on other factors. The States is economizing on energy faster than it is economizing on other factors. The U.S. economy is more energy intensive than other OECD countries, although it has U.S. economy is more energy intensive than other OECD countries, although it has improved more quickly since 1980, and less energy intensive than the set of low- and improved more quickly since 1980, and less energy intensive than the set of low- and middle-income countries. In sum, the U.S. economy is progressively becoming less middle-income countries. In sum, the U.S. economy is progressively becoming less energy intensive, although this is uninformative about whether the United States is energy intensive, although this is uninformative about whether the United States is at or near the economically effi cient level of energy effi ciency.
at or near the economically effi cient level of energy effi ciency. Table 1
U.S. Energy Use
By sector (U.S. EIA 2011a)
Commercial 19%
Industrial 30%
Transport 29%
Residential 22%
Residential categories (U.S. EIA 2005)
Refrigerators 5%
Air conditioning 8%
Water heating 20%
Space heating 41%
Other appliances and lighting 26%
Is There an Energy Effi ciency Gap? 7
Figure 1
Energy Costs for Durable Goods
Lifetime energy costs ($)
Incandescent lightbulb Fluorescent lightbulb W ashing machine Refrigerator Air conditioner Car (29 MPG sedan) Truck (16 MPG pickup) House
Ratio of lifetime energy costs to price
1 10 100 1,000 10,000 100,000
Lifetime energy cost Lifetime energy cost/price
0.1 1 10
Figure 2
Energy Productivity Trends
Sources: For U.S. energy input productivity 1949–1980, U.S. EIA Annual Energy Review (2011a), table 1.5 〈http://www.eia.gov/totalenergy/data/annual/showtext.cfm?t=ptb0105⟩; for U.S. multifactor productivity, U.S. Bureau of Labor Statistics, 〈http://data.bls.gov/pdq/SurveyOutputServlet⟩; for other energy productivity, World Bank World Development Indicators, 〈http://data.worldbank.org/indicator⟩.
Notes: PPP is “purchasing power parity.” Multifactor productivity index equals 100 in 1990.
Source: Authors.
Energy productivity
(GDP (constant 2005 $ at PPP)
per kg oil equivalent)
Multifactor productivity (1990 = 100) 0 1 2 3 4 5 6 7 8 1949 1954 1959 1964 1969 1974 1979 1984 1989 1994 1999 2004 2009 0 20 40 60 80 100 120 140
U.S. energy productivity
Low/middle income country energy productivity OECD energy productivity
Energy Effi ciency Policy in the United States
The United States has enacted a wide array of policies to encourage energy The United States has enacted a wide array of policies to encourage energy effi ciency, many of which were originally promulgated during the energy crises of effi ciency, many of which were originally promulgated during the energy crises of the 1970s. Table 2 presents the most signifi cant of these policies, along with some the 1970s. Table 2 presents the most signifi cant of these policies, along with some measure of their annual costs. Auto industry policies include: Corporate Average measure of their annual costs. Auto industry policies include: Corporate Average Fuel Economy (CAFE) standards, which require that the new cars and trucks sold by Fuel Economy (CAFE) standards, which require that the new cars and trucks sold by each auto manufacturer meet a minimum average rating based on miles-per-gallon; each auto manufacturer meet a minimum average rating based on miles-per-gallon; tax credits of up to $3,400 for hybrid vehicle buyers; and “gas guzzler taxes” ranging tax credits of up to $3,400 for hybrid vehicle buyers; and “gas guzzler taxes” ranging from $1,000 to $7,700 on the sale of passenger cars with low fuel economy. There are from $1,000 to $7,700 on the sale of passenger cars with low fuel economy. There are a series of national-level minimum energy effi ciency standards for household a series of national-level minimum energy effi ciency standards for household appli-ances, such as refrigerators, air conditioners, and washing machines. Additionally, ances, such as refrigerators, air conditioners, and washing machines. Additionally, many states have building codes that encourage energy effi ciency by, for example, many states have building codes that encourage energy effi ciency by, for example, stipulating minimum amounts of required insulation. Furthermore, electricity bill stipulating minimum amounts of required insulation. Furthermore, electricity bill surcharges fund billions of dollars of utility-managed “demand-side management” surcharges fund billions of dollars of utility-managed “demand-side management” programs, which include subsidized residential and commercial energy audits, programs, which include subsidized residential and commercial energy audits, energy effi ciency information provision, and subsidies for energy effi cient energy effi ciency information provision, and subsidies for energy effi cient appli-ances and other capital investments.
ances and other capital investments. Table 2
Signifi cant U.S. Energy Effi ciency Policies
Name Year Magnitude
Corporate Average Fuel Economy Standards 1978– $10 billion annual incemental cost from tightened 2012 rule (NHTSA 2010) Federal Hybrid Vehicle Tax Credit 2006–2010 $426 million total annual credit
(Sallee 2010)
Gas guzzler tax 1980– $200 million annual revenues (Sallee 2010) Federal appliance energy effi ciency
standards
1990– $2.9 billion annual incremental cost (Gillingham, Newell, and Palmer 2006) Residential and commercial building codes 1978–
Electricity Demand-Side Management programs
1978– $3.6 billion annual cost (US EIA 2010) Weatherization Assistance Program (WAP) 1976– $250 million annual cost (US DOE 2011a) 2009 Economic Stimulus 2009–2011 $17 billion total (U.S. DOE 2011b) Additional WAP funding $5 billion
Recovery Through Retrofi t $454 million State Energy Program $3.1 billion Energy Effi ciency and Conservation Block
Grants
$3.2 billion
Home Energy Effi ciency Tax Credits $5.8 billion credit in 2009 (U.S. IRS 2011) Residential and Commercial Building
Initiative
$346 million Energy Effi cient Appliance Rebate
Program
$300 million Autos Cash for Clunkers $5 billion
Hunt Allcott and Michael Greenstone 9
“Weatherization” is frequently used as a general term for a set of residential “Weatherization” is frequently used as a general term for a set of residential energy effi ciency investments primarily including wall and attic insulation, improved energy effi ciency investments primarily including wall and attic insulation, improved heating, ventilation and air conditioning systems, and “air-sealing,” which reduces heating, ventilation and air conditioning systems, and “air-sealing,” which reduces the leakage of hot or cold outside air. Through the Weatherization Assistance the leakage of hot or cold outside air. Through the Weatherization Assistance Program, the federal government transfers $250 million annually to state agencies to Program, the federal government transfers $250 million annually to state agencies to weatherize approximately 100,000 low-income homes. Weatherization funding grew weatherize approximately 100,000 low-income homes. Weatherization funding grew signifi cantly due to the 2009 American Recovery and Reinvestment Act. In total, signifi cantly due to the 2009 American Recovery and Reinvestment Act. In total, that legislation and related economic stimulus bills included $17 billion in energy that legislation and related economic stimulus bills included $17 billion in energy effi ciency spending, including non-low-income weatherization programs, effi ciency spending, including non-low-income weatherization programs, automo-bile and appliance cash-for-clunkers programs with energy effi ciency requirements bile and appliance cash-for-clunkers programs with energy effi ciency requirements on new models, and other grants to state programs.
on new models, and other grants to state programs.
In this paper, the phrase “energy effi ciency policies” refers to this set of In this paper, the phrase “energy effi ciency policies” refers to this set of subsi-dies and standards that directly encourage investment in energy effi cient capital dies and standards that directly encourage investment in energy effi cient capital stock but do not directly affect energy prices. Although gasoline taxes, cap-and-trade stock but do not directly affect energy prices. Although gasoline taxes, cap-and-trade programs, or other policies that affect energy prices will of course also increase programs, or other policies that affect energy prices will of course also increase investment in energy effi cient capital stock, these policies that act through energy investment in energy effi cient capital stock, these policies that act through energy prices are conceptually distinct in our policy analysis.
prices are conceptually distinct in our policy analysis.
A Model of Investment in Energy Effi ciency
The basic economics of energy effi ciency are captured by a model in which The basic economics of energy effi ciency are captured by a model in which an agent, either a profi t-maximizing fi rm or utility-maximizing consumer, chooses an agent, either a profi t-maximizing fi rm or utility-maximizing consumer, chooses between two different versions of an energy-using durable good such as an between two different versions of an energy-using durable good such as an auto-mobile, air conditioner, or light bulb.
mobile, air conditioner, or light bulb.11 This setup can also represent a choice of This setup can also represent a choice of whether to improve the energy effi ciency of an existing building, for example whether to improve the energy effi ciency of an existing building, for example through weatherization. In the fi rst period, the agent chooses and pays for capital through weatherization. In the fi rst period, the agent chooses and pays for capital investments. In the second period, the consumer uses the good and incurs investments. In the second period, the consumer uses the good and incurs energy costs.
energy costs.
The two different goods are denoted 0, for the energy ineffi cient baseline, and The two different goods are denoted 0, for the energy ineffi cient baseline, and 1, for the energy effi cient version. They have energy intensities
1, for the energy effi cient version. They have energy intensities e00 and and e11, respectively, , respectively,
with
with e00 >> e11. The energy effi cient good has incremental upfront capital cost . The energy effi cient good has incremental upfront capital cost c >> 0 and 0 and
unobserved incremental opportunity cost or utility cost
unobserved incremental opportunity cost or utility cost ξξ. The variable . The variable ξξ could either could either be positive (an unobserved cost) or negative (an unobserved benefi t). The private be positive (an unobserved cost) or negative (an unobserved benefi t). The private cost of energy is
cost of energy is p, and the risk-adjusted discount rate between the two periods is , and the risk-adjusted discount rate between the two periods is r >> 0. The variable 0. The variable m represents an agent’s taste for usage of the durable good; a high represents an agent’s taste for usage of the durable good; a high m refl ects an air conditioner user in a hot climate or a car owner who drives a long refl ects an air conditioner user in a hot climate or a car owner who drives a long way to work. The variable
way to work. The variable m is implicitly a function of energy prices: as energy prices is implicitly a function of energy prices: as energy prices
1 The model presented here is an adaptation of the model in Allcott, Mullainathan, and Taubinsky
(2011). It resembles a generalized Roy model. It abstracts away from factors which may be relevant in some settings, including the irreversibility of some energy effi ciency investments and uncertainty over energy costs (Dixit and Pindyck 1994; Hassett and Metcalf 1993) and explicit models of imperfect infor-mation in the purchase or resale of the good.
rise, the cost of utilization increases, so utilization decreases. We index
rise, the cost of utilization increases, so utilization decreases. We index mii to explicitly to explicitly recognize that it varies across agents, although in practice
recognize that it varies across agents, although in practice ξξ and and p will also vary. will also vary. In the basic case, an agent’s willingness-to-pay for the energy effi cient good is In the basic case, an agent’s willingness-to-pay for the energy effi cient good is the discounted energy cost savings net of unobserved costs. Agent
the discounted energy cost savings net of unobserved costs. Agent i will choose the will choose the energy effi cient good if and only if willingness to pay outweighs the incremental energy effi cient good if and only if willingness to pay outweighs the incremental capital costs:
capital costs:
_ pmi(e0 – e1) (1 + r) – ξ > c.
To capture the essence of the Energy Effi ciency Gap, we introduce the parameter γ, which is an implicit weight on the energy cost savings in the agent’s decision. Now, the agent chooses the energy effi cient good if and only if:
γ__ pmi(e0 – e1) (1 + r) – ξ > c.
For the purpose of determining the effects of subsidizing the energy effi cient good, the γ parameter is a suffi cient statistic for all investment ineffi ciencies. As we will discuss later in more detail, there are several distinct types of investment ineffi -ciencies. First, agents may be unaware of, imperfectly informed about, or inattentive to energy cost savings. Second, agents may be themselves perfectly informed but unable to convey costlessly the energy intensity e1 of an improved house or
apart-ment they are selling or renting to others. Third, credit markets may be imperfect, meaning that agents may not have access to credit at the risk-adjusted discount rate r. 2 The γ parameter is conceptually related to what others have called an “implied discount rate,” which is the discount rate that rationalizes the tradeoffs that agents make between upfront investment costs and future energy savings.
It is often asserted that
It is often asserted that γγ << 1, meaning that investment ineffi ciencies cause agents 1, meaning that investment ineffi ciencies cause agents to value discounted energy cost savings less than upfront costs. Notice that when this to value discounted energy cost savings less than upfront costs. Notice that when this is the case, some agents do not choose the energy effi cient good despite the fact that is the case, some agents do not choose the energy effi cient good despite the fact that this would be profi table at current energy prices. Formally, asserting that there is an this would be profi table at current energy prices. Formally, asserting that there is an “Energy Effi ciency Gap” is exactly equivalent to asserting that there are investment “Energy Effi ciency Gap” is exactly equivalent to asserting that there are investment ineffi ciencies and
ineffi ciencies and γγ << 1. Of course, in some settings it might be that 1. Of course, in some settings it might be that γγ >> 1. 1. Other than the investment ineffi ciencies captured by
Other than the investment ineffi ciencies captured by γγ, the additional element , the additional element of the “win-win argument” is that there are additional social costs from energy use of the “win-win argument” is that there are additional social costs from energy use that are not internalized into energy prices. We denote this uninternalized that are not internalized into energy prices. We denote this uninternalized exter-nality by
nality by φφ. In the social optimum, the agent adopts the energy effi cient good if:. In the social optimum, the agent adopts the energy effi cient good if:
(p __ + φ)mi(e0 – e1) (1 + r) – ξ > c.
2 Credit constraints are a frequently discussed investment ineffi ciency. Although we note the issue in
theory, there is not much empirical evidence in the context of energy effi ciency, so we will not discuss it further.
Is There an Energy Effi ciency Gap? 11
The social optimum differs from the agent’s choice in the previous equation for two reasons. First, the allocation accounts for the externality φ. Second, the allocation is not affected by investment ineffi ciencies, so γ= 1.
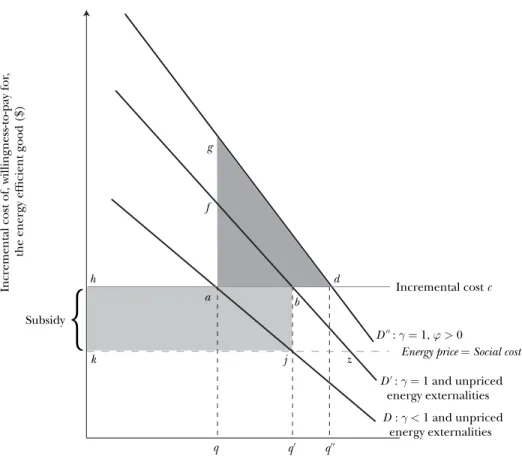
Figure 3 illustrates the three cases. The fi gure’s horizontal axis represents the Figure 3 illustrates the three cases. The fi gure’s horizontal axis represents the quantity of the energy effi cient good that is purchased, while the vertical axis shows quantity of the energy effi cient good that is purchased, while the vertical axis shows the incremental costs and benefi ts of purchasing that good. The height of a demand the incremental costs and benefi ts of purchasing that good. The height of a demand curve at each point refl ects some individual agent’s willingness-to-pay from the curve at each point refl ects some individual agent’s willingness-to-pay from the left-hand side of a corresponding equation above. The agents on the left side of the hand side of a corresponding equation above. The agents on the left side of the fi gure, with higher willingness-to-pay, tend to have high usage
fi gure, with higher willingness-to-pay, tend to have high usage m, low unobserved , low unobserved cost
cost ξξ, and high energy price , and high energy price p..
The lowest demand curve, denoted
The lowest demand curve, denoted D, refl ects the case in the second equa-, refl ects the case in the second equa-tion with both investment ineffi ciencies (
tion with both investment ineffi ciencies (γγ << 1) and uninternalized energy use 1) and uninternalized energy use externalities. In this case, the market equilibrium is at point
externalities. In this case, the market equilibrium is at point a, the intersection , the intersection of demand curve
of demand curve D with incremental cost with incremental cost c. Demand curve . Demand curve D′′ refl ects the case in refl ects the case in Figure 3
Demand for the Energy Effi cient Good
Incremental cost of, willingness-to-pay for
,
the energy efficient good ($)
Quantity of the energy efficient good Subsidy g f h k b d z j Incremental cost c q q′ q″ D″ : γ= 1, φ> 0
Energy price=Social cost D′ : γ= 1 and unpriced energy externalities
D : γ< 1 and unpriced energy externalities
the fi rst equation with no investment ineffi ciencies, but energy still priced below the fi rst equation with no investment ineffi ciencies, but energy still priced below social cost. Demand curve
social cost. Demand curve D ″″ refl ects the social optimum in the third equation, refl ects the social optimum in the third equation, where there are no investment ineffi ciencies and energy prices include externality where there are no investment ineffi ciencies and energy prices include externality φ
φ. Adding a Pigouvian tax on energy consumption (based on the energy source’s . Adding a Pigouvian tax on energy consumption (based on the energy source’s pollution content) increases willingness-to-pay more for the consumers on the left pollution content) increases willingness-to-pay more for the consumers on the left of the fi gure with higher utilization, so demand curve
of the fi gure with higher utilization, so demand curve D ″″ rotates clockwise rela- rotates clockwise rela-tive to demand curve
tive to demand curve D ′′. The fi rst-best equilibrium is point . The fi rst-best equilibrium is point d, where , where D ″″ intersects intersects incremental cost
incremental cost c..
From a policy perspective, it is crucial to distinguish the two types of market From a policy perspective, it is crucial to distinguish the two types of market failures, energy use externalities and investment ineffi ciencies. The reason derives failures, energy use externalities and investment ineffi ciencies. The reason derives from the general principle that policies should address market failures as directly as from the general principle that policies should address market failures as directly as possible. If there are no investment ineffi ciencies but energy prices are below social possible. If there are no investment ineffi ciencies but energy prices are below social cost due to uninternalized energy use externalities, demand is represented by cost due to uninternalized energy use externalities, demand is represented by D ′′. . This causes a distortion both in the purchase and in the utilization of energy-using This causes a distortion both in the purchase and in the utilization of energy-using durables: for example, consumers buy too many gas guzzlers and drive them too durables: for example, consumers buy too many gas guzzlers and drive them too much. A Pigouvian tax of amount
much. A Pigouvian tax of amount φφ on energy (on gas, in the example) would on energy (on gas, in the example) would give both the socially optimal quantity demanded (
give both the socially optimal quantity demanded (q ″″ ) of the energy effi cient good ) of the energy effi cient good and the socially optimal utilization. By contrast, as long as utilization is not fully and the socially optimal utilization. By contrast, as long as utilization is not fully price-inelastic, a subsidy for the energy effi cient good does not achieve the fi rst best. price-inelastic, a subsidy for the energy effi cient good does not achieve the fi rst best. While this could move quantity demanded to
While this could move quantity demanded to q ″″, consumers would not face the true , consumers would not face the true social cost of energy when deciding how much to use the good: consumers would social cost of energy when deciding how much to use the good: consumers would buy the right number of gas guzzlers but still drive them too much.
buy the right number of gas guzzlers but still drive them too much.
Many investment ineffi ciencies, on the other hand, distort purchases but not Many investment ineffi ciencies, on the other hand, distort purchases but not utilization. If there are investment ineffi ciencies but no uninternalized energy use utilization. If there are investment ineffi ciencies but no uninternalized energy use externalities, the optimal corrective policy affects purchases, but not utilization. For externalities, the optimal corrective policy affects purchases, but not utilization. For example, Allcott, Mullainathan, and Taubinsky (2011) show that when consumers example, Allcott, Mullainathan, and Taubinsky (2011) show that when consumers have homogeneous
have homogeneous γγ << 1 and vary only in utilization 1 and vary only in utilization mii , the fi rst-best policy involves , the fi rst-best policy involves a subsidy for the energy effi cient good.
a subsidy for the energy effi cient good.33 In Figure 3, that optimal subsidy would In Figure 3, that optimal subsidy would
move quantity demanded from
move quantity demanded from q to to q ′′. Notice that an energy tax could potentially . Notice that an energy tax could potentially also correct the investment ineffi ciency, giving the same marginal consumer at also correct the investment ineffi ciency, giving the same marginal consumer at q ′′. . However, as long as utilization is not fully inelastic, an energy tax that gives price However, as long as utilization is not fully inelastic, an energy tax that gives price above social cost (to correct the investment ineffi ciency) would cause consumers to above social cost (to correct the investment ineffi ciency) would cause consumers to reduce utilization below the fi rst-best level: consumers would buy the right number reduce utilization below the fi rst-best level: consumers would buy the right number of gas guzzlers and then drive them too little.
of gas guzzlers and then drive them too little.
Putting these arguments together, when there are distortions from both Putting these arguments together, when there are distortions from both uninternalized energy use externalities and investment ineffi ciencies, the fi rst-best uninternalized energy use externalities and investment ineffi ciencies, the fi rst-best policy involves both Pigouvian taxes on energy and a second mechanism to increase policy involves both Pigouvian taxes on energy and a second mechanism to increase quantity demanded of the energy effi cient good. This second mechanism may quantity demanded of the energy effi cient good. This second mechanism may be a subsidy for the energy effi cient good, although as we will discuss later in the be a subsidy for the energy effi cient good, although as we will discuss later in the paper, heterogeneity in the investment ineffi ciency
paper, heterogeneity in the investment ineffi ciency γγ makes subsidies potentially makes subsidies potentially less desirable.
less desirable.
Hunt Allcott and Michael Greenstone 13
How can this framework be used for cost–benefi t analysis? Consider fi rst How can this framework be used for cost–benefi t analysis? Consider fi rst adding the subsidy in isolation, without any Pigouvian tax on energy. When there adding the subsidy in isolation, without any Pigouvian tax on energy. When there are investment ineffi ciencies, the original marginal consumer at quantity
are investment ineffi ciencies, the original marginal consumer at quantity q gains gains amount
amount af from being induced to buy the energy effi cient good. In fact, there are from being induced to buy the energy effi cient good. In fact, there are allocative gains from inducing each of the consumers between
allocative gains from inducing each of the consumers between q and and q ′′ to purchase to purchase the energy effi cient good, as each of these consumers has benefi ts that are larger the energy effi cient good, as each of these consumers has benefi ts that are larger than incremental cost
than incremental cost c. The total private welfare gains are illustrated by the triangle . The total private welfare gains are illustrated by the triangle abf. If a Pigouvian tax on energy is added to this subsidy, then the total social welfare . If a Pigouvian tax on energy is added to this subsidy, then the total social welfare gain is illustrated by the triangle
gain is illustrated by the triangle adg..
These benefi ts are then compared against the costs of the policy. A subsidy These benefi ts are then compared against the costs of the policy. A subsidy involves a transfer of public funds to consumers of amount
involves a transfer of public funds to consumers of amount hbjk, as illustrated by , as illustrated by the shaded rectangle. If those funds could otherwise be used to lower labor taxes, the shaded rectangle. If those funds could otherwise be used to lower labor taxes, the deadweight loss of these taxes would be included as a social cost, along with any the deadweight loss of these taxes would be included as a social cost, along with any other costs of administering the subsidy.
other costs of administering the subsidy.44 Similarly, an information program that Similarly, an information program that
moved demand from
moved demand from D to to D ′′ would also increase private welfare by would also increase private welfare by abf, and this , and this welfare gain would be traded off with the costs of implementation. For any policy, it welfare gain would be traded off with the costs of implementation. For any policy, it will be an empirical question whether the costs exceed the benefi ts, and whether the will be an empirical question whether the costs exceed the benefi ts, and whether the net benefi ts are larger than alternative policies. This approach to assessing net welfare net benefi ts are larger than alternative policies. This approach to assessing net welfare benefi ts is the appropriate test of whether energy effi ciency policies are socially benefi ts is the appropriate test of whether energy effi ciency policies are socially benefi cial when Pigouvian taxes are also available to correct energy use externalities. benefi cial when Pigouvian taxes are also available to correct energy use externalities. To summarize, this section has analyzed two forces that can cause behavior to To summarize, this section has analyzed two forces that can cause behavior to differ from the social optimum: energy use externalities and investment ineffi differ from the social optimum: energy use externalities and investment ineffi cien-cies. If there are energy use externalities but no investment ineffi ciencies, ideally cies. If there are energy use externalities but no investment ineffi ciencies, ideally only Pigouvian taxes would be used. If there are investment ineffi ciencies, energy only Pigouvian taxes would be used. If there are investment ineffi ciencies, energy effi ciency policies such as subsidies for energy effi cient capital stock might have effi ciency policies such as subsidies for energy effi cient capital stock might have benefi ts that outweigh their costs. If there are both investment ineffi ciencies and benefi ts that outweigh their costs. If there are both investment ineffi ciencies and energy use externalities, then Pigouvian taxes should be used in combination with energy use externalities, then Pigouvian taxes should be used in combination with some welfare-improving energy effi ciency policy. The central economic questions some welfare-improving energy effi ciency policy. The central economic questions are thus whether there are investment ineffi ciencies, and if so, whether the benefi ts are thus whether there are investment ineffi ciencies, and if so, whether the benefi ts of a corrective policy outweigh its costs.
of a corrective policy outweigh its costs.
In the next section, we will examine choices by consumers and fi rms to adopt In the next section, we will examine choices by consumers and fi rms to adopt or not adopt energy effi cient technologies and attempt to infer whether there is an or not adopt energy effi cient technologies and attempt to infer whether there is an Energy Effi ciency Gap. When there are no investment ineffi ciencies, agents’ choices Energy Effi ciency Gap. When there are no investment ineffi ciencies, agents’ choices are governed by the fi rst equation above, and unobserved factors such as costs are governed by the fi rst equation above, and unobserved factors such as costs ξξ or or utilization
utilization m can be inferred from their decisions. Some analysts have relied heavily can be inferred from their decisions. Some analysts have relied heavily on this framework in explaining away an apparent Energy Effi ciency Gap, with an on this framework in explaining away an apparent Energy Effi ciency Gap, with an argument along the lines that “agents are well-informed, so if they are not energy argument along the lines that “agents are well-informed, so if they are not energy effi cient, then it must be that the unobserved costs of energy effi ciency are large.” effi cient, then it must be that the unobserved costs of energy effi ciency are large.” The analysis is more diffi cult when there might be investment ineffi ciencies. In that The analysis is more diffi cult when there might be investment ineffi ciencies. In that case, we now must know everything about agents’ objective functions to estimate case, we now must know everything about agents’ objective functions to estimate the size of
the size of γγ..
4 Analogously, a Pigouvian tax brings in public funds that can be used to lower labor taxes, which should
Three types of problems will pervade the analyses we review in the next section. Three types of problems will pervade the analyses we review in the next section. First, factors that are diffi cult to observe or quantify, as denoted by
First, factors that are diffi cult to observe or quantify, as denoted by ξξ in our model in our model above, will be potentially very relevant. Second, estimates of the net present value above, will be potentially very relevant. Second, estimates of the net present value of energy cost savings are often questionable. Depending on the setting, this could of energy cost savings are often questionable. Depending on the setting, this could be because the analyst does not know the change in energy intensity (
be because the analyst does not know the change in energy intensity (e00 – – e11), the ), the
utilization
utilization m, or the appropriate discount rate , or the appropriate discount rate r. Third, there is often substantial . Third, there is often substantial heterogeneity across consumers in utilization and unobserved costs, meaning that heterogeneity across consumers in utilization and unobserved costs, meaning that average returns for adopters might be uninformative about average returns for average returns for adopters might be uninformative about average returns for non-adopters or returns for the marginal adopter.
adopters or returns for the marginal adopter.
These empirical problems directly parallel other economic contexts. Consider, These empirical problems directly parallel other economic contexts. Consider, for example, the question of whether farmers in developing countries could for example, the question of whether farmers in developing countries could prof-itably adopt agricultural technologies such as fertilizer and high-yielding variety itably adopt agricultural technologies such as fertilizer and high-yielding variety seeds. These technologies have unobserved costs, such as increased labor inputs seeds. These technologies have unobserved costs, such as increased labor inputs (Foster and Rosenzweig 2010). It is diffi cult to know the resulting increase in profi ts (Foster and Rosenzweig 2010). It is diffi cult to know the resulting increase in profi ts without randomized controlled trials, as in Dufl o, Kremer, and Robinson (2011). without randomized controlled trials, as in Dufl o, Kremer, and Robinson (2011). Also, the substantial heterogeneity in costs and gross returns means that the fact Also, the substantial heterogeneity in costs and gross returns means that the fact that adopters have high returns does not imply that non-adopters are foregoing a that adopters have high returns does not imply that non-adopters are foregoing a profi table investment (Suri 2011).
profi table investment (Suri 2011).
Evidence on Returns to Energy Effi ciency Investments
In this section, we analyze the evidence on whether consumers and fi rms leave In this section, we analyze the evidence on whether consumers and fi rms leave profi table energy effi ciency investments on the table. There are four categories profi table energy effi ciency investments on the table. There are four categories of evidence: engineering estimates of returns to potential investments, empirical of evidence: engineering estimates of returns to potential investments, empirical estimates of returns to observed investments, the cost effectiveness of energy estimates of returns to observed investments, the cost effectiveness of energy conservation programs run by electric utilities, and estimated demand patterns for conservation programs run by electric utilities, and estimated demand patterns for energy-using durables.
energy-using durables.
Engineering Estimates of Energy Conservation Cost Curves
While the McKinsey & Co. (2009) study quoted in our introduction has garnered While the McKinsey & Co. (2009) study quoted in our introduction has garnered substantial attention, it is preceded by a long literature that uses engineering cost substantial attention, it is preceded by a long literature that uses engineering cost estimates to construct “supply curves” for energy effi ciency (for example, Meier, estimates to construct “supply curves” for energy effi ciency (for example, Meier, Wright, and Rosenfeld 1983; ACEEE 1989; Goldstein, Mowris, Davis, and Dolan Wright, and Rosenfeld 1983; ACEEE 1989; Goldstein, Mowris, Davis, and Dolan 1990; Koomey et al. 1991; Brown, Levine, Romm, Rosenfeld, and Koomey 1998; 1990; Koomey et al. 1991; Brown, Levine, Romm, Rosenfeld, and Koomey 1998; National Academy of Sciences 1992; Rosenfeld, Atkinson, Koomey, Meier, Mowris, National Academy of Sciences 1992; Rosenfeld, Atkinson, Koomey, Meier, Mowris, and Price 1993; Stoft 1995; Blumstein and Stoft 1995; Brown, Levine, Short, and and Price 1993; Stoft 1995; Blumstein and Stoft 1995; Brown, Levine, Short, and Koomey 2001). The basic approach in such studies is to calculate the net present Koomey 2001). The basic approach in such studies is to calculate the net present value of a set of possible energy effi ciency investments given assumed capital costs, value of a set of possible energy effi ciency investments given assumed capital costs, energy prices, investment horizons, and discount rates.
energy prices, investment horizons, and discount rates.
Across many studies from different industries and sectors, a common theme Across many studies from different industries and sectors, a common theme seems to emerge: large fractions of energy can be conserved at
seems to emerge: large fractions of energy can be conserved at negative net cost. net cost. That is, the studies conclude that consumers and fi rms are failing to exploit a That is, the studies conclude that consumers and fi rms are failing to exploit a massive amount of profi table investment opportunities in energy effi ciency. For massive amount of profi table investment opportunities in energy effi ciency. For
Is There an Energy Effi ciency Gap? 15
example, a meta-analysis by Rosenfeld, Atkinson, Koomey, Meier, Mowris, and example, a meta-analysis by Rosenfeld, Atkinson, Koomey, Meier, Mowris, and Price (1993) concludes that between 20 and 60 percent of total electricity use, Price (1993) concludes that between 20 and 60 percent of total electricity use, depending on the study and the electricity cost assumption, can be conserved at depending on the study and the electricity cost assumption, can be conserved at negative cost. The McKinsey & Co. (2009) analysis quoted in our introduction negative cost. The McKinsey & Co. (2009) analysis quoted in our introduction suggests that 23 percent of U.S. nontransportation energy demand can be suggests that 23 percent of U.S. nontransportation energy demand can be elimi-nated at negative cost. These engineering studies are a large part of the basis for nated at negative cost. These engineering studies are a large part of the basis for the claims about the Energy Effi ciency Gap.
the claims about the Energy Effi ciency Gap.
However, it is diffi cult to take at face value the quantitative conclusions of However, it is diffi cult to take at face value the quantitative conclusions of the engineering analyses as they suffer from the empirical problems introduced the engineering analyses as they suffer from the empirical problems introduced in the previous section. First, engineering costs typically incorporate only upfront in the previous section. First, engineering costs typically incorporate only upfront capital costs and omit opportunity costs or other unobserved factors (
capital costs and omit opportunity costs or other unobserved factors (ξξ in the model in the model presented earlier). For example, Anderson and Newell (2004) analyze energy audits presented earlier). For example, Anderson and Newell (2004) analyze energy audits that the U.S. Department of Energy provides for free to small- and medium-sized that the U.S. Department of Energy provides for free to small- and medium-sized enterprises. They fi nd that nearly half of investments that engineering assessments enterprises. They fi nd that nearly half of investments that engineering assessments showed would have short payback periods were not adopted due to unaccounted showed would have short payback periods were not adopted due to unaccounted physical costs, risks, or opportunity costs, such as “lack of staff for physical costs, risks, or opportunity costs, such as “lack of staff for analysis/imple-mentation,” “risk of inconvenience to personnel,” or “suspected risk of problem mentation,” “risk of inconvenience to personnel,” or “suspected risk of problem with equipment.”
with equipment.”
Second, the engineering estimates of energy saved may be faulty. For example, Second, the engineering estimates of energy saved may be faulty. For example, in the context of home energy weatherization, Dubin, Miedema, and Chandran in the context of home energy weatherization, Dubin, Miedema, and Chandran (1986), Nadel and Keating (1991), and others have documented that engineering (1986), Nadel and Keating (1991), and others have documented that engineering estimates of energy savings can overstate true fi eld returns, sometimes by a large estimates of energy savings can overstate true fi eld returns, sometimes by a large amount. Even in the two decades since these studies, some engineering amount. Even in the two decades since these studies, some engineering simu-lation models have still not been fully calibrated to approximate actual returns lation models have still not been fully calibrated to approximate actual returns (Blasnik 2010).
(Blasnik 2010).
Empirical Estimates of Returns on Investment
Another approach to measuring the Energy Effi ciency Gap is to use empirical Another approach to measuring the Energy Effi ciency Gap is to use empirical energy use data to estimate the average returns for the set of consumers that adopt energy use data to estimate the average returns for the set of consumers that adopt an energy effi cient technology. Most of the evidence in this category analyzes the an energy effi cient technology. Most of the evidence in this category analyzes the costs and benefi ts of the Weatherization Assistance Program, which is intended costs and benefi ts of the Weatherization Assistance Program, which is intended to be both a transfer to low-income homeowners and an energy effi ciency to be both a transfer to low-income homeowners and an energy effi ciency investment with positive net returns. The typical empirical analysis compares investment with positive net returns. The typical empirical analysis compares natural gas billing data in the fi rst year after the weatherization work was done natural gas billing data in the fi rst year after the weatherization work was done to the year before, using either a statistical correction for weather differences to the year before, using either a statistical correction for weather differences or a nonrandomly selected control group of low-income households. Schweitzer or a nonrandomly selected control group of low-income households. Schweitzer (2005) analyzes 38 separate empirical evaluations of weatherization projects from (2005) analyzes 38 separate empirical evaluations of weatherization projects from 19 states from between 1993 and 2005, reweighting them to refl ect the observable 19 states from between 1993 and 2005, reweighting them to refl ect the observable characteristics of the national Weatherization Assistance Program. The average characteristics of the national Weatherization Assistance Program. The average weatherization job costs $2,600 and reduces natural gas use by 20 to 25 percent, weatherization job costs $2,600 and reduces natural gas use by 20 to 25 percent, or about $260 per year.
or about $260 per year.
As evidence on the Energy Effi ciency Gap, such analyses again suffer from the As evidence on the Energy Effi ciency Gap, such analyses again suffer from the problems introduced in the previous section. First, there are potentially problems introduced in the previous section. First, there are potentially substan-tial unobserved costs and benefi ts (the
Weatherization takes time, and for most people it is not highly enjoyable: the process Weatherization takes time, and for most people it is not highly enjoyable: the process requires one or sometimes two home energy audits, a contractor appointment requires one or sometimes two home energy audits, a contractor appointment to carry out the work, and sometimes additional follow-up visits and paperwork. to carry out the work, and sometimes additional follow-up visits and paperwork. Some benefi ts are also diffi cult to quantify: for example, weatherization typically Some benefi ts are also diffi cult to quantify: for example, weatherization typically makes homes more comfortable and less drafty. Furthermore, weatherization makes homes more comfortable and less drafty. Furthermore, weatherization reduces the cost of energy services such as warmer indoor temperatures on a reduces the cost of energy services such as warmer indoor temperatures on a cold winter day, and this cost reduction causes people to increase their utilization cold winter day, and this cost reduction causes people to increase their utilization of these services. (In the energy literature, this is called the “rebound effect.”) of these services. (In the energy literature, this is called the “rebound effect.”) Measuring the change in energy use from weatherization without accounting for Measuring the change in energy use from weatherization without accounting for the utility gain from an increase in utilization of energy services understates the the utility gain from an increase in utilization of energy services understates the welfare benefi ts.
welfare benefi ts.
Second, the net present value of energy cost reductions is unknown. The Second, the net present value of energy cost reductions is unknown. The empirical estimates are based on short-term analyses, and the persistence of returns empirical estimates are based on short-term analyses, and the persistence of returns over many years is rarely assessed. If the $260 annual savings from Schweitzer (2005) over many years is rarely assessed. If the $260 annual savings from Schweitzer (2005) are assumed to have a lifetime of 10 years or less, then weatherization does not pay are assumed to have a lifetime of 10 years or less, then weatherization does not pay back the $2,600 cost at any positive discount rate. At lifetimes of 15 or 20 years, the back the $2,600 cost at any positive discount rate. At lifetimes of 15 or 20 years, the discount rate that equates future discounted benefi ts with current costs (the internal discount rate that equates future discounted benefi ts with current costs (the internal rate of return) is 5.6 or 7.8 percent, respectively. Furthermore, all of the estimates rate of return) is 5.6 or 7.8 percent, respectively. Furthermore, all of the estimates are nonexperimental, and households that weatherize may also engage in other are nonexperimental, and households that weatherize may also engage in other unobserved activities that affect energy use. This may be a larger concern with unobserved activities that affect energy use. This may be a larger concern with non-low-income weatherization programs, in which homeowners might be more likely to low-income weatherization programs, in which homeowners might be more likely to carry out renovations and energy effi ciency work at the same time.
carry out renovations and energy effi ciency work at the same time.
Third, the effects of weatherization on energy use are heterogeneous. For Third, the effects of weatherization on energy use are heterogeneous. For example, Metcalf and Hassett (1999) estimate the distribution of returns to attic example, Metcalf and Hassett (1999) estimate the distribution of returns to attic insulation in the U.S. population using a weather-adjusted difference estimator with insulation in the U.S. population using a weather-adjusted difference estimator with nationally representative panel data. The estimated median and mean returns on nationally representative panel data. The estimated median and mean returns on investment are on the order of 10 percent, and one-quarter of households had investment are on the order of 10 percent, and one-quarter of households had returns greater than 13.5 percent. This heterogeneity means that while estimates returns greater than 13.5 percent. This heterogeneity means that while estimates of average returns for adopters could in principle be meaningful in evaluating the of average returns for adopters could in principle be meaningful in evaluating the costs and benefi ts of an existing program, a simple selection model like the one costs and benefi ts of an existing program, a simple selection model like the one above would imply that the net returns for adopters overstate the net returns for above would imply that the net returns for adopters overstate the net returns for non-adopters. On net, the available evidence seems inconsistent with signifi cant non-adopters. On net, the available evidence seems inconsistent with signifi cant investment ineffi ciencies in the context of weatherization.
investment ineffi ciencies in the context of weatherization.
Cost Effectiveness of Energy Conservation Programs
Many electric utilities run “demand-side management” programs, which largely Many electric utilities run “demand-side management” programs, which largely consist of subsidies to households and fi rms to purchase energy effi cient appliances, consist of subsidies to households and fi rms to purchase energy effi cient appliances, air conditioning and heating systems, and other equipment. If these programs can air conditioning and heating systems, and other equipment. If these programs can reduce energy use at less than the cost of energy, the argument goes, then there were reduce energy use at less than the cost of energy, the argument goes, then there were investment ineffi ciencies, and the programs should be viewed as welfare-enhancing. investment ineffi ciencies, and the programs should be viewed as welfare-enhancing. The simplest example of this approach is to divide the annual spending on The simplest example of this approach is to divide the annual spending on these programs by estimates of electricity savings, as in Gillingham, Newell, and these programs by estimates of electricity savings, as in Gillingham, Newell, and Palmer (2006). For 2009, U.S. electric utilities reported $2.255 billion in direct Palmer (2006). For 2009, U.S. electric utilities reported $2.255 billion in direct costs and 76.9 terawatt-hours of savings for demand-side management programs, costs and 76.9 terawatt-hours of savings for demand-side management programs,