Procedia Computer Science 60 ( 2015 ) 1640 – 1648
1877-0509 © 2015 The Authors. Published by Elsevier B.V. This is an open access article under the CC BY-NC-ND license (http://creativecommons.org/licenses/by-nc-nd/4.0/).
Peer-review under responsibility of KES International doi: 10.1016/j.procs.2015.08.274
ScienceDirect
19th International Conference on Knowledge Based and Intelligent Information and Engineering
Systems
Segmentation of Clock Drawings Based on Spatial and Temporal
Features
Zainab Harbi
a,c*, Yulia Hicksa,Rossitza Setchi
a, Antony BayerbaCardiff School of Engineering, Queen’s Buildings, CF24 3AA, Cardiff, UK. bCardiff School of Medicine, Llandough Hospital, CF64 2XX, Cardiff, UK.
cComputer Science Department, Faculty of Education for Women, Kufa University, Najaf, Iraq.
Abstract
The Clock Drawing Test (CDT) is an inexpensive and effective measure for early detection of cognitive impairment in the elderly, which is important for timely diagnosis and initiation of appropriate treatment. Currently, medical experts assess the drawings based on their judgement and a number of available scoring systems. An automatic system for assessment of CDT drawings would simultaneously decrease the waiting time for a specialist appointment and improve accessibility of the test to the patients. Published research has only started to address the problem of automatic assessment of CDT drawings and existing systems require user intervention during the segmentation of the CDT drawing into its composing parts, such as numbers and clock hands. In this paper, a new set of temporal and spatial features automatically extracted from the CDT data acquired using a graphics tablet is proposed. Consequently, a Support Vector Machine (SVM) classifier is employed to segment the CDT drawings into their elements, such as numbers and clock hands, on the basis of the extracted features. The proposed algorithm is tested on two data sets, the first set consisting of 65 drawings made by healthy people, and the second consisting of 100 drawings reproduced from actual drawings of dementia patients. The test on both data sets shows that the proposed method outperforms the current state-of-the-art method for CDT drawing segmentation.
© 2015 The Authors. Published by Elsevier B.V. Peer-review under responsibility of KES International.
Keywords: Clock Drawing Test (CDT); cognitive impairment diagnosis; dementia; segmentation; dynamic features.
* Corresponding author. Tel.: +447941076932;
E-mail address: [email protected]
© 2015 The Authors. Published by Elsevier B.V. This is an open access article under the CC BY-NC-ND license (http://creativecommons.org/licenses/by-nc-nd/4.0/).
1. Introduction
The Clock Drawing Test (CDT) [1-2] is an inexpensive and effective measure for early detection of cognitive impairment in the elderly. Cognitive decline has been recognised as a transitory state between normal cognition and dementia [3] and thus its detection can contribute towards early diagnosis of dementia, which is necessary for the recognition of the elderly patient’s condition and arrangement of further treatment.
There are many ways to deliver the test, but its simplest form requires the patient to draw a clock, using paper and pen, and set the hands to a specific time. The completed drawings are then assessed by an expert following one of the existing scoring systems [4]. More recently, computerised systems for administering the CDT have been proposed [5, 6]. These systems are able to acquire additional dynamic data characterising the drawings, such as time-stamped sequence of the drawing pixels and pen inclination and pressure on the paper or tablet. In previous research, such data was shown to be significant when assessing the mental state of the patients [5-8]. However, the published research has only started to address the problem of automatic assessment of paper- or computer-based CDT drawings, which could be of real benefit to patients by eliminating the need for access to medical specialists.
Previous research [9] highlights the significance of CDT drawing features for detecting the patient’s cognitive
impairment, such as missing and repeated numbers, incorrect time setting and no hands. Handwriting recognition would be an essential part of the system for automatic CDT analysis. However, the handwriting of people with cognitive problems may not be clear, or may contain overlapping numbers and letters, and thus need special consideration in the analysis.
Handwriting segmentation is an operation that seeks to decompose an image consisting of a sequence of characters into a set of individual objects [10]. It is an important step in handwriting recognition as it directly influences recognition accuracy [11]. A drawing of a clock is a special case of handwriting, since it does not proceed in one direction, but changes direction arbitrarily. Thus the standard handwriting segmentation algorithms, which rely on the width and height of segment pattern and the horizontal gap between segments, would not be applicable to CDT drawings.
In this paper, the advantage of using dynamic CDT data acquired by a graphics tablet is used to improve the segmentation process and a set of temporal and spatial features extracted for this purpose from the data is proposed. Consequently, a Support Vector Machine (SVM) classifier is employed to segment the CDT drawings into their elements, such as numbers and clock hands, on the basis of the extracted dynamic features. We test the proposed algorithm on two data sets, the first set consisting of 65 drawings made by healthy people, and the second consisting of 100 drawings reproduced from actual drawings of dementia patients. The test on both data sets shows that the proposed method outperforms the current state-of-the-art for CDT drawing segmentation.
The rest of this paper is organised as follows. Section 2 presents the background and reviews the related work. Section 3 describes the proposed segmentation system. Section 4 outlines the data set and the experimental setup. Section 5 presents the results and discussion, and finally, Section 6 concludes the paper.
2. Related Work
Segmentation in handwriting can be generally classified as segmentation-recognition and recognition-based [12]. In the former, segmentation is performed separately before recognition, and the final result of the segmentation is the isolated characters. In the latter, segmentation and recognition happen simultaneously. This method produces good results, but is computationally expensive. Segmentation can be done both offline and online. In the offline approach, the completed writing is available as an image, and the information available to the segmentation algorithm involves analysing the image’s spatial characteristics. In the online case, the two-dimensional coordinates of the writing are stored in the order of strokes made by the writer as a function of time, so both the temporal and spatial information is available for the segmentation.
Recently, several state-of-the-art segmentation methods have been tested on a common database also used in [11, 12]. Eleven offline algorithms have been evaluated and some of them show high segmentation accuracy. Most of the algorithms use statistical information on spacing together with horizontal and vertical projection in order to segment the written document. These methods can work well with normal images, but would fail when applied to drawings of clocks. In clock drawings, the writing does not proceed from one side to another, but changes direction—
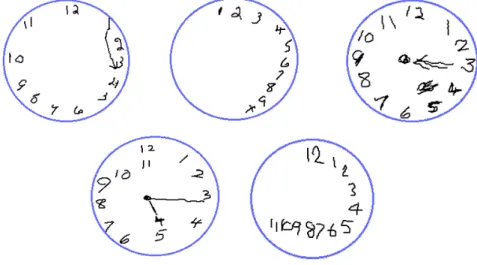
especially when the drawings are made by people with cognitive impairment. Fig. 1 shows examples of such images.
Fig. 1. Examples of clock drawings produced by people diagnosed with dementia.
Recently, the problem of automatic assessment of CDT drawings attracted a certain amount of attention in the research community. For example, Heinik et al. [7] measured the kinematics of the process, although they did not explore the area of segmentation and recognition. In another study, Kim et al. [5] employed a tablet for delivery and analysis of CDT drawings. They used a connected component algorithm to segment the clock elements. The connected component algorithm [13] has been widely used in image segmentation; it segments binary images by detection of connected components between pixels. This method has some limitations in the segmentation of clock drawings. For example, when elements are connected, as in the first clock in Fig. 1 where the number 3 is connected to the clock hand, it will lead to an under-segmentation error (i.e. when the segmented object contains more than one character). In case when a number consists of two fragments (as the number 4 in the first clock in Fig. 1), it will lead to an over-segmentation error (when the segmented object is not a complete character). In [14], one proposed solution to the problem of fragmented characters uses vertical blurring of the original images before segmentation. However, this solution is limited to short gaps (no more than two pixels), which is impractical in clock drawings, where people with cognitive impairments may leave a large gap between character’s parts.
In the recent Think project [6], a digitised pen was used to record CDT drawings, with special software developed for analysis. The clock drawings were segmented by first separating the clock hands from the numbers on the basis of their position near the centre of the clock, and then applying the k-means algorithm to cluster the remaining elements into 12 groups using the time when they were drawn and the distance from the centre. The proposed method works well with clock drawings produced by people with no cognitive impairment. However, as reported by the authors, in drawings of people with cognitive impairments, user assistance was required to achieve accurate segmentation results.
The supervised classification algorithms such as SVM have been used successfully in segmentation [15-18]. In [15], SVM with a set of geometrical features has been used to classify inter and intra word gaps in the segmentation of handwritten text. SVM has also been used to successfully segment the online overlaid handwriting [16]. High segmentation accuracy has been reported in online Japanese handwriting segmentation in [17, 18] using a set of spatial and temporal stroke based features.
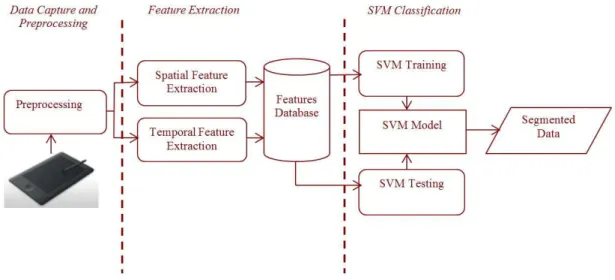
Fig. 2. Proposed segmentation system. 3. Proposed Segmentation System
The proposed segmentation system (Fig. 2) consists of three parts: 1) data capture and pre-processing; 2) feature extraction; and 3) classification. In the first part, a digitiser is used to collect the clock drawing data from the participant. The data is then pre-processed to remove irrelevant information. The next step is feature extraction, wherein a set of proposed temporal and spatial features is extracted for each stroke. A stroke is defined as a sequence of points starting from the point where the pen touches the paper to the point where it is lifted from the paper. Whenever a ‘pen-off’ (i.e. the pen lifts between strokes) is detected, the last stroke is treated as a new candidate segment. Lastly, using these extracted features, each stroke is judged by a two-class classifier (SVM with a linear kernel) to decide whether it is a new segment or not. In the following subsections, the components of the segmentation system are explained in detail.
3.1. Data Capture and Preprocessing
The data is captured using a WACOM Intuos Pro digitizing tablet [19], which has a wireless electronic inking pen and a recording area of approximately 32.5 cm by 20.3 cm. The pen has a pressure-sensitive tip, and its shape and size are similar to regular pens, offering an experience that is no different from the normal paper and pen test.
The participant is given an electronic inking pen and asked to draw a clock on A4 paper affixed to the surface of the digitiser. The clock circle is pre-drawn on the paper, so the participant has to add only the numbers and the hands. The clock hands have to display a specific time, which is five minutes to three. The test instruction and time setting are the same as used in the clinic during the assessment process.
As the participant writes on the tablet’s surface, the tablet’s digitiser reports the sequence of time-stamped coordinate pairs (x, y) as well as information about pen pressure and tilt. This information is transferred directly via wireless connection to the computer. The pen-down and pen-up signals are used to determine where a stroke starts and ends, with the overall handwriting data represented as a sequence of strokes. The collected data is stored on the computer and analysis is performed offline.
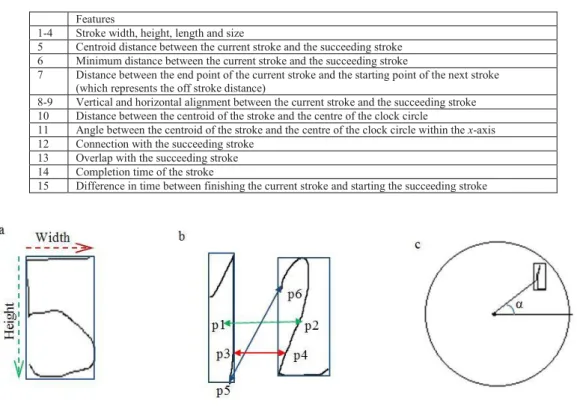
Table 1. List of stroke features. Features
1-4 Stroke width, height, length and size
5 Centroid distance between the current stroke and the succeeding stroke 6 Minimum distance between the current stroke and the succeeding stroke
7 Distance between the end point of the current stroke and the starting point of the next stroke (which represents the off stroke distance)
8-9 Vertical and horizontal alignment between the current stroke and the succeeding stroke 10 Distance between the centroid of the stroke and the centre of the clock circle
11 Angle between the centroid of the stroke and the centre of the clock circle within the x-axis 12 Connection with the succeeding stroke
13 Overlap with thesucceeding stroke 14 Completion time of the stroke
15 Difference in time between finishing the current stroke and starting the succeeding stroke
Fig. 3. (a) Width and height of stroke; (b) Distances between strokes: (p1-p2) centroid, (p3-p4) minimum, and (p5-p6) end to start distance; (c) Angle between the stroke and the centre.
3.2. Feature Extraction
As the clock is being drawn, digitised data is captured as a temporal sequence of strokes. Let us represent this set of strokes as S. Then S = {S1, S2, ࣭࣭࣭, Sn}, where n represents the number of strokes in the data set, and Si= {p1,
p2, ࣭ ࣭ ࣭, pm}, where m represents the number of points in the stroke. For each stroke Si in the data set, the
system extracts 15 spatial and temporal feature (Table 1). The stroke width and height represent the width and height of the bounding box surrounding the stroke (as shown in Fig. 3 (a)). Stroke length (Si_len) represents the total
path length of the pen trajectory from the start point of the stroke until the last one, which can be calculated using the following equation:
̴݈ܵ݁݊ ൌ σୀଵ݀݅ݏݐሺǡ ାଵሻ (1)
where m is the number of points in the stroke, and i and dist represent the Euclidean distance between each point and its successor. Such distances in a correctly segmented character have relatively small values. Using this property, three complementing measurements of the Euclidean distance between strokes are defined: centroid distance, minimum distance, and the end-to-start point distance (i.e. the distance between the end point of the previous stroke and the start point of the current stroke). The centroid distance can be measured as the distance between the centre of the bounding box of the current stroke and the centre of the bounding box of the succeeding stroke (i.e. the stroke that follows the current stroke in time). The minimum distance can be calculated by measuring the shortest distance between the current stroke and the next one in the sequence. End-to-start distance represents the distance of the off stroke, i.e. the pen’s lift distance between strokes. Fig. 3 (b) illustrates these distance measurements.
Clock drawings are considered to be similar to unconstrained writing, with the writer being able to write in any direction. Thus the horizontal alignment feature, which has been used successfully in standard handwriting segmentation, is not sufficient. Our system includes a vertical alignment feature. Horizontal alignment between successive strokes is measured as the difference in the x-axis coordinate of the right point of the bounding box of the first stroke and the left point of the bounding box of the second stroke, while the vertical alignment is the difference in the y-axis between them.
Other important features in clock drawing segmentation are the distance between a stroke and the centre of the clock, and the angle between the stroke and the centre of the clock (Fig. 3 (c)). The strokes, which have close values of these features and are consecutive in time are likely to belong to the same character.
All spatial features are normalised with respect to average character size to overcome the problem of different character sizes among different writers, which may affect the classifier operation. However, it is advisable to retain the character size information for further cognitive assessment, since the letter size may be indicative of cognitive impairment. The average character size is estimated by measuring the length of the longer side of the bounding box for each stroke, sorting the lengths of the strokes in descending order (excluding the two clock hands), and finding the average of the first half of the sorted strokes.
The temporal information provided by the graphics tablet in the proposed segmentation system is also taken into account and appropriate features are extracted. For example, the ordering of the strokes in the sequence is considered important in character segmentation as well as in handwriting recognition [17]. The time taken to finish the stroke and the time between strokes are also important for the segmentation process (Table 1).
3.3.SVM Classification
SVM [20] has been widely used in recent years as an alternative to other popular classification methods such as neural networks, with good results shown in various applications. SVM has also been used successfully in handwriting segmentation [16-18], thus making it a good choice of a classifier in this research. For evaluating the performance of the proposed system the data has been divided into training and testing sets using 5-fold cross validation.
4. Data Collection and Experimental Setup
The proposed system has been tested on two data sets: the first consists of 65 drawings made by healthy people, and the second consists of 100 drawings reproduced from the authentic drawings of dementia patients.
4.1.Data Set 1
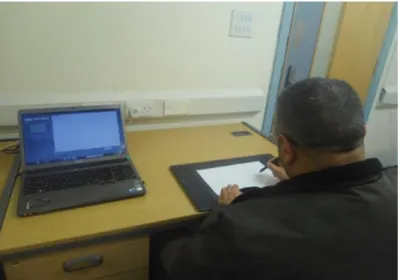
During data collection, 65 volunteers aged between 25 and 87 years participated. The group included 15 individuals who were older than 60. The participants included 32 females and 33 males, and their educational attainments ranged between basic and college graduate. The participants were asked to draw a clock on a paper laid on the surface of the digitiser as shown in Fig. 4. Each person drew one clock, so 65 clock images were collected. These drawings will be referenced as normal drawings in the next sections.
4.2.Data Set 2
The second data set came from dementia patients’ drawings. Because of the difficulty in obtaining data from cognitive impairment patients using a digitiser as described in section 3.1, 100 drawings were reproduced by an authorised person onto the digitiser from the original drawings of dementia patients. These patients were diagnosed with dementia during their examination at Llandough Hospital in Cardiff UK. More than 100 drawings of different types of dementia were obtained: 37 drawings were reproduced from the drawings of patients diagnosed with mild cognitive impairment, 55 came from Alzheimer’s patients, and 8 drawings were from vascular dementia patients. These drawings are referred to in the next sections as abnormal drawings.
Fig. 4. Data collection using a Wacom digitiser tablet 4.3.Experimental Setup
The data was collected using software developed by the authors to interface the digitiser with the computer system. Feature extraction and classification was implemented using the Matlab language. The dataset was divided into training and testing sets using the 5-fold cross-validation method, four part used for training and one for testing. All the features listed in Table 1 were used, with the exception of completion time and time between writing. These features were excluded because they showed no effect on the result: time of writing depends on the writer’s
speed, which varies between individuals. The drawings were converted into two sets of strokes which were classified as described in Section 3.
5. Results and Discussion
The performance of the proposed segmentation system was evaluated in both normal and abnormal drawings. In order to compare the proposed methods with other methods, the connected component algorithm [13] was employed on the two data sets. This method has been used before in [5] for the clock drawing segmentation problem. The results show that there is a significant improvement when using the proposed strategy, in comparison with the connected component algorithm. Table 2 shows the average of ten segmentation test results. The proposed system achieved 99.5% segmentation accuracy for the normal drawing data set and 96.1% for the abnormal ones. More than 4% improvement in segmentation accuracy was reported in both normal and abnormal cases.
Table 2. Segmentation accuracy of normal and abnormal drawings. Connected Component Segmentation Accuracy SVM Segmentation Accuracy Normal 95.6% 99.5% Abnormal 92.27% 96.1%
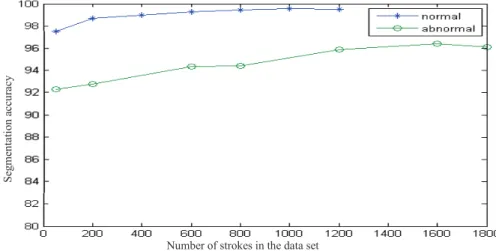
Fig. 5. Segmentation accuracy versus size of the data set for both normal and abnormal drawings.
Fig. 6. (a) Original image; (b) Segmentation using a connected component algorithm; (c) Segmentation using the proposed algorithm. An experiment for training and testing the classifier with a different data set size was conducted to examine the effect of the data set size on classification accuracy. 1200 strokes were obtained from 65 normal drawings and 1800 strokes from 100 abnormal ones. The higher SVM classifier accuracy can be achieved by increasing numbers of strokes, as shown in Fig. 5.
Two examples of segmented data produced by the connected component algorithm and the proposed method are illustrated in Fig. 6. In these drawings each square represents a segmented object. The connected component algorithm failed to detect all segments properly, as can be seen in Fig. 6 (b). For instance, the second part of the number ‘11’ is connected to the hand arrow. Another example of incorrect segmentation is where the hand and arrows are not connected. The same problem has been detected in the second example of Fig. 6 (b), where the number ‘5’ is broken into two parts.
These problems can be solved by the proposed system as shown in Fig. 6 (c). These drawings are segmented correctly, because other features such as the sequence of writing, the size of the stroke, and the distance between strokes have been considered by the classifier. Analysis of segmentation error produced by the proposed system
Segm en ta ti on ac cu ra cy
shows that most segmentation errors are related to clock hand detection, something a future work should consider in order to achieve a higher accuracy.
6. Conclusion and Future Work.
A new approach for character segmentation in CDT drawings has been proposed in this paper. Conventional handwriting segmentation methods cannot be used in the case of clock drawings where the writing does not follow a standard format of direction and spacing. Current algorithms that rely on the width and height of segmented patterns and horizontal gaps between segments are not applicable to CDT drawings, especially those made by dementia patients. By using SVM as a classifier with a combination of temporal and spatial features, the proposed method has achieved a high segmentation accuracy of 99.5% for normal drawings and 96.1% for abnormal drawings. The system shows promising results, even for abnormal drawings. The segmentation process is the first step towards handwriting recognition. Future work will explore the application of handwriting recognition methods to CDT drawings with the aim of automating the CDT for assessment of patients with suspected dementia.
Acknowledgement
The authors would like to gratefully acknowledge the Establishment of Martyrs, Republic of Iraq-Presidency Ministers for their sponsorship.
References
[1] Juby A, Tench S, Baker V. The value of clock drawing in identifying executive cognitive dysfunction in people with a normal mini-mental state examination score. Canadian Medical Association Journal 2002; 167:859-64.
[2] Mittal C, Gorthi S, Rohatgi S. Early cognitive impairment: role of clock drawing test. Medical Journal Armed Forces India 2010; 6625-8. [3] Petersen RC, Stevens JC, Ganguli M, Tangalos EG, Cumming J L, DeKosky ST. Early detection of dementia: mild cognitive impairment
(an evidence-based review). Report of the Quality Standards Subcommittee of the American Academy of Neurology 2001; 56:1133-42. [4] Pinto E, Peters R. Literature review of the Clock Drawing Test as a tool for cognitive screening. Dementia and Geriatric Cognitive Disorders
2009; 27:201-13.
[5] Kim H, Cho YS, Do EYL. Computational clock drawing analysis for cognitive impairment screening. Proceedings of the Fifth International Conference on Tangible, Embedded, and Embodied Interaction 2011; 297-300.
[6] Davis R, Libon DJ, Au R, Pitman D, Penney DL. Think: Inferring cognitive status from subtle behaviours. In: Twenty-Sixth IAAI Conference 2014; 2898-905.
[7] Heinik J, Werner P, Dekel T, Gurevitz I, Rosenblum S. Computerized kinematic analysis of the clock drawing task in elderly people with mild major depressive disorder: an exploratory study. International Psychogeriatric 2010; 22:479-88.
[8] Rosenblum S, Samuel M, Zlotnik S, Erikh I, Schlesinger I. Handwriting as an objective tool for Parkinson’s disease diagnosis. Journal of Neurology 2013; 260:2357-61.
[9] Lessig M, Scanlan J, Nazme H, Borson S. Time that tells: critical clock-drawings errors for dementia screening. International Psychogeriatric 2008; 20:459-70.
[10] Casey R, Lecolinet E. A survey of methods and strategies in character segmentation. IEEE Trans. PAMI 1996; 18: 690-706.
[11] Stamatopoulo N, Gatos B, Louloudis G. Pal U, Alaei A. Icdar 2013 handwriting segmentation contest. 12th International Conference on Document Analysis and Recognition 2013; 1402-6.
[12] Ribas FC, Oliveira LS, Britto AS, Sabourin JrR. Handwritten digit segmentation: a comparative study. International Journal on Document Analysis and Recognition 2013; 127-37.
[13] Gonzalez R, Woods R, Eddins S. Digital Image Processing Using MATLAB. 2nd Ed. Gatesmark Publishing; 2009.
[14] Shi Z, Srhari SN, Shin YC, Ramanaprasad V. A system for segmentation and recognition of totally unconstrained handwriting numeral strings. International Conference on Document Analysis and Recognition 1997; 455-8.
[15] Sun Y, Timothy SB, Shafarenko A, Adams R, Loomes M, Davey N. Segmenting handwritten text using supervised classification techniques, Proceding Of IEEE International Joint Conference on Neural Networks 2004; 657-62.
[16] Lv YF, Huang LL, Wang DH, and Liu CL. Learning-based candidate segmentation scoring for real-time recognition of online overlaid Chinese handwriting. In 12th International Conference on Document Analysis and Recognition 2013; 74-8.
[17] Furukawa N, Tokuno J, Ikeda H. Online character segmentation method for unconstrained handwriting strings using off-stroke features. Proceedings of the 10th International Workshop on Frontiers in Handwriting Recognition 2006; 361-6.
[18] Zhu B, Nakagawa M. Segmentation of on-line freely written Japanese text using SVM for improving text recognition. IEICE Transactions 91-D(1) 2008; 105-13.
[19] Wacom. http://www.wacom-europe.com.