AN EVALUATION OF THE USE OF COMBINATION
TECHNIQUES IN IMPROVING FORECASTING ACCURACY
FOR COMMERCIAL PROPERTY CYCLES IN THE UK
Arvydas Jadevicius
A thesis submitted in partial fulfilment of the requirements of Edinburgh Napier University for the Degree of Doctor of Philosophy
September 2014
This copy of the thesis has been supplied on condition that anyone who consults it is understood to recognise that the copyright rests with its author. No quotation from the thesis and no information derived from it may be published without the prior written consent of the author or the University (as may be appropriate).
Abstract
In light of the financial and property crisis of 2007-2013 it is difficult to ignore the existence of cycles in the general business sector, as well as in building and property. Moreover, this issue has grown to have significant importance in the UK, as the UK property market has been characterized by boom and bust cycles with a negative impact on the overall UK economy. Hence, an understanding of property cycles can be a determinant of success for anyone working in the property industry.
This thesis reviews chronological research on the subject, which stretches over a century, characterises the major publications and commentary on the subject, and discusses their major implications. Subsequently, this thesis investigates property forecasting accuracy and its improvement. As the research suggests, commercial property market modelling and forecasting has been the subject of a number of studies. As a result, it led to the development of various forecasting models ranging from simple Single Exponential Smoothing specifications to more complex Econometric with stationary data techniques.
However, as the findings suggest, despite these advancements in commercial property cycle modelling and forecasting, there still remains a degree of inaccuracy between model outputs and actual property market performance. The research therefore presents the principle of Combination Forecasting as a technique helping to achieve greater predictive outcomes. The research subsequently assesses whether combination forecasts from different forecasting techniques are better than single model outputs. It examines which of them - combination or single forecast - fits the UK commercial property market better, and which of these options forecasts best. As the results of the study suggest, Combination Forecasting, and Regression (OLS) based Combination Forecasting in particular, is useful for improving forecasting accuracy of commercial property cycles in the UK.
Declaration
The thesis is submitted to Edinburgh Napier University for the Degree of Doctor of Philosophy. The work described in this thesis was carried out under the supervision of Professor Brian Sloan and Dr. Andrew Brown. The work was undertaken in the School of Engineering and the Built Environment.
In accordance with the regulations of Edinburgh Napier University governing the requirement for the Degree of Doctor of Philosophy, the candidate submits that the work presented in this thesis is original unless otherwise referenced within the text.
The following published papers were derived from the work in this thesis. As set of papers is bound where possible with the thesis and may be found inside the back cover. Full permission from the relevant publishers or copyright holders has been obtained. The numbering sequence makes no attempt to follow that of the thesis proper, the pagination follows that of the parent journal or proceeding as appropriate.
1. Jadevicius, A, Sloan, B and Brown, A (2010) Is 100 years of research on property cycles enough to predict the future of UK property market performance with accuracy? In: Egbu, C. (Ed) Procs 26th Annual ARCOM Conference, 6-8 September 2010, Leeds, UK, Association of Researchers in Construction Management, pp.111-120.
2. Jadevicius, A., Sloan, B. and Brown, A. (2010) A Century of Research on Property Cycles - A Review of Research on Major and Auxiliary Business Cycles. In: XI BSV International Conference on Valuation and Investment, Minsk, Belarus, pp.17.
3. Jadevicius, A., Sloan, B. and Brown, A. (2010) A Century of Research on Property Cycles - A Literature Review and Annotated Bibliography. In: XI BSV International Conference on Valuation and Investment, Minsk, Belarus, pp.17.
4. Jadevicius, A., Sloan, B. and Brown, A. (2012) Examination of property forecasting models - accuracy and its improvement through
combination forecasting. In: 19th Annual Conference of the European Real Estate Society (ERES), Edinburgh, UK, pp.20.
5. Jadevicius, A., Sloan, B. and Brown, A. (2012) Development of a SESMA model for short-term investment decision-making. In: 4th Annual Conference of the Global Chinese Real Estate Congress (GCREC), Macau S.A.R., China, pp.11.
6. Jadevicius, A., Sloan, B. and Brown, A. (2013) Property market modelling and forecasting: a case for simplicity. In: 20th Annual Conference of the European Real Estate Society (ERES), Vienna, Austria, pp.11.
7. Jadevicius, A., Sloan, B. and Brown, A. (2013) Property market modelling and forecasting: a case for simplicity. In: Journal of Business Research (JBR), pp.35 (Submitted).
Table of Contents
List of tables ... vi
List of figures ... vii
Abbreviations ... ix
Glossary of property and financial terms ... xi
Acknowledgements ... xiii
CHAPTER 1 INTRODUCTION ... 1
1.1 Background for the research ... 1
1.2 Aims and objectives of the research ... 3
1.3 Methodological considerations ... 5
1.4 Outline of the thesis ... 6
CHAPTER 2 LITERATURE REVIEW ... 8
2.1 Property and business cycles... 10
2.1.1 Property market (in)efficiency ... 10
2.1.2 Characterisation of the business and property cycle ... 12
2.1.3 Understanding of the property cycle ... 16
2.2 Property market modelling and forecasting ... 42
2.2.1 Classification of real estate models ... 43
2.2.2 Accuracy of property forecasting models ... 52
2.3 Summary ... 60
CHAPTER 3 RESEARCH DESIGN AND METHODOLOGY ... 64
3.1 Difficulty in choosing an appropriate forecasting method ... 65
3.2 Accuracy improvement through Combination Forecasting ... 70
3.2.1 The principle of Combination Forecasting ... 70
3.3 Model implementation ... 79
3.3.1 Modelling process using PASW (SPSS) 18 ... 79
3.3.2 Difficulties working with spread-sheets ... 81
3.4 Formulation of real estate models ... 83
3.4.1 Single Exponential Smoothing model ... 83
3.4.2 Brown’s Linear Trend model ... 83
3.4.3 Holt’s Linear Trend model... 84
3.4.4 ARIMA model ... 84
3.4.5 ARIMAX model ... 87
3.4.6 Simple Regression model ... 87
3.4.7 Multiple Regression model ... 88
3.4.8 Vector Autoregression model ... 90
3.4.9 Combination Forecasting ... 91
3.4.10 Further steps in formulating a real estate models ... 92
3.5 Summary ... 100
CHAPTER 4 DATA AND ITS ACQUISITION ... 104
4.1 The importance of historic data ... 105
4.2 The UK property data ... 107
4.3 Annual Chain-Linking ... 111
4.4 Method of selecting variables ... 113
4.4.1 The dependent variable ... 113
4.4.2 Explanatory variables ... 119
4.4.3 Variable reduction ... 153
4.5 Summary ... 160
5.1 In-sample forecasting estimates ... 164
5.1.1 Exponential Smoothing model estimates ... 164
5.1.2 ARIMA/ARIMAX model estimates ... 165
5.1.3 Simple Regression model estimates ... 170
5.1.4 Multiple Regression model estimates ... 172
5.1.5 Vector Autoregression model estimates ... 174
5.2 Out-of-sample forecasting estimates ... 177
5.3 Combination Forecasting estimates ... 180
5.4 Overall forecasting accuracy ... 183
5.5 Overall Combination Forecasting accuracy ... 188
5.6 Summary ... 190
CHAPTER 6 CONCLUSIONS ... 192
6.1 Summary of the main findings ... 193
6.2 Limitations of the research ... 199
6.3 Implications for property market participants ... 200
6.4 Further related work ... 202
REFERENCES AND BIBLIOGRAPHY ... 204
APPENDIX A. Time-series used for the research ... 237
APPENDIX B. Model estimates ... 245
B.1 In-sample ... 245
B.2 Out-of-sample... 275
B.3 SA Combination Foresting ... 277
List of tables
Tables are numbered according to Chapter they correspond. There are no tables in Chapter 1.
Chapter 2:
Table 2.1. Key ‘Early era’ publications on property cycles ... 20
Table 2.2. Key post-war publications on property cycles ... 24
Table 2.3. Key post-1970s crash publications on property cycles ... 30
Table 2.4. Key post-1990s crash publications on property cycles ... 36
Table 2.5. Key ‘modern’ publications on property cycles ... 41
There are no tables in Chapter 3. Chapter 4: Table 4.1 Time-series employed to model commercial property rents ... 122
Table 4.2The summary table of variable importance ... 155
Table 4.3 OLS estimation results for AR(p) model in testing for a unit-root .. 157
Table 4.4 Cross correlation and persistence estimates for HP cycles ... 158
Chapter 5: Table 5.1 SES, HLT and BLT model fit statistics ... 164
Table 5.2 ARIMA model fit statistics ... 166
Table 5.3 ARIMAX model fit statistic ... 168
Table 5.4 AICc estimates for ARIMAX models ... 169
Table 5.5 Simple Regression model fit statistics ... 170
Table 5.6 Regression estimates for MR equation ... 173
Table 5.7 Estimates from VAR (p) specification ... 176
Table 5.8Summary model fit statistics ... 177
Table 5.9 Theil’s U statistics for SA and OLS Combination Forecasts ... 182 There are no tables in Chapter 6 and Chapter 7.
List of figures
Figures are numbered according to Chapter they correspond. There are no figures in Chapter 1.
Chapter 2:
Figure 2.1 Schematic diagram of recurrent fluctuations in economic activity . 14
Figure 2.2 Property cycle phase nomenclature ... 14
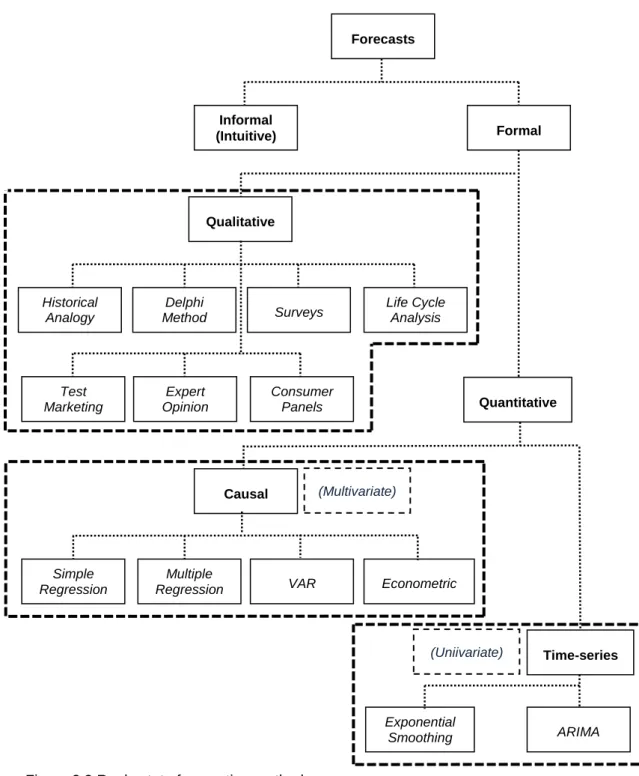
Figure 2.3 Real estate forecasting methods ... 46
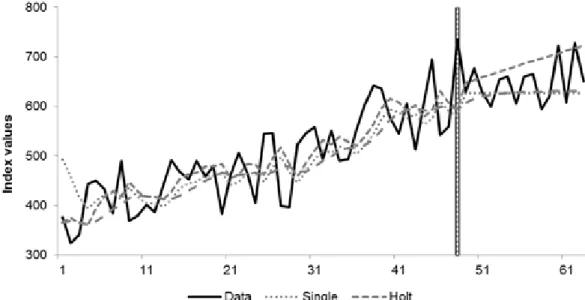
Chapter 3: Figure 3.1 Model fit and forecasts for SES, HLT and DS models ... 67
Chapter 4: Figure 4.1 Chain-linked UK All Property Rent Index ... 116
Figure 4.2 Chain-linked UK All Property Rent Index (1st.dif) ... 116
Figure 4.3 Chain-linked UK All Property Rent Index and HP Trend ... 118
Figure 4.4 The HP Cycle for Chain-linked UK All Property Rent Index ... 119
Figure 4.5 Liesner’s and BOE’s Annual Average Rate of Discount ... 123
Figure 4.6 Chain-linked Annual Average Rate of Discount ... 124
Figure 4.7 ONS’ and Holmans’ (2005) Construction Costs series ... 127
Figure 4.8 Chain-linked Construction Costs series ... 128
Figure 4.9 The CML’s and DCLG’s House Building Starts series ... 129
Figure 4.10 Chain-linked House Building Starts series ... 129
Figure 4.11 Liesner’s (1989) and ONS’ Service Sector Employment series 132 Figure 4.12 Chain-linked Total Service Sector Employment series ... 132
Figure 4.13 FTSE All Share Index Growth series ... 135
Figure 4.14 Chain-linked FTSE All Share Index Growth series ... 135
Figure 4.15 ONS’ and Mitchell’ (1992) Narrow Money Supply (M0) series .. 138
Figure 4.16 Chain-linked Narrow Money Supply (M0) series ... 139
Figure 4.17 ONS’ and HMRCs Number of Property Transactions series ... 140
Figure 4.18 Chain-linked Number of Property Transactions series ... 140
Figure 4.19 ONS’ and Liesner’s (1989) UK Unemployment series ... 143
Figure 4.21 ONS’ and BOE’s 20-year BGS yield series ... 144
Figure 4.22 Chain-linked 20-year BGS yield series ... 145
Figure 4.23 ONS’ and World Bank Capital Formation series ... 147
Figure 4.24 Chain-linked Capital Formation series ... 147
Figure 4.25 Holmans’ and Communities’ UK Land Value Index series ... 149
Figure 4.26 Chain-linked UK Land Value Index series ... 150
Figure 4.27 Scott’s (1996) and IPD’s All Property Total Returns series ... 153
Figure 4.28 Chain-linked All Property Total Returns series ... 153
Figure 4.29 Cross-correlation of HP cycles for Rent Index and C.Orders .... 159
Figure 4.30 Cross-correlation of HP cycles for Rent Index and GDP ... 159
Chapter 5: Figure 5.1 Single exponential smoothing (model fit) ... 164
Figure 5.2 Holt’s Linear Trend (model fit) ... 165
Figure 5.3 Brown’s Linear Trend (model fit) ... 165
Figure 5.4 ARIMA (1,2) (model fit) ... 167
Figure 5.5 ARIMAX (4,0,0) GDP (model fit) ... 168
Figure 5.6 Simple Regression (Construction Orders) (model fit) ... 172
Figure 5.7 Multiple Regression (model fit) ... 174
Figure 5.8 Vector Autoregression (model fit) ... 175
Figure 5.9 ARIMAX (1,0,2) Construction Orders (fit and accuracy) ... 178 Figure 5.10 ARIMAXCOr and SRCCs OLS Combination (fit and accuracy) 180 There are no figures in Chapter 6 and Chapter 7.
Abbreviations
ACF Autocorrelation Function AIC Akaike Information Criterion AR(p) Autoregressive (model)
ARIMA Autoregressive Integrated Moving Average (model)
ARIMAX Integrated Autoregressive Moving Average model with Exogenous Explanatory Variable(s) (model)
BGS British Government Securities BIC Bayesian Information Criterion BLT Brown’s Linear Trend (model)
BoE Bank of England
BR Bank Rate
CBHP CB Hiller Parker CBRE CB Richard Ellis CCs Construction Costs COr Construction Orders COt Construction Output CSt Construction Starts
DES Double Exponential Smoothing DW Durbin-Watson (statistics)
E Employment
ES Exponential Smoothing (model)
ESRC Economic and Social Research Council GDP Gross Domestic Product
GFD Global Financial Data GNP Gross National Product HLT Holt’s Linear Trend
HMRC Her Majesty's Revenue and Customs HP Hodrick-Prescott (filter)
HW Holt-Winters (statistics)
IPF Investment Property Forum JLL Jones Lang LaSalle
JLW Jones, Lang & Wootton
LCES London & Cambridge Economic Services
LSE London Stock Exchange
MA Moving Average
MAE Mean Absolute Error
MAPE Mean Absolute Percentage Error
ME Mean Error
MFE Mean Forecasting Error MPE Mean Percentage Error MR Multiple Regression
MSE Mean Squared Error
MSFE Mean Square Forecasting Error MSPE Mean Squared Percentage Error
NBER National Bureau of Economic Research ODPM Office of the Deputy Prime Minister
OECD Organisation for Economic Co-operation and Development OLS Ordinary Least Squares
ONS Office for National Statistics PACF Partial Autocorrelation Function PASW Predictive Analytics Software
RICS Royal Institution of Chartered Surveyors
RM Regression Model
RSS Residual Sum of Squares
SES Single Exponential Smoothing (model) SPSS Statistical Package for the Social Sciences SR Simple Regression (model)
UK United Kingdom
US United States of America VAR Vector Autoregressive (model)
Glossary of property and financial terms
1Absorption Total demand for goods and services by all residents (consumers, producers, and government) of a country (as opposed to total demand for that country’s output). Autocorrelation The state of an econometric relation such that some or
all of the explanatory variables are highly correlated with each other; poor specification of the relationship between variables in the regression equation is often the cause.
Average A value showing the central tendency of a set of data and often used to compare that set with others.
Base rate The rate of interest that a UK clearing bank uses as the basis of its structure of interest rates for lending and receiving deposits; lending rates are above, and rates on deposits below, base rate.
Boom A period of expansion of business activity.
Business cycle Recurrent but non-periodic fluctuations in aggregate economic activity as measured by fluctuations in real GDP about its trend.
Capital
consumption (M2)
Depreciation; given that fixed assets have only limited life-span, it is necessary to add to the annual costs of an enterprise or a national economy an estimate of the amount nationally spent on the wear and tear of such assets.
Depression A prolonged and severe slowing-down of economic activity exemplified by mass unemployment and a level of national income well below its potential level; more severe and long-lasting that recession.
Finance The provision of money at the time it is needed.
Institutional investor
A group of investors who have funds to invest as a consequence of the conduct of their business; the group includes insurance companies, banks and investment trusts, and industrial companies who administer their own pension schemes or have other funds available.
Investment yield Annual rent that is passing as a percentage of the capital value.
Macro-economics
A branch of economics concerned with analysis of the economy in the large, i.e. with such large aggregates as the volume of employment, saving and investment, the national income, and so on.
Market risk Risk that results from trends in market prices and which cannot be avoided by diversification.
Micro-economics A branch of economics concerned with analysis of the behaviour of individual consumer and producers, particularly with the optimistic behaviour of individual units such as households and firms.
Property cycle Recurrent but irregular fluctuations in the rate of all-property total return, which are also apparent in many other indicators of property activity, but with varying leads and lags against the all-property cycle.
Recession A significant reduction in employment and production, trade and investment; two consecutive quarters of decline in GDP.
Acknowledgements
The author would like to use this opportunity to express his gratitude to Professor Brian Sloan and Dr. Andrew Brown, his Research Supervisors, for their patient guidance, enthusiastic encouragement, stimulating suggestions, and useful critiques of this research work. Funding for the project was provided by Edinburgh Napier University. The author would also like to thank Dr. Michael Smyth, Faculty Research Training Co-Ordinator, for the financial support towards tuition fees for Econometrics Summer School at the University of Cambridge. His grateful thanks are also extended to Sheila Sutherland, Fundraising Administrator at International, Development & External Affairs (IDEA), for funding towards Global Chinese Real Estate Congress. Finally, he wishes to thank his wife for her support and encouragement throughout the study. To her, this thesis is dedicated.
CHAPTER 1
INTRODUCTION
1.1
Background for the research
In light of the financial and property crisis of 2007-2013 it is difficult to ignore the existence of cycles in the general business sector, as well as in building and property. Moreover, this issue has grown to have significant importance in the UK, as the UK property market has been characterised by boom and bust cycles with a negative impact on the overall British economy. As a result, economists and scholars started researching this phenomenon in the belief that a better understanding of the cyclical nature of the economy and the property market would prevent cycles from happening in the future.
The nature, development, and reasons behind property cycles have been researched for a number of years (Hakfoort, 1992; RICS, 1993). As Rottke and Wernecke (2002, p.3) observed, ‘in the US research on property cycles began as early as the 1930s...The number of publications rose rapidly at the beginning of the 1980s…Up to now in the US and the UK, cycle research papers have increased enormously both in terms of quantity and quality’. According to Barras (2009), the situation changed particularly after the Great Depression when academics and professionals became determined to find ways to prevent the recurrence of such dramatic events in the future. Therefore, they began to focus their attention on investment in building, as the most volatile element of the aggregate economic activity.
The subsequent developments in the field of property cycles research led to the construction of various mathematical models helping to explain the behaviour of the real property market (McDonald, 2002; Tonelli et al., 2004; Barras, 2009; Byrne et al., 2010). As a result, significant progress has been made within property market modelling and analysis (McDonald, 2002) resulting in the development of various forecasting models, ranging from simple single-equation methods to more advanced multi-equation
with stationary data techniques (Tsolacos, 2006; Lizieri, 2009b). The introduction of computer technology further accelerated the modelling process (Ball et al., 1998; Barras, 2009). It therefore led some researchers to propose that the commercial property market movements are predictable (Wheaton et al., 1997; Pyhrr et al., 1999; Barras, 2009).
However, comparative studies, where authors assessed the accuracy of already produced forecasts with actual property market dynamics, suggest that despite these advancements, there still are inaccuracies within property market modelling and forecasting. Various factors were identified why models differ from actual property market performance. These were market uncertainty, object being forecasted, forecasting technique used, forecasting horizon, and data being employed (Newell et al., 2002; Tonelli
et al., 2004; McAllister and Kennedy, 2007; IPF, 2012). Accordingly, it was suggested that greater forecasting performance could be achieved if any or all these forecasting inaccuracy causes are addressed.
1.2
Aims and objectives of the research
This research project aims to improve the forecasting accuracy of UK commercial property cycles. It therefore adopts the principle of Combination Forecasting as a means of improving overall modelling and forecasting accuracy. Researchers including Makridakis (1989), De Gooijer and Hyndman (2006), Goodwin (2009), Pesaran and Pick (2011) and Wallis (2011), were motivated by this concept and suggest that greater predictive results can be achieved from a combination of different methods and sources. Therefore, the principle of Combination Forecasting, which was developed by economists, has now been applied to UK commercial property market cycle analysis.
To complete this aim successfully, the following research objectives are set:
i) Examine the key components of business and commercial property cycles and review the research and commentary on the subject chronologically;
ii) Assess existing modelling and forecasting practices within the field of commercial property market research and explore the application of the principle of Combination Forecasting as an alternative methodology for UK commercial property cycle forecasting accuracy improvement;
iii) Examine properties of the dependent and explanatory variables and present their key characteristics;
iv) To draw conclusions from the data analysis and assess as to whether Combination Forecasting improves UK commercial property cycle forecasting accuracy;
v) To draw conclusions on the data analysis and assess as to whether Combination Forecasting improves UK commercial property cycle forecasting accuracy;
vi) To identify practical implications of this research project for commercial property market participants.
1.3
Methodological considerations
A multi-strand approach is proposed to address the objectives of the research. Initially, the study critically reviews the literature on the subject. A literature review presents how understandings of the property cycles have evolved over time, what the critical issues at each stage of cycle research were, and what the key considerations currently are. It allows for an assessment as to how the understanding and a critical analysis of the subject have changed over the century, and how the current investigation relates to previous studies. It then provides a rationale for the current study by revealing the contribution that the research makes to current knowledge.
The study then uses econometric modelling to assess potential improvements to the accuracy of UK commercial property cycle forecasting. The study selects key property market modelling techniques, including Exponential Smoothing, ARIMA/ARIMAX, Simple Regression, Multiple Regression and Vector Autoregression approaches. Following on from this, it then employs Combination Forecasting. There is a suggestion that forecasters and decision makers discover the best performing model, which is then accepted and used, while rejecting other alternatives. However, the aim of the research is to obtain the most accurate forecast. Therefore, discarding alternative models is unproductive. What is more, there is a difficulty in deciding which model to choose when different specifications suggest different results. As such, Combination Forecasting eliminates these modelling deficiencies and provides a solution in improving overall forecasting accuracy.
1.4
Outline of the thesis
Chapter 2 discusses Efficient Market Hypothesis and its links with the property market. It assesses the key characteristics of business and property cycles. It then examines similarities between business and property cycles and presents the pattern of an idealised property cycle. Subsequently, it reviews the research on the subject chronologically, over a one hundred year span, characterising the major publications and commentary on the subject, and discussing the major implications. Following on from this, it investigates property forecasting accuracy and its improvement. It suggests that property cycle research resulted in the development of various forecasting models ranging from single exponential smoothing specifications to more complex structural with stationary data techniques. However, the findings indicate that despite these advancements in property market modelling and forecasting, there still remains a degree of inaccuracy between model outputs and actual property market performance.
Chapter 3 discusses difficulties related with use of different forecasting methods and then presents the principle of Combination Forecasting as a robust way of improving commercial property market modelling and forecasting. It covers the general principles of model implementation using the statistical software package PASW 18 (SPSS 18). It also assesses the issue of modelling using spread-sheets. Following on from this, the Chapter presents each modelling technique used for the research, including Single Exponential Smoothing (SES), Holt’s Linear Trend (HLT), Brown’s Linear Trend (BLT), ARIMA, ARIMAX, Simple Regression (SR), Multiple Regression (MR), and Vector Autregression (VAR). It also considers the principle formulae for Simple Averaging and OLS based Combination Forecasting (CF). Subsequently, the Chapter addresses statistical difficulties related to the construction of a real estate model. Chapter 4 discusses the importance of long-term series in analysing property cycles. It assesses difficulties related to UK property data and its
acquisition. It then presents the principle of Chain-Linking as the solution for time-series combination. Following on from this, Chapter evaluates properties of the dependent and explanatory variables. Subsequently, it presents five variable reduction techniques which are employed to select the key variables for modelling.
Chapter 5 reports the empirical findings of the study. It presents estimates obtained using each modelling technique, as well as Combination Forecasting. Modelling accuracy in- and out-of-sample is discussed along with a graphical presentation of the findings. Chapter then analyses and interprets results. It transforms the modelling estimates obtained into credible evidence about UK commercial property market modelling and forecasting, and its accuracy improvement through Combination Forecasting.
Chapter 6 concludes the thesis. It presents the key findings and implications of the research for commercial property market stakeholders, critically evaluating them and then proposing avenues for further work.
CHAPTER 2
LITERATURE REVIEW
The objective of this chapter is to review the literature concerning property cycles, modelling and forecasting. It is divided into three sections.
Section 1 starts with a discussion on Efficient Market Hypothesis and its relation to fluctuations in real estate. The findings support the idea that asset markets, and property market in particular, are inefficient. Imperfect information, high levels of transaction, production time lags, are just a few facts which add to inefficiency and therefore market cyclicality. The section then characterises business and property cycles. It presents the pattern of an idealised property cycle and discusses similarities between business and property cycles. It then examines key publications on the subject and assesses how understanding of the property cycles has evolved over time. The discussion is divided into five principal parts which follow so called ‘property cycles research eras’. ‘The Early Studies’ part reviews the earliest publications on the subject. Then follows ‘Post-War studies’ or as Barras (2009) calls it ‘empirical work’ period. This section concentrates on three key publications on the subject, one from the UK and two from the US, which offered a comprehensive analysis of the subject at that time. Subsequently, the ‘Post-1970s Crash Period Studies’ part assesses publications produced over the 1980s and explores the key findings of that time. Following on from this, the ‘Post 1990s Property Crash’ studies are examined. Finally, the so called ‘Modern Studies’ part assesses the most recent publications on property cycles.
Section 2 examines the issue of property market modelling. It assesses different property market modelling classifications discussed in the literature. It then presents a group of quantitative real estate forecasting methods and reviews their key characteristics. Subsequently, it discusses further issues in modelling, including stationarity and unit-root testing, Granger causality, and accuracy.
Section 3 assesses the accuracy of property market forecasting. It reviews studies on the subject where forecasters assessed the predictive capacity
of their models by comparing them with actual property market performance. It then examines studies on indirect accuracy measurement where researchers assessed the accuracy of already produced forecasts by comparing them against established property market benchmarks.
2.1
Property and business cycles
2.1.1 Property market (in)efficiency
The Efficient Market Hypothesis (EMH) suggests that financial markets are information efficient. This means that markets adjust rapidly to new information (Fama et al., 1969). As such, prices of traded assets including corporate stocks, commodities, or real estate (Shiller, 2014) are well known in advance (Maier and Herath, 2009). Therefore investors cannot gain advantage in predicting future direction of these assets using publically available information (Cho et al., 2007). The principle behind EMH is random walk process. In his empirical study, Fama (1970) demonstrated that day-to-day price changes and returns on common stocks follow a random walk with their autocorrelations being close to zero, which means that their future prices cannot be predicted based on past information.
However, there is a body of knowledge suggesting just the opposite (Ding et al, 1993; Cho et al., 2007). Researchers are commenting that although EMH is plausible, there are a number of difficulties related to it (Beechey et al., 2000; Maier and Herath, 2009; Shiller, 2014). In property market research, as Maier and Herath (2009) comment, there are two major issues which need to be considered. The first issue relates to information. The second involves price volatility and cycle analysis.
Regarding information and property market (in)efficiency, Brown (1991), Evans (1995), Kummerow and Lun (2005) and Maier and Herath (2009) commented on the essential relationship between two facets. According to Smullyan (1994) and Kummerow and Lun (ibid.), property has always been an ‘information business’. The information within the industry has always been ‘thin’. Intrinsic property asset characteristics such as heterogeneity and low trading frequency combined with insider information add to the magnitude of price changes within the sector. All this combined can destabilise the overall economy. These suggestions corroborated
earlier observations of Grossman (1978) and Grossman and Stiglitz (1980) who commented on information and market efficiency. According to both commentators, ‘informationally’ efficient markets are impossible. If markets were perfectly information efficient, returns on gathering and analysing this information would be nil. This would make asset trading obsolete. Therefore, the market would eventually collapse.
In terms of volatility, cycles and bubbles and their link with information asymmetry, Shiller (2014, p.21) in his Nobel Prize lecture, documented that real estate ‘prices are not at all well approximated by a random walk, as is the case for stocks, but often tend to go in the same direction, whether up or down, again and again for years and years”. What Shiller meant is that for ‘smart money’ to go in and out in the real estate market in response to news is impossible. This proposition was argued by Malpezzi and Wachter (2005) a decade ago. According to commentators, real estate prices are prone to cycles due to information arbitrage. Discovering prices is expensive, as such, prices become volatile. Similar findings were presented by Ball (2006) who argued that, on a European level, house prices varied over time implying market inefficiency. This therefore leads to boom-and-bust cycles in the property market.
Taken together, the discussion above suggests that market efficiency is important. Debates have continued for several decades. Thought results are inconclusive. However, the overriding idea is that asset markets, and property markets in particular, are inefficient. Imperfect information, low levels of transaction, and production time lags, are just a few factors which add to inefficiency and therefore property market cyclicality.
The following section discusses the key characteristics of the business and property cycle and the way they link together. It also presents a summary of the findings from property cycles research over a hundred year period.
2.1.2 Characterisation of the business and property cycle
The existence of cycles in the general business sector, as well as in building and property has been debated for more than a century (Mangoldt, 1907; Cairncross, 1934; Gottlieb, 1976; Hakfoort, 1992). According to Barras (2009, p.4), property cycles ‘have been recorded throughout history’. However, as Cairncross (1934) observed, they have been neglected by researchers, their statistics unassembled, and their organisation practically unknown. The situation changed after the Great Depression when academics and professionals determined to find ways to prevent the recurrence of such severe economic causalities in the future. Therefore, as Barras (ibid.) suggested, focus shifted into building investment, as the most volatile element of aggregate economic activity. The subject has grown to a significant importance in the UK, as the UK property market has been characterised by boom and bust cycles with a negative impact on the overall British economy. As a result, property cycles became a popular research topic amongst property professionals and scholars, with a greater understanding of the cyclical behaviour of the property market being seen as a major guide to the financial success (or failure) of property investments (Pyhrr et al., 1999; RICS, 1994, Barras, 2009). This subsequently led RICS (1994; 1999) and Baum (2001) to suggest that the concept of cycles is firmly embedded within property research.
Commentators, including Ball et al. (1998) and Barras (2009), argue that property cycle formation theories are mostly derived from business cycle research. As their studies show, the correspondence between property and business cycles is in the way both phenomena are defined, i.e. linguistic issue; the way they are expressed, i.e. visual issue; as well as in the way they are constructed, i.e. theoretical issue.
According to the standard definition of the business cycles presented by Parkin and Bade (1988, p.31), ‘business cycles are recurrent but non-periodic fluctuations in aggregate economic activity as measured by
fluctuations in real GDP about its trend’. Following the RICS’ (1994, p.9) definition of property cycles (which is now generally accepted within the property community) ‘property cycles are recurrent but irregular fluctuations in the rate of all-property total return, which are also apparent in many other indicators of property activity, but with varying leads and lags against the all-property cycle’. As these definitions suggest, both phenomena are expressed as recurrent, however irregular fluctuations. What is more, they are quantitatively defined, i.e. the business cycle is measured as fluctuations in GDP, while property cycles are measured as fluctuations in the rate of All-Property Total Returns.
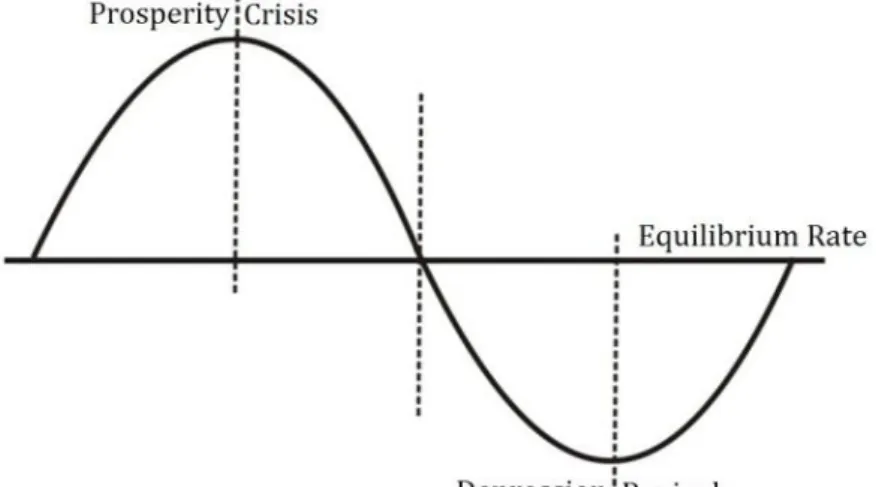
The similarity between business and property cycles is also visually observed. The idealised property market cycle is perceived as a four phase nomenclature which is similar to that of the business cycle (Mueller, 1999; Pyhrr et al., 1999). Both business and property cycles follow four major phases: recession (trough), recovery, expansion (peak), and contraction. ‘Peak’ and ‘trough’ are the major turning points of the cycle. Peak constitutes the end of ‘expansion’ and the beginning of ‘recession’, and ‘trough’ – the end of recession and the beginning of ‘expansion’ (Zarnowitz, 1992; Su, 1996). What is more, both concepts are expressed as a sine wave which deviates around its equilibrium. This interrelationship is illustrated in the ‘Schematic diagram of recurrent fluctuations in economic activity’ (Figure 2.1) and idealised ‘Property cycle phase nomenclature’ (Figure 2.2).
However, not all property researchers adopted the same cycle nomenclature. Commentators including Roulac (1996) and Hewlett (1999) identified the sequence of the property cycle somewhat differently. Roulac (1996) presented the property cycle as a sequence of expansion, slowing, contraction, correction, recovery, and again expansion. Hewlett (1999) saw a property cycle as a three phase framework consisting of upturn, maturity and downturn. Nevertheless, as Ball et al. (1998) commented, the pattern of an idealised property cycle is still the same despite a terms to describe them.
Figure 2.1 Schematic diagram of recurrent fluctuations in economic activity Adapted from: Frank (1923)
Figure 2.2 Property cycle phase nomenclature Adapted from: Pyhrr et al. (1999)
As it was noted above, the relationship between property and business cycles is also evident in the way property cycles are characterised. According to Ball et al. (1998), the pattern of the idealised property cycle is as follows:
- Business upturn and development: an increase in the economic activity generates strong user demand for space; existing space is absorbed quickly; vacancy rates fall and rents rise; this thus works as a signal for new property developments to begin;
- Business downturn and overbuilding: business cycle turns downwards which reduces demand for space; however, new stock reaches the market (normally it takes few years to build the building); as a result, vacancy rates rise and rents fall;
- Adjustment: following on from this, growing vacancy rates trigger further falls in rents; developers and investors are unable to generate income from properties they hold. This leads to a series of bankruptcies;
- Slump: both demand for space and development activity are at their lowest levels, with vacancy rates being above equilibrium level and rents being below equilibrium level.
- The next cycle: when the next business upturn occurs, there is still a substantial level of vacant space available from the previous cycle, which implies limited need for new developments.
In general, this simple explanation of the property cycle suggests that the property cycle is a product of overall business dynamics. The hypothesis is that cyclical fluctuation in business activity generates demand for and production of property and vice-versa, which comes from the necessity to occupy property to undertake activity (Ball et al., 1998). However, the idea that property and business cycles are interlinked with each other was not argued until more recently (Ball et al., 1998). The developments in understanding of property cycles are described in greater detail in the following section.
2.1.3 Understanding of the property cycle
Early studiesThe first serious discussions and analyses of property cycles emerged during the late nineteenth and early twentieth century. As Gottlieb (1976) and Barras (2009) indicated, German scholars were pioneers of property cycle research. The major object of their investigations was the urban growth of German cities and its impact on residential construction, property market activity and land values. In his general work, Mangoldt (1907) demonstrated the tendency for urban growth to run in long waves in the city of Freiberg. Reich (1912) investigated the residential market in Berlin between 1840 and 1910. Eychmüller (1915) studied the economic development, urban land and building policies of the city of Ulm for the period 1850-1919. In her manuscript, Carthaus (1917) assessed the history of the land crisis in German big cities with a special emphasis on Greater Berlin. Eisenlohr (1921) in his study discussed urban and housing conditions of the city of Mannheim. These studies were subsequently followed by the researchers from other metropolitan areas.
It is considered that in the US research on the subject started in 1933 with Hoyt’s publication. In his book Hoyt investigated cyclical fluctuations of the Chicago property market. Generally, Hoyt suggested that business conditions, commodity price levels, value of money and especially a rapid increase in population within a relatively short period of time were the major causes of the real estate cycles. The author affirmed that past property cycles were mostly generated by the sudden and unexpected increase in population seeking greater industrial opportunities within the area. It therefore led Hoyt to hypothesise that future property cycles would be generated by the identical increase in population, which would result from an expansion of industrial opportunities. Accordingly, he identified relatively long and uncertain (on average 18 years) real estate cycles. These observations add to Wenzlick’s (1933) findings, who identified similar cycles for St. Louise, and Maverick’s (1933) observations, who
estimated similar real estate fluctuations for Los Angeles and San Francisco.
In the aftermath of the Great Depression, Newman (1935) further investigated building cycles. In his monograph, the author stressed that ‘it is highly important that the nature of, and reasons for, fluctuations in such activity be subject to rigorous inductive and deductive analysis’ (ibid., p.2). The building industry was chosen due to its size and importance to the US economy, and the number of people employed. As Newman estimated, building comprised around 50 percent of the total US economy. He therefore expected fluctuations in private building to have a major effect on the economy. Newman used the term ‘building industry’ to refer to durable and fixed goods which provide shelter to individuals and businesses. His empirical estimates were based on the building activity index which was comprised from the dollar value of the building permits. The outstanding characteristic of this research was identification of so called ‘major cycles’, lasting between fifteen to twenty-one years. The other findings included a tendency for the building cycle to precede the business cycle (business lagged three months behind building) and considerable independence between movements of the two series. Newman also stressed a close relationship between building and population. However, he appreciated that factors such as availability of capital, or general business conditions play an important role in this process. He therefore concluded that ‘fluctuations in building activity were found to be closely associated with shifts in population … and these shifts in population are, of course, reflections of economic and social alterations which make a change of residence desirable to a larger number of people’ (ibid., p.56).
A significant contribution towards the research and understanding of building cycles was made by the American economist Clarence D. Long, Jr. In 1936, Long published a study on the building industry of Manhattan in which he explored the major components of the industry of that time. His statistical analysis suggested the existence of two types of building
cycles, .i.e. major cycles of a period between 15 to 20 years, and minor cycles of around 5 years in length.
After this study on a local building market, Long (1939) published an article on national building activity. This study comprised both residential and non-residential building indices of the US for the 1856-1935 period. The value-index included 27 and the number-index included 29 of the most populous cities of the country. Similar to Newman (1935), Long (ibid.) pointed out that major building cycles were somewhat independent of the business cycle. He also hypothesised that building cycles precede the general business cycles in the downturn, however lag in the upturn. Subsequently, Long (ibid.) identified 18-19 years building cycles in both residential and non-residential building.
A year later, Long (1940) published, as some authors (e.g. Singer, 1942; Barras, 2009) indicate, a second major study on the subject after Hoyt’s Chicago case study. For his analysis Long constructed a monthly Index of Building for the period between 1868 and 1940, which was based on the local figures of building permits. The results of the statistical analysis led him to identify short building cycles of an average of 4 years duration, and long cycles of around 20 years in length. To substantiate his findings, Long referred to previous studies on the subject, including Hubbard (1924), Clark (1934), and Newman (1935) who identified similar building cycles.
One of the first studies on the UK building cycles was that of Cairncross (1934). In his analysis of the Glasgow building industry (1870-1914), which was considered at that time as probably the best documented property market in the UK, Cairncross identified that demand for housing ‘naturally fluctuate with the number and incomes of potential tenants’ in around every twenty years (ibid., p.4). Similarly to Wenzlick (1933), Cairncross noted that the marriage-rate and migration all have a significant effect on building cycles.
With regard to research on the subject in the United Kingdom, the same year as Cairncross (1934) published his research on the Glasgow building industry, Shannon (1934) produced a Building Index (index of brick production) for England for the period between 1785 and 1850. Statistical analysis of the data led the author to identify 16 year-long building cycles, which were closely linked to population growth.
In 1937, Bowley published an investigation into fluctuations of the house-building and trade cycles for the 1924-1936 period for England and Wales. Her analysis led to the conclusion ‘that there has been little causal connection between the trade cycle and house-building activity since the War [WWI]’ (ibid., p.181). Population change was identified as the primary factor influencing demand for housing.
A more robust discussion on the building and trade cycle was presented by Bowen (1940). His national investment analysis covered the 1924-1938 period for all the UK. Bowen compared three series: Building Plans Passed, Ministry of Health Returns of Houses Completed, and Ministry of Labour Insured Unemployment Returns for the Building Industry. The results of the study suggested that building activity and the general trade cycle are interconnected.
Table 1 summarises the key publications on property cycles during this research era. It contains title, data and data analysis techniques which were employed by researchers, as well as outcomes of these studies. The following section reviews the key publications produced during the pot-war period.
Publication Data employed Statistical technique Outcomes of the Study Hoyt, H. (1933) One hundred years of land
values in Chicago. The relationship of the growth of Chicago to the rise in its land values, 1830-1933. The University of Chicago, US, pp.452
Land values; New construction; Lots subdivided; Public improvements; Population; Foreclosures; Real estate transfers; Bank clearings; Canal-rail stock prices; Wholesale commodity prices
Data comparison; Turning point analysis; Time-series analysis (1830-1933); Visual data analysis (of maximum and minimum)
18 years building cycles; Real estate cycles may be a passing phase
Cairncross, A.K. (1934) The Glasgow Building Industry (1870-1914). The Review of Economic Studies, Vol.2, No.1, pp.1-17
House building and demolition; Rents; Site values; Heavy industry activity; Interest rates; Population (rate of marriage and immigration)
Data comparison; Turning point analysis; Time-series analysis (1870-1914); Visual data analysis (of maximum and minimum)
20 years building cycles; Real estate cycles have a great correlation with population
Newman, W.H. (1935) The building industry and business cycles. University of Chicago Press, Chicago, pp.72
Building permits; Building costs; Population growth; Bond yields; Rents; Operating expenses; B.B.N index
Time-series analysis (1875-1933); Turning point analysis; Correlation analysis; Index composition
15-21 years ‘major cycles’; 4-5 years ‘minor cycles’; Building cycles precede business cycles; Independence between movements of two series; Constant correlation between building space and population
Long, C.D., Jr. (1940) Building Cycles and the Theory of Investment. Princeton University Press, NJ, pp.239
Gross capital formation; Total construction; Building costs; Incomes; Interest rates; Building levels; Population; Taxes; Housing costs
Time-series analysis (1868-1940); Turning point analysis; Simple mathematical
calculations (averages, deviations, medians); Correlation analysis; Assumption testing; Index composition; Index smoothing (by means of the Macaulay 43-term graduation)
4 years short building cycles; 20 years long building cycles; Greater volatility of cycles in building than in business; Building cycles precede business cycles; Correlation between long building cycles and the general business conditions
Bowen, I. (1940) Building Output and the Trade Cycle (U.K. 1924-38). Oxford Economic Papers, No.3, pp.110-130
Building plans passed; Returns of houses completed; Insured unemployment returns for the building industry; Savings
Time-series analysis (1924-1938); Correlation analysis; Data comparison; Visual data analysis; Data smoothing (3 year moving average); Trend analysis
Correlation between building an population; A greater role of building within the economy
Post-War studies
During the 1930’s there were a number of studies and publications produced on building cycles. However, the post-war period saw a decline in the volume of research on the subject. As Lewis (1960) and more recently Barras (2009) noted, individual studies such as Grebler (1954) or Cairncross and Weber (1956) were published, which mostly repeated the major studies of the 1930’s only by adding newer data or extending the statistics of their predecessors.
One of the first attempts to renew the discussion on the subject was Lewis’ (1960) empirical study. In this work, he proposed a theoretical dynamic regional building model. Regional building cycles were identified as the major elements of the total building cycle mechanism. Lewis (ibid., p.533) pointed out that ‘there can be no national building boom without there being at least one local boom, and the justification for a local boom must lie in local need’. Lewis hypothesised that national building booms occur at a time when several regional building booms coincide with each other purely by accident or during a period of national prosperity.
The importance of local building activity was also addressed by Saul (1962). His investigation into house building activity in England between 1890 and 1914 led to the conclusion that investment in housing ‘was largely determined by causes special to the domestic housing market’ (ibid., p.120).
In 1965, Lewis published a major study - a historic survey of British economic growth from 1700 to 1950. In this publication, Lewis investigated the existence of the long building cycles. First, he undertook a historical review of the UK building industry. He then created a mathematical simulation model to test his hypotheses. The identification of building cycles of 18 to 20 years in duration was one of the central findings of the book. Lewis argued that building cycles were generated by a number of endogenous and exogenous factors. The endogenous factors which Lewis considered were level of production, income, population structure,
migration, credit supply, and rent level. The key exogenous factors which the author emphasised were war and the level of harvest. Lewis appreciated the interconnection between these factors, as well as the economic context within which they occur. This led Lewis (ibid.) to suggest that, as these factors varied significantly over time, each building cycle was unique with its own inherent characteristics. Subsequently, study has shown that demand for building is a function of local factors, e.g. building activity in Manchester was linked to levels of the cotton industry, while in South Wales it was related to the coal trade, with both industries being the key to the region. What is more, two key factors, i.e. credit conditions and population in particular, were articulated by the author. According to Lewis, internal migration, emigration, and changes in the family structure were all powerful factors in determining housing demand.
Abramovitz (1964) published one of the major post-war studies on the subject in the US. As the author indicated, the purpose of this monograph was to ‘review and assess the evidence bearing on the existence of long waves in aggregate construction and in the major types of construction activity in the United States’ (ibid., p.1). The construction industry was chosen because of its size and importance to the US economy. The statistical analysis of the 38 annual time-series enabled Abramovitz to identify long waves in aggregate construction of duration between 15 and 25 years. Uniform long swings were also found in the other major areas of the American economy, including population growth and immigration, volume of import, and railroad development. Abramovitz therefore attributed the existence of long cycles within construction activity to the dynamics in the general economy, demographics and trade.
The study by Gottlieb (1976) offered probably the most comprehensive empirical analysis of the subject at that time. In this book, Gottlieb assessed the time-spread of long urban-building fluctuations in the US. Gottlieb then compared the dynamics of the building industry with the general business cycle, as well as with fluctuations of economic series in other countries. For his research Gottlieb employed over 200 long
time-series produced by the NBER on building, finance, demographics and real estate activities for the US, UK, Sweden, France, Australia, Netherlands, Germany, Canada, Italy, and Japan. The study suggested the existence of long building swings in modern capitalistic societies and apparent synchronisation between local and national cycles. What is more, the results of this study suggested that both long local and national building cycles were virtually of the same duration. According to Gottlieb’s statistical analysis, the average length of long local building cycles was 19.7 years, and the average length of long national building cycles was 19.0 years. The argument behind these findings was that ‘local cycles were simply a local phase of a national movement, while the national movement was in turn mainly a coalescence of local cycles’ (ibid., p.9). Another important finding which emerged from the study was the relationship between building cycles and demographic changes. According to Gottlieb, favourable economic conditions encourage or discourage formation of new households, which consequently has a direct effect on the volume of demand for additional dwellings. This demand also affects old stock, land and credit markets. All this in combination triggers greater building and real estate market activity.
Table 2 summarises the key publications of this research period, which includes title, data and data analysis techniques employed and outcomes of these studies. The following section presents the key post-1970s crash studies on property cycles.
Publication Data employed Statistical technique Outcomes of the Study Abramowitz, M. (1964) Evidences of Long
Swings in Aggregate Construction since the Civil War. National Bureau of Economic Research, New York, pp.252
38 series on non-farm residential, private non-residential, farm, public and ship building, and transportation and public utilities
Data comparison; Time-series analysis (1870-1955); Turning point analysis; Visual data analysis (of maximum and minimum, and peaks and troughs); Data smoothing (5 and 10 year moving average); Amplitude
measurement.
15-25 years building cycles; Close interaction between building and the economy; Structural change of the US economy leads to demise of cycles
Lewis, P.J. (1965) Building Cycles and Britain's Growth. Macmillan, London, pp.396.
20 time-series (import/export, building, marriage rate, bank rate, house prices, rents, etc.)
Time-series analysis (1700-1950); Turning point analysis; Correlation analysis; Index creation (artificial time-series); Probability modelling (experiments with multiplier-accelerator mechanism)
18-20 years building cycles; Correlation between building and population and credit; Building is a function of the local factors
Gottlieb, M. (1976) Long Swings in Urban Development. National Bureau of Economic Research, New York, pp.360
Around 200 long time-series (building, building costs, population, land values, etc.)
Time-series analysis (1840s-1930s); Comparison/Visual inspection; Smoothing (Time-series decomposition/Fixed term moving average); Turning point analysis; Correlation analysis; Data comparison; Visual data analysis (of maximum and minimum, and peaks and troughs); Amplitude measurement
20 years building cycles; Correlation between building and population, as well as local and national cycles
Post-1970s crash studies
According to Barras (2009), the 1960s was a period of apparent economic stability. It therefore led some commentators, including Abramovitz (1968) and Bronfenbrenner (1969), to question whether cycles were still relevant. However, the property market crash of the mid 1970s triggered a renewed wave of research on property cycles. As Barras (1994) indicated, his personal interest on the subject was first prompted by the 1970s property crash, which led to the publication of a number of papers including Barras (1983; 1984; and 1987), as well as a series of papers commissioned from the Economic and Social Research Council (ESRC) on building cycles in Britain, i.e. Barras and Ferguson (1985; 1987a; 1987b).
Barras (1983, p.1) proposed ‘a simple theoretical model of the office development cycle’ for Britain. He employed an accelerator type model and, by incorporating a long term production period between building order and its completion, explained how cycles are generated around their equilibrium growth path. The model was then tested in reality and compared with the results of previous empirical investigations.
Barras (1984) examined the major characteristics of the London office market. The researcher discussed the main factors which governed the growth of London as an international office centre. Subsequently, he illustrated the apparently cyclical nature of office development in the city. He then briefly reviewed development control policies, identifying difficulties associated with existing control strategies, and their effect on the property development industry. Finally, Barras assessed the 1980s development cycle. He particularly emphasised the impact of information technologies on user demand for London offices in the post 1980s development cycle.
Barras (1987, p.1) investigated ‘urban development cycles’ in Britain and their links with technological changes. According to the author, long swings of 20-30 years duration are normally generated by shorter cycles, i.e. two shorter cycles are generally superimposed by the dominant long
swing, causing pronounced building cycles. The author also suggested that building activity is particularly prone to cyclical fluctuations in comparison with other capital investment classes.
A significant analysis and discussion on the subject was presented by R. Barras and D. Ferguson in their three stage research project. In the first paper, Barras and Ferguson (1985) investigated the detailed chronology of five major building sectors including private industrial, private commercial, private housing, public housing, and other public building. The authors employed spectral analysis to determine and compare each building series, their cyclical characteristics, and relationships between the cycles. What is more, informal turning point analysis was used to identify the precise chronology of each cycle. It all allowed Barras and Ferguson to suggest that UK post-war building experienced ‘strong cycles’, i.e. ‘short cycles’ of 4 - 5 years, ‘major cycles’ of 7 - 9 years, and ‘long swings’ of 28 years within housing investment and 19 years within other building. Short cycles were linked to general business cycles, major cycles – to production lags within the construction industry and public expenditure policy, and long swings – to ‘major waves of urban development’ (ibid., p.1389).
In the second paper Barras and Ferguson (1987a) developed a theoretical dynamic model of property cycles. The model incorporated both endogenous and exogenous elements of the built environment. Endogenous mechanisms were related to the production lag within the industry. The exogenous influences were associated with variations in economic activity, particularly in the GDP and bank interest rate. The researchers assessed industrial, commercial and residential property sectors. As the authors indicated, public building was excluded as this type of property ‘reflects not so much the dynamics of market behaviour, but rather the periodic shifts in public investment which result from changes in government policy’ (ibid., p.353). The theoretical dynamic model was based on Box and Jenkins (1976) (ARIMA) time-series modelling technique. The researchers also included an error-correction
element into the framework in order to derive short-run adjustment dynamics and long-run equilibrium relationships between time-series. The user activity, which generated demand for space, was identified as being accountable for long-run equilibrium of property development, which at the same time is proportional to net investments in new buildings. Short-term property market dynamics was found to be highly dependent on exogenous variables, including building costs, property market prices, rents and yields, availability of finances, and financial performance of other types of long-term investments.
In the concluding paper, Barras and Ferguson (1987b) presented empirical results of their research for each property sector (private industrial, commercial and residential). As the results suggested, the equilibrium level of industrial and commercial property is dependent on the level of user activity which creates demand for this type of property. The residential property was identified as being a subject of investment activity. The commentators also identified that all types of property have one common component – construction lag, which serves as an endogenous cycle mechanism. This construction lag was distinguished as being the key driver behind the major cycle of a period of 35 quarters (8 years). The user activity, which generates fluctuations within business cycles, was identified as being the main exogenous mechanism which governs short building cycles within all types of property. It was also detected that user activity has links with movements in the level of GDP and investment activity. Development costs were identified as having the least impact on building cycles.
In the US, studies on the subject continued to be influenced by the NBER research agenda. In their publication, Grebler and Burns (1982) investigated short-term post-war cycles in the US construction sector following the established NBER methodology. The authors related these cycles to business fixed investment and ‘reference cycle’ in GNP. Their research concentrated on four key aspects. It assessed whether cycles became more severe over time, examined the impact of public activity on
cycles, appraised the relationship between business and construction cycles, as well as evaluated whether construction cycles lead or lag the general business cycles. The data for the study covered the 1950-1978 period. The empirical analysis of duration, amplitude and number of cycles led the authors to identify six cycles in private residential construction (18 quarters on average), four in private non-residential (29 quarters in average), and four cycles in state and local construction (28 quarters in average). The analysis also suggested that these cycles were generated by their own inherent characteristics and determinants.
In the US the post-1970s crash studies particularly concentrated on the office market and its dynamics. According to Wheaton (1987), Clapp (1993) and Barras (2009), this particular asset class attracted great attention due to its expansion in the late 1980s. Moreover, this market segment exhibited high levels of volatility in comparison to other types of commercial property.
One of the key studies was Wheaton’s (1987, p.1) investigation into ‘the cyclical behaviour of the national office market’. In this research, Wheaton assessed the post-war US office market and identified the existence of the recurrent ten years ‘national office market cycles’ (ibid., p.283). Wheaton analysed data for the 1960-1986 period for national office employment, building starts, building completions, absorption, and vacancy rate. He