Page 1 of 1
FedUni ResearchOnline
https://researchonline.federation.edu.au
Copyright NoticeThis is the peer-reviewed version of the following article:
Taheri, S., et al. (2019). Multi-source cyber-attacks detection using machine learning. 2019 IEEE International Conference on Industrial Technology, ICIT 2019, Institute of Electrical and Electronics Engineers Inc.
Which has been published in final form at: https://doi.org/10.1109/ICIT.2019.8755006
Copyright © 2019 IEEE. Personal use of this material is permitted. Permission from IEEE must be obtained for all other uses, in any current or future media, including reprinting/republishing this material for advertising or promotional purposes, creating new collective works, for resale or redistribution to servers or lists, or reuse of any copyrighted component of this work in other works.
Multi-Source Cyber-Attacks Detection
using Machine Learning
1
stSona Taheri
Internet Commerce Security Laboratory Federation University Australia
Ballarat, Australia [email protected]
2
ndIqbal Gondal
Internet Commerce Security Laboratory Federation University Australia
Ballarat, Australia [email protected]
3
rdAdil Bagirov
Internet Commerce Security Laboratory Federation University Australia
Ballarat, Australia [email protected]
4
thGreg Harkness
Westpac Banking Corporation Sydney, Australia [email protected]
5
thSimon Brown
Westpac Banking CorporationSydney, Australia [email protected]
6
thCHihung Chi
Data 61, CSIRO Tasmania, Australia [email protected]Abstract—The Internet of Things (IoT) has significantly in-creased the number of devices connected to the Internet ranging from sensors to multi-source data information. As the IoT contin-ues to evolve with new technologies number of threats and attacks against IoT devices are on the increase. Analyzing and detecting these attacks originating from different sources needs machine learning models. These models provide proactive solutions for detecting attacks and their sources. In this paper, we propose to apply a supervised machine learning classification technique to identify cyber-attacks from each source. More precisely, we apply the incremental piecewise linear classifier that constructs boundary between sources/classes incrementally starting with one hyperplane and adding more hyperplanes at each iteration. The algorithm terminates when no further significant improvement of the separation of sources/classes is possible. The construction and usage of piecewise linear boundaries allows us to avoid any possible overfitting. We apply the incremental piecewise linear classifier on the multi-source real world cyber security data set to identify cyber-attacks and their sources.
Index Terms—Internet of Things, Cyber security, Multi-source data, Machine learning, Classification, Incremental approach
I. INTRODUCTION
The Internet of Things (IoT) has attracted a significant attention from researchers in the modern technology days [3], [4], [7], [15], [29]. The IoT represents a system consisting things in the real world, the sensors attached to these things and connected to the Internet via wireless networks. Using these sensors and embedded processors, the IoT-enabled smart devices collect and share information about the condition of things. Despite the numerous benefits of IoT applications, several security threats are observed [1], [25]. The IoT devices frequently ship in insecure data information coming from different sources. The data information usually contain cyber threats launched against the IoT assets by attackers aiming to damage or disable the system operation, to endanger the general populace or cause severe economic damages [10], This research work was conducted in Internet Commerce Security Labora-tory (ICSL) funded by Westpac Banking Corporation, Australia.
[22], [26]. Having these issues and concerns, the importance of cyber security for the IoT infrastructure is being more seriously recognized.
Some application scenarios of the IoT involves collecting a large number of data from multiple sources. To support the users of smart things, the original data context determined from different sources need to be analyzed as accurate as possible. However, large scale multi-source applications based on the IoT are increasingly vulnerable to the disruption from cyber-attacks [19]. In such cases the IoT will require a variety of access controls to protect devices from attacks. To handle all modes of these operations by the IoT virtually, different techniques have been introduced to secure the IoT devices from malicious attacks [1], [11], [13], [16], [24], [30].
Over the last few years machine learning has been depicted as a powerful technique to address the growing cyber security problems and challenges. Various machine learning techniques have been introduced in the literature to solve these problems and therefore, to protect the network systems from cyber-attacks. They include, but not limited to the supervised data classification and clustering algorithms [2], [8], [11], [14], [18], [20], [27], [31]. The authors in these articles consider and apply the support vector machines, k-nearest neighbors, artificial neural networks, Bayesian networks, decision tree, fuzzy clustering and k-means algorithms to name a few. Despite extensive research works to ease these threats, many problems remain open and challenges to be solved [22], [32]. In this paper, we apply the incremental piecewise linear classification algorithm to identify the cyber-attacks from different sources/classes. The reason to apply this algorithm is because the classes in the problem detection of attacks are not, in general, linearly separable. Usually, in this case classes cannot be separated using only one linear function and nonlinear functions should be used to get a satisfactory separation. We use piecewise linear functions to approximate the nonlinear functions separating classes. We also apply
an incremental approach to construct the piecewise linear functions. Such an approach allows one to easily extend piecewise linear classifiers to very large multi-source data sets. Indeed, at each iteration of the incremental algorithm, non malicious attacks (data points which are not contributing to the separating surface) will be removed and not to be used in the next iterations. This leads to a significant reduction in the number of iterations, and therefore an efficient decrease in the computational complexity. Since the supervised data classification approaches deal with the labeled data sets, we first combine data from multiple sources by giving a class label to data from each source. Then, we apply the incremental piecewise linear classification algorithm to identify malicious attacks from different sources.
The rest of the paper is organized as follows. Section II provides some background in enterprise cyber security data sources and how to deal with cyber-attacks. In Section III we present the incremental piecewise linear classification algorithm. Numerical experiments are reported in Section IV including a description of the data set. Section V contains some concluding remarks.
II. ENTERPRISE CYBER SECURITY DATA SOURCES The elements of data analysis techniques for enterprise cyber defense include the discovery of data sources, assessing their likely values, developing code for parsing relevant event attributes into normalized forms and finally transforming and combining events into actionable analysis. Data relevant to cyber security can come from a large variety of sources including [17]:
• Event logs from windows desktop, servers and Active Directory servers:this type of events is configurable and can include everything from user authentication activity to process starts and stops to various system configuration change events.
• Event logs from all enterprise-wide windows-based desk-top and server computers:these are very similar in format to the domain controller logs.
• Network flow event logs from central routers within the enterprise network: these records indicate network connection events between computers in the network.
• Domain name service lookup records from internal, enter-prise DNS servers:these event records indicate lookups of computer names and IP addresses within the enterprise network.
• Web poxy log events for internet-bound web:these events are surfing activities from nearly all desktop and server computers.
• Antivirus log events: theses events are from nearly all windows-based desktop computers.
• Cyber incident response (IR) tickets: these tickets are generated by IR analysts and automated processes leading to cyber intrusion investigations.
Network security systems are overwhelmed with a large number of multi-source cyber data sets which have a variety of
types and formats. In order to derive knowledge and to make decisions in these data sets following steps should be done:
• Data Preprocessing: The preprocessing will eliminate incorrect or duplicated data information and will provide a valid data set. Then this data set will be normalized, digitized and will be converted into a unified format.
• Feature Fusion: The feature fusion will select the im-portant features of the data set which will reduce the dimension of the set and therefore, will decrease the consumption of resources to store the data set.
After these steps, the processed data set are ready to be analysed. This process can be seen as a pattern recognition system, and machine learning approaches can be applied. A classifier model through training to identify the abnormal network behaviors can be obtained, and actions can be taken for treatment.
Case studies on the analysis of multi-source cyber-attacks present different ways of addressing this problem, and various methods have been introduced in the literature to protect the network systems [9], [23], [28], [31]. In this paper, we apply an incremental piecewise linear classification algorithm to identify cyber-attacks and their sources. We present a brief description of this algorithm in the next section.
III. AN INCREMENTAL PIECEWISE LINEAR CLASSIFIER The incremental piecewise linear classification algorithm consists of two main stages. In the first stage, each class is approximated using one hyperbox. Then data points are divided into two categories:
• Data points which belong to their respective classes;
• Data points which lie on or close to the boundary between classes.
The intersections of hyperboxes define the “indeterminate” regions. Points from the first category are not in this re-gion and do not contribute to the boundary. These points are removed in the second stage where the piecewise linear boundary between classes is computed using only data points from the “indeterminate region”. This reduces computational complexity significantly which is very important in detecting cyber-attacks.
Since hyperboxes can be considered as a special case of continues piecewise linear functions, such an approach allows one to determine boundaries of classes using these functions. The problem of finding piecewise linear function separating two finite point sets can be formulated as an optimisation problem as follows [5], [6].
LetAandB be two disjoint sets:
A={a1, . . . ,am}, ai∈Rn,i=1, . . . ,m, and
B={b1, . . . ,bp}, bj∈Rn,j=1, . . . ,p.
Consider a collection of hyperplanes{xi j,yi j}, j∈Ji, i∈I , wherexi j∈Rn, y
0, Ji6=/0∀i∈I. Using this collection, the following max-min function on Rn can be defined as:
ϕ(z) =max i∈I minj∈Ji
hxi j,zi −yi j , z∈Rn. For a given set of hyperplanes
{xi j,y
i j}, j∈Ji, i∈I , an averaged error function is defined as:
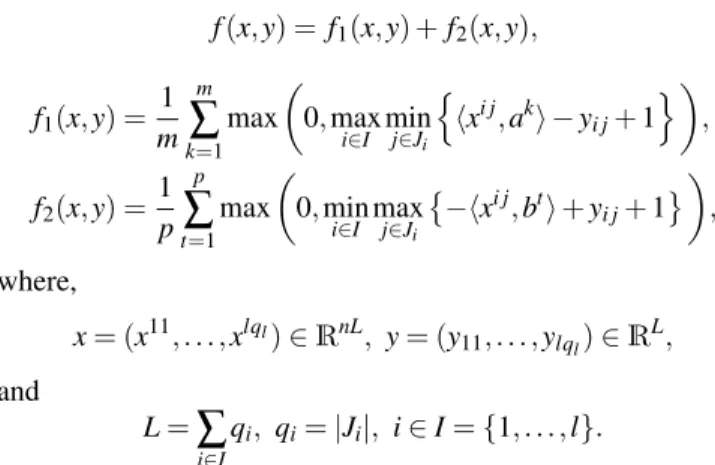
f(x,y) =f1(x,y) +f2(x,y), f1(x,y) = 1 m m
∑
k=1 max 0,max i∈I minj∈Ji n hxi j,aki −yi j+1 o , f2(x,y) = 1 p p∑
t=1 max 0,min i∈I maxj∈Ji −hxi j,bti+yi j+1 , where, x= (x11, . . . ,xlql)∈RnL, y= (y 11, . . . ,ylql)∈R L, and L=∑
i∈I qi, qi=|Ji|, i∈I={1, . . . ,l}.Then the problem of piecewise linear separability can be written as:
minimise f(x,y)subject to(x,y)∈R(n+1)L. (1) The solution of Problem (1) is the piecewise linear boundary between the classes. To solve this problem, we apply an incremental approach proposed in the paper [5], [6].
IV. NUMERICAL EXPERIMENTS
This section includes 3 subsections. First we present a description of the data set used in our experiments. Then we describe the implementation of the IPWLC algorithm and some other concurrent classification algorithms. Finally we present the results and discussion.
A. Multi-source real world cyber security data set
The multi-source real world cyber security (MSRWCS) data set [17] represents 58 consecutive days of de-identified event data collected from five sources within Los Alamos National Laboratory’s corporate, internal computer network. The data sources include:
1) Authentication:this data represents windows-based au-thentication events collected from both individual com-puters and centralized active directory domain con-troller servers. Each event contains the features “time”, “source user@domain”, “destination user@domain”, “source computer”, “destination computer”, “authenti-cation type”, “logon type”, “authenti“authenti-cation orientation” and “Success/Failure”.
2) Network Flows:this data presents network flow events collected from central routers within the network. Each event has the features “time”, “duration”, “source com-puter”, “source port”, “destination comcom-puter”, “destina-tion port”, “protocol”, “packet count” and “byte count”. 3) Red Team: this data presents a set of well-defined red team events that present bad behavior within 58
days. Each event has “time”, “user@domain”, “source computer” and “destination computer”.
4) Processes: this data represents process start and stop events collected from individual windows-based desktop computers and servers. Each event has the features “time”, “user@domain”, “computer”, “process name” and “start/end”.
5) DNS: this data presents Domain Name Service lookup events collected from the internal DNS servers. Each event contains the features “time”, “source computer” and “computer resolved”.
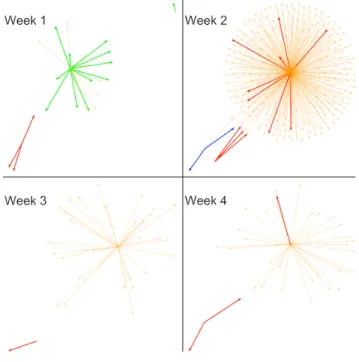
The figures 1, 2 and 3 show the plots of three first sources of MSRWCS data set (see [12]). The figure 1 demonstrates full 58 days of “Authentication” data resulting in a graph with 18,000 nodes and 400,000 directed edges (removing duplicates), colors indicating authentication type. One of the four computers used for the attack (the highest degree of the four, ID “C17693”, with 296 out of 534 edges labelled as nefarious) has its connections highlighted in pink .
Fig. 1: Authentication.
The figure 2 presents the full communication graph for the “Network Flows” data. It has 12,017 nodes (computers), 99433 edges (each indicating ≥communication between the corresponding computers), and colors indicate the ports used (indicating the type of communication, e.g. 80 = Web, 445 = Active directory, etc).
The figure 3 shows a subset of users who can be taken to be acting as intruders (“Red Team” data). This data comprise 749 authentication events of the form “user x authenticated from computer A to computer B”, giving directed edges, which are colored by user. Three ostensibly important user accounts are
Fig. 2: Network Flows.
highlighted, in blue, red and purple, and the 101 others are in orange.
Fig. 3: Red Team.
In total, the data set is approximately 12 GB compressed across the five data elements and presents 1,648,275,307 events in total for 12,425 users, 17,684 computers and 62,974 processes. Specific users that are well-known system related (SYSTEM, Local Service) were not de-identified though any administrators account were still de-identified. In the network flow data, well-known ports (e.g. 80, 443, etc) were not de-identified. All other users, computers, process, ports, times, and other details were de-identified as a unified set across all the data elements (e.g. U1 is the same U1 in all of the
data). The specific timeframe used is not disclosed for security purposes. In addition, no data that allows association outside of LANLs network is included. All data starts with a time epoch of 1 using a time resolution of 1 second. In the authentication data, failed authentication events are only included for users that had a successful authentication event somewhere within the data set.
B. Implementation of algorithms
The IPWLC algorithm is implemented in Fortran 95 and compiled using free compiler gfortan. In this algorithm, we set the parameters according to [6]. For other classification algorithms (namelyk-Nearest Neighbor (k-NN), Radial Kernel Support Vector Machines (RBF-SVM), Bayesian Network (BN) classifier and Artificial Neural Networks (ANN)), we use their R implementations and recommended parameters available in [21]. The computational experiments are carried out on a machine with Intel(R) Core(TM) i5-8250U CPU @ 1.60 GHz 1.8 GHz and 32.0 GB of RAM.
C. Results and discussion
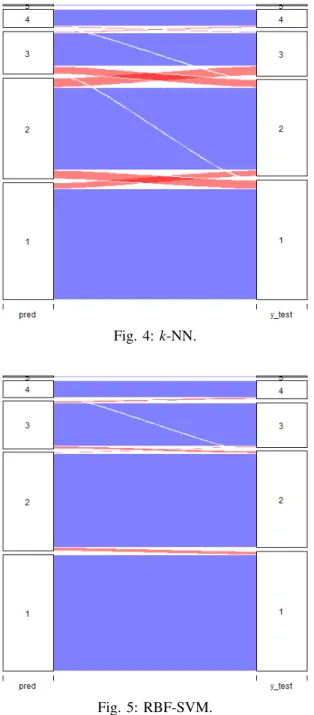
We demonstrate the performance of the Algorithmsk-NN, RBF-SVM, BN, ANN and IPWLC on the MSRWCS data set in Figures 4, 5, 6, 7 and 8, respectively. In these figures, the colors blue and red show the true classification and misclassification of the algorithms in this data set, respectively. More precisely, the more blue color the graph has the better ability the algorithm has to detect and classify the attacks and their sources.
From Figure 4 it can be seen that k-NN finds most of attacks from the first class/source (approximately 94.45 %). Only few attacks from the first source is misclassified to the second source (red part going from first class to the second one). In the second source, some of attacks from this source is misclassified to the first source and some others to the third one. The attacks from the third source is classified in its own source about 77.91 % correctly, however the rest of attacks are misclassified to the second and fourth sources. The attacks in the fourth source has a similar situation to the first source (93 % correctly classified). All attacks from the fifth class are identified and there is no misclassification in this source (no red color).
Figure 5 shows the results obtained by the RBF-SVM classifier. It can detect the attacks correctly coming from five sources with 99.75 % from the first source, 95.39 % from the second source, 91.02 % from the third source, 99.31 % from the fourth source and all attacks from the last one.
Figure 6 presents the results for the BN classifier. It can be observed from this figure that the BN classifier is able to find 99.09 % of attacks from the first source, 97.95 % from the second source, 97.90 % from the third source, 96.97 % from the fourth source and all attacks coming from the fifth source. It can be observed from Figure 7 that the ANN classifier has a lower accuracy in detecting attacks with multiple sources.
Fig. 4:k-NN.
Fig. 5: RBF-SVM.
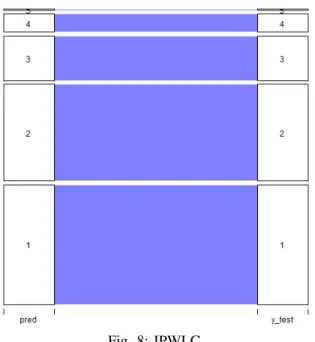
Although it has a high accuracy to detect the attacks from the first source (97.72 %) it is misclassified all attacks coming from the fourth and fifth sources, most of the attacks from the third source and some of the attacks from the second source. The results for the IPWLC algorithm are presented in Figure 8. The figure confirms the superior ability of the IPWLC algorithm in identifying attacks and their sources. It is able to find and classify approximately 99.95 % of all attacks and their sources correctly.
Fig. 6: BN.
Fig. 7: ANN.
V. CONCLUSIONS
In this paper we look at identifying multi-source cyber-attacks using machine learning approach. We applied the incre-mental piecewise linear classifier to identify malicious attacks and their resources. This classifier starts with the calculation of one linear function separating classes and adds more linear functions at each iteration of the incremental algorithm. The algorithm terminates if there is no significant improvement in the separation of classes. The usage of this algorithm allows us to classify malicious attacks from non malicious attacks with a high accuracy and a low computational cost. We conducted experiments using various numbers of mainstream classification algorithms on the multi-source real world cyber
Fig. 8: IPWLC.
security data set. The results confirmed the superior ability of the incremental piecewise linear classification algorithm in detecting cyber-attacks and their sources.
REFERENCES
[1] M. Abomhara and G.M. Koien. Cyber security and the internet of things: Vulnerabilities, threats, intruders and attacks. 2015.
[2] B. Anderson, C. Storlie, and T. Lane. Multiple kernel learning clustering with an application to malware. InIEEE 12th International Conference on Data Mining, pages 804–809, 2012.
[3] S. Andreev and Y. Koucheryavy. Internet of things, smart spaces, and next generation networking. Springer International Publishing, 2012. [4] L. Atzori, A. Iera, and G. Morabito. The internet of things: A survey.
Computer Networks, 54(15):2787 – 2805, 2010.
[5] A.M. Bagirov and J. Ugon. Supervised data classification via max-min separability. In Vaithilingam Jeyakumar and Alexander Rubinov, editors, Continuous Optimization: Current Trends and Modern Applications, pages 175–207. Springer US, 2005.
[6] A.M. Bagirov, J. Ugon, and D. Webb. An efficient algorithm for the incremental construction of a piecewise linear classifier. Information Systems, 36(4):782–790, 2011.
[7] Y. Benazzouz, C. Munilla, O. Gnalp, M. Gallissot, and L. Grgen. Sharing user iot devices in the cloud. In2014 IEEE World Forum on Internet of Things (WF-IoT), pages 373–374, 2014.
[8] A.L. Buczak and E. Guven. A survey of data mining and machine learning methods for cyber security intrusion detection. IEEE Commu-nications Surveys Tutorials, 18(2):1153–1176, 2016.
[9] L. Cheng, F. Liu, and D. Yao. Enterprise data breach: causes, challenges, prevention, and future directions.Wiley Interdisciplinary Reviews: Data Mining and Knowledge Discovery, 7(5).
[10] Y. Cheng, M. Naslund, G. Selander, and E. Fogelstrm. Privacy in machine-to-machine communications a state-of-the-art survey. In2012 IEEE International Conference on Communication Systems (ICCS), pages 75–79, 2012.
[11] M. Choras and R. Kozik. Machine learning techniques applied to detect cyber attacks on web applications.Logic Journal of the IGPL, 23(1):45– 56, 2015.
[12] P.R. Delanchy. <url: http://www.stats.ox.ac.uk/delanchy/network-intrusion-detection.html>.
[13] G. Fersi. A distributed and flexible architecture for internet of things. Procedia Computer Science, 73:130 – 137, 2015.
[14] J.B. Fraley and J. Cannady. The promise of machine learning in cybersecurity. InSoutheastCon 2017, pages 1–6, 2017.
[15] A. Gluhak, S. Krco, M. Nati, D. Pfisterer, N. Mitton, and T. Razafind-ralambo. A survey on facilities for experimental internet of things research. IEEE Communications Magazine, 49(11):58–67, 2011. [16] J. Gubbi, R. Buyya, S. Marusic, and M. Palaniswami. Internet of things
(iot): A vision, architectural elements, and future directions. Future Generation Computer Systems, 29(7):1645 – 1660, 2013.
[17] A.D. Kent. Cybersecurity data sources for dynamic network research. InDynamic Networks in Cybersecurity. Imperial College Press, 2015. [18] R.T. Kokila, S.T. Selvi, and K. Govindarajan. Ddos detection and
analy-sis in sdn-based environment using support vector machine classifier. In Sixth International Conference on Advanced Computing (ICoAC), pages 205–210, 2014.
[19] C. Kolias, G. Kambourakis, A. Stavrou, and J. Voas. Ddos in the iot: Mirai and other botnets. Computer, 50(7):80–84, 2017.
[20] M.V. Kotpalliwar and R. Wajgi. Classification of attacks using support vector machine (svm) on kddcup’99 ids database. InFifth International Conference on Communication Systems and Network Technologies, pages 987–990, 2015.
[21] M. Kuhn. Building predictive models in R using the caret package. Journal of Statistical Software, 28(5):1 –26, 2008.
[22] A. Pattanayak and M. Kirkland. Current cyber security challenges in ics. InIEEE International Conference on Industrial Internet (ICII), pages 202–207, 2018.
[23] E. Rader and R. Wash. Identifying patterns in informal sources of security information. Journal of Cyber Security, 1(1):121–144, 2015. [24] P.P. Ray. A survey on internet of things architectures. Journal of King
Saud University - Computer and Information Sciences, 30(3):291 – 319, 2018.
[25] R. Roman, J. Zhou, and J. Lopez. On the features and challenges of security and privacy in distributed internet of things.Computer Network, 57(10):2266– 2279, 2013.
[26] M. Rudner. Cyber-threats to critical national infrastructure: An intelli-gence challenge. International Journal of Intelligence and CounterIn-telligence, 26(3):453–481, 2013.
[27] R.K. Sharma, H.K. Kalita, and P. Borah. Analysis of machine learning techniques based intrusion detection systems. In Proceedings of 3rd International Conference on Advanced Computing, Networking and Informatics, pages 485–493. Springer India, 2016.
[28] F. Ullah and M.A. Babar. Architectural tactics for big data cybersecurity analytic systems: A review. CoRR, 2018.
[29] L.D. Xu, W. He, and S. Li. Internet of things in industries: A survey. IEEE Transactions on Industrial Informatics, 10(4):2233–2243, 2014. [30] S.A. Yadav, S.R. Kumar, S. Sharma, and A. Singh. A review of
pos-sibilities and solutions of cyber attacks in smart grids. InInternational Conference on Innovation and Challenges in Cyber Security (ICICCS-INBUSH), pages 60–63, 2016.
[31] G. Yan, R. Lee, A. Kent, and D. Wolpert. Towards a bayesian network game framework for evaluating ddos attacks and defense. In Proceed-ings of the 2012 ACM Conference on Computer and Communications Security, pages 553–566, New York, NY, USA, 2012.
[32] W. Zhou, Y. Jia, A. Peng, Y. Zhang, and P. Liu. The effect of iot new features on security and privacy: New threats, existing solutions, and challenges yet to be solved. IEEE Internet of Things Journal, 2018.