Research Paper
Chemotherapy and Stem Cell Transplantation Increase
p16
INK4a
Expression, a Biomarker of T-cell Aging
William A. Wood
a, Janakiraman Krishnamurthy
a,b, Natalia Mitin
a,b, Chad Torrice
a,b, Joel S. Parker
b,
Anna C. Snavely
a, Thomas C. Shea
a, Jonathan S. Serody
a, Norman E. Sharpless
a,b,⁎
a
Department of Medicine, The Lineberger Comprehensive Cancer Center, The University of North Carolina School of Medicine, Chapel Hill, NC, USA
b
Department of Genetics, The Lineberger Comprehensive Cancer Center, The University of North Carolina School of Medicine, Chapel Hill, NC, USA
a b s t r a c t
a r t i c l e i n f o
Article history: Received 12 March 2016
Received in revised form 16 August 2016 Accepted 19 August 2016
Available online 21 August 2016
The expression of markers of cellular senescence increases exponentially in multiple tissues with aging. Age-re-lated physiological changes may contribute to adverse outcomes in cancer survivors. To investigate the impact of high dose chemotherapy and stem cell transplantation on senescence markers in vivo, we collected blood and clinical data from a cohort of 63 patients undergoing hematopoietic cell transplantation. The expression of
p16INK4a, a well-established senescence marker, was determined in T-cells before and 6 months after transplant.
RNA sequencing was performed on paired samples from 8 patients pre- and post-cancer therapy. In patients
un-dergoing allogeneic transplant, higher pre-transplantp16INK4aexpression was associated with a greater number
of prior cycles of chemotherapy received (p = 0.003), prior autologous transplantation (p = 0.01) and prior
ex-posure to alkylating agents (p = 0.01). Transplantation was associated with a marked increase inp16INK4a
ex-pression 6 months following transplantation. Patients receiving autologous transplant experienced a larger
increase inp16INK4aexpression (3.1-fold increase, p = 0.002) than allogeneic transplant recipients (1.9-fold
in-crease, p = 0.0004). RNA sequencing of T-cells pre- and post- autologous transplant or cytotoxic chemotherapy demonstrated increased expression of transcripts associated with cellular senescence and physiological aging. Cytotoxic chemotherapy, especially alkylating agents, and stem cell transplantation strongly accelerate expres-sion of a biomarker of molecular aging in T-cells.
© 2016 The Authors. Published by Elsevier B.V. This is an open access article under the CC BY-NC-ND license (http://creativecommons.org/licenses/by-nc-nd/4.0/).
Keywords: Aging Senescence Exhaustion
1. Introduction
Hematopoietic stem cell transplantation (HSCT) is a potentially cu-rative modality for high-risk hematologic diseases, but the procedure has profound and long-term effects on recipient hematologic and im-mune function. The long-term toxicity of HSCT may result from chemo-radiotherapy given at the time of transplantation (condition-ing), from donor-host immune differences after allogeneic transplants or from accelerated stem cell exhaustion of transplanted stem cells (Hake et al., 2007). These late toxicities manifest as increased risk for in-fection, chronic graft-vs-host disease, bone marrow failure and acute leukemia.
Recent evidence has demonstrated that peripheral blood T-cells ex-press markers of cellular senescence with physiological aging. The over-all loss of physiological reserve that accompanies aging is associated
with an accumulation of senescent cells (Sharpless and DePinho,
2007; Rodier and Campisi, 2011). Cellular senescence is triggered by ac-tivation of tumor suppressor mechanisms associated with cellular
stressors, and results in expression of thep16INK4atumor suppressor
protein encoded by theCDKN2alocus, which has emerged as one of
the more useful markers of senescence in vivo (Campisi, 2013;
Sharpless and Sherr, 2015). Expression ofp16INK4ain peripheral blood
T lymphocytes increases exponentially with chronological age, doubling
about every decade (Zindy et al., 1997; Krishnamurthy et al., 2004; Liu
et al., 2009). Polymorphisms of senescence regulators have been
associ-ated with age-relassoci-ated conditions such as cancer, pulmonaryfibrosis,
glaucoma, atherosclerosis, and type II diabetes (Jeck et al., 2012; Siegel
et al., 2012). Prior work has shown that several age-promoting stressors such as smoking, physical inactivity and chronic HIV infection accelerate
the expression ofp16INK4aand other markers of cellular senescence (Liu
et al., 2009; Nelson et al., 2012). Importantly, we recently showed that cytotoxic chemotherapy, given in the adjuvant setting, markedly in-creases expression of senescence markers in the peripheral blood,
con-sistent with ~15 years of chronological aging (Sanoff et al., 2014).
Increasingly, older individuals are considered for autologous or allo-geneic transplantation. While age itself is usually not considered an ab-solute contraindication to transplantation, older individuals do have
⁎ Corresponding author at: The Lineberger Comprehensive Cancer Center, CB #7295,
Departments of Medicine and Genetics, The University of North Carolina School of Medicine, Chapel Hill, NC 27599-7295, USA.
E-mail address:[email protected](N.E. Sharpless).
http://dx.doi.org/10.1016/j.ebiom.2016.08.029
2352-3964/© 2016 The Authors. Published by Elsevier B.V. This is an open access article under the CC BY-NC-ND license (http://creativecommons.org/licenses/by-nc-nd/4.0/). Contents lists available atScienceDirect
EBioMedicine
higher risks of acute transplant-related toxicities such as cardiac
ar-rhythmias, diarrhea and mucositis (Wildes et al., 2014). Further,
age-related comorbid illness is itself prognostic for outcomes in autolo-gous and allogeneic transplant recipients, suggesting that functional, if not chronological, age of prospective transplant candidates is a po-tentially important variable for clinical decision-making. Lastly, sur-vivors of transplants, regardless of age, are at risk for accelerated acquisition of several age-related syndromes such as endocrine dys-function, cognitive impairment, cardiovascular morbidity, immune dysfunction, secondary neoplasms, and neuromuscular impairment (Fried et al., 2001).
In murine models, serial transplantation per se, in the absence of ex-posure to cytotoxic agents, is associated with accelerated aging of
he-matopoietic stem cells (HSC), manifesting as ‘HSC exhaustion’
(Harrison and Astle, 1982). Likewise, evidence suggests HSC exhaustion occurs in humans as well. HSC yields for autologous transplant from
pa-tients that have undergone significant prior chemotherapy are signifi
-cantly depressed compared to yields from less heavily treated
individuals (Clark and Brammer, 1998), and the transplantation of
in-sufficient numbers of HSC is associated with long term graft failure
(Perez-Simon et al., 1999). Additionally, transplantation is associated with an increased rate of telomere shortening, which has been
associat-ed with certain adverse outcomes in transplant recipients (Lee et al.,
1999; Lewis et al., 2004; Akiyama et al., 2000; Pipes et al., 2006). Be-cause individuals with hematologic malignancies have an increasing array of transplant approaches of varying intensity as well as non-trans-plant treatment approaches available to them, understanding the im-pact of treatment upon functional aging may have important implications for the care of both prospective transplant candidates as well as transplant survivors. Toward that end, we measured expression ofp16INK4a, a marker of molecular age that can be serially assessed, in
HSC-derived T-cells before and after stem cell transplantation. Addition-ally, we performed whole transcriptomic RNA sequencing in a subset of paired samples to further examine the effects of chemotherapy or trans-plantation on T-cell function.
2. Materials and Methods
2.1. Patients
For the transplant patient population, participants were over the age of 18 and underwent either autologous or allogeneic stem cell transplantation for any hematologic malignancy between 2010 and 2013 at the University of North Carolina (UNC) Hospitals. Patient samples were obtained from two non-randomized, non-blinded ob-servational cohorts: a study investigating symptom burden after transplantation, and a generic tissue procurement protocol. Studies
were approved by the UNC Institutional Review Board (11–0600
and 13–1705), with study procedures confirming to standards
indi-cated by the Declaration of Helsinki. Eligible patients were identified
from the electronic medical records and approached by research personnel prior to scheduled transplantation for provision of signed informed consent. Patients undergoing concurrent radiation, che-motherapeutic, or investigational therapy other than transplant-re-lated therapy were excluded. All patients received standard-of-care therapies and treatments as clinically needed. Medical history and treatment information were abstracted from the medical record. Samples were obtained in both cohorts from just before transplanta-tion, and paired samples from 6 months post-transplantation were also obtained if available. Molecular analyses were performed by in-vestigators blinded to patient data, and inin-vestigators collecting clin-ical information were blinded to laboratory results until data collection was complete. For the breast cancer patient population,
T-cell RNA collected in the study Sanoff et al. (Sanoff et al., 2014)
was used in the RNA sequencing analysis.
2.2. Assessment of p16INK4aexpression
See Sanoff et al. (Sanoff et al., 2014) for details. In brief, CD3+T-cells
were isolated from up to 10-ml of peripheral blood using anti-CD3
microbeads and an AutoMACSPRO separator (Miltenyi Biotec, San
Diego, CA). Purity of T cells was determined to be ~95% when isolated from fresh blood and ~ 50% when isolated from cryopreserved PBMCs in pilot experiments. T cell purity in clinical trial samples was monitored
by measuring expression of the gamma subunit of theCD3. Total RNA
was isolated using RNeasy Mini Kit (Qiagen) and cDNA were prepared using ImProm-II reverse transcriptase kit (Promega). Expression of p16INK4awas measured by TaqMan quantitative reverse-transcription
polymerase chain reaction specific for p16INK4aand normalized to
YWHAZhousekeeping gene (Mane et al., 2008; Dheda et al., 2004).
2.3. RNA Sequencing
RNA was extracted and rRNA was removed using the Ribo-Zero kit. RNA libraries were prepared by using the Illumina TruSeq RNA Sample Preparation Kit v2 and then sequenced by Illumina HiSeq2000. Reads
were subjected to quality control as previously described (Cancer
Genome Atlas Research, 2012). RNA reads were aligned to human
hg19 genome assembly using Mapsplice (Wang et al., 2010). Gene
def-initions were obtained from the UCSC known Gene table. Gene
expres-sion was estimated using RSEM (RNA-Seq by Expectation
Maximization) (Li and Dewey, 2011). Genes differentially expressed
due to treatment were identified by DESeq2 (Love et al., 2014) using a
bivariate model to adjust for subject specific effects. The resulting
statis-tics were subjected to gene set enrichment analysis by using the GSEA
(Gene Set Enrichment Analysis) rank test (Subramanian et al., 2005).
Expression estimates were normalized to afixed upper quartile and
log2 transformed prior to visualization.
2.4. Statistical Analyses
The sample size was determined by the availability of clinical speci-mens from the two study cohorts as described. Log2-transformed p16INK4aexpression values were standardized through conversion to Z-score to facilitate combining the two sample sets. Z-scores were calcu-lated separately for the two transplant cohorts using the formula:
Zi¼ðXi−μÞ=σ
whereμis population mean, andσis standard deviation.
For samples present in both cohorts, individual Z scores were
aver-aged. Associations betweenp16INK4aexpression and pre-transplant
var-iables were performed using linear regression (for continuous variables) or one-way analysis of variance (for categorical variables). A
pairedt-test was used to comparep16INK4aexpression before and after
transplant. Data were analyzed by N. Mitin using JMP11 (SAS, Cary,
NC) and A. Snavely using R. All tests of statistical significance were
two-sided. P values of 0.05 or less were considered statistically
significant.
3. Results
Two observational cohorts (Table 1) were combined for our analysis,
and the baseline characteristics of the aggregated cohort are shown in Table 2. In order to compare samples analyzed from the two
observa-tional cohorts, we converted allp16INK4aexpression values to a
normal-izedZ-score as described in the methods. Using this conversion, we found excellent correlation among Z-scores for the 17 patients that
had separate samples obtained in both cohorts (Table 3), suggesting
the aggregation of the observational cohorts for analysis is valid. In the combined cohort there were 26 unique patients who underwent
transplantation, for a total of 63 unique patients (Table 2). A majority of autologous transplant recipients had myeloma, and the rest had lymphoma as an underlying diagnosis. Most allogeneic transplant recipients had leukemia as their underlying diagnosis. Five allogene-ic transplant recipients had previously undergone autologous transplantation.
Among autologous HSCT recipients, there were no baseline
charac-teristics that were associated with pre-transplantp16INK4aexpression.
Among allogeneic HSCT recipients, however, a greater number of cycles of chemotherapy received before allogeneic transplant, history of prior autologous transplantation, and history of alkylating agent exposure
were all significantly associated with higher pre-transplantp16INK4a
ex-pression (pb0.01 for each,Table 4A and B). In accord with results in
pa-tients treated with chemotherapy for breast cancer (Sanoff et al., 2014),
prior exposure to alkylating agents was associated with a 1.9-fold
in-crease inp16INK4aexpression (absolute value, log2 = 0.91). Moreover,
there was a 2.3-fold increase inp16INK4aexpression level (absolute
value, log2 = 1.22) in the small number of allogeneic patients that had undergone prior autologous transplant. Previously, we have
shown that a 2-fold increase inp16INK4aexpression is equivalent to
~10 years of chronological aging (Sanoff et al., 2014). Therefore, these
data suggest that extensive exposure to alkylating agents or autologous transplantation is equivalent in molecular terms to a chronological
decade or more increase in the chronological age of Peripheral Blood T-Lymphocytes (PBTL).
Next, we determined the effects of HSCT on molecular age of PBTL as
measured byp16INK4aexpression by comparing pre- and post-HSCT
p16INK4alevels within an individual. As shown inTable 5, hematopoietic
stem cell transplantation was associated with a significant increase in
p16INK4aexpression levels for both autologous and allogeneic transplant
recipients. Allogeneic transplant recipients showed a pronounced
in-crease inp16INK4aexpression post-HSCT (1.93-fold, p = 0.0004). In
the allogeneic setting, the PBTL pre-HSCT were derived from the host, whereas the PBTL post-HSCT were largely if not entirely donor-derived (given near 100% chimerism in patients post-engraftment). Since the hosts, who generally were transplanted for AML, had experienced prior chemotherapy and, in a small number of cases, auto-HSCT, we
would expect that the pre-HSCT levels ofp16INK4awould be
consider-ably higher than the expression ofp16INK4ain their healthy donors.
Therefore, the measured change inp16INK4afrom pre-HSCT to
post-HSCT in allogeneic recipients likely underestimates the age-promoting effects on the graft of HSCT, given that the pre-HSCT levels were
Table 1
Summary of clinical samples used in this study.
Number of samples
Symptom burden observational studya
Baseline samples 28
Autologous transplant 8
Allogeneic transplant 20
6-month follow up samples 16
Autologous transplant 5
Allogeneic transplant 11
Tissue procurement observational study
Baseline samples 35
Autologous transplant 18
Allogeneic transplant 17
6-month follow up samples 11
Autologous transplant 1
Allogeneic transplant 10
a
17 patients participating in the symptom burden study also had specimens stored in the tissue procurement facility and collected in the second cohort. In all, 21 samples were shared between the two cohorts- 17 baseline samples and four 6-month follow-up sam-ples. These samples are not counted in the second cohort summary table above.
Table 2
Baseline characteristics of hematopoietic stem cell transplantation (HSCT) patients in this study.
Characteristic Autologous HSCT Allogeneic HSCT Total
N 26 37 63
Age (mean (SD)) 59.0 (8.6) 54.2 (11.4) 56.2 (10.5)
Gender
Male 15 (58%) 24 (65%) 39 (62%)
Female 11 (42%) 13 (35%) 24 (38%)
Race
Caucasian 24 (92%) 30 (81%) 54 (86%)
Malignancy
Myeloma 14 (54%) 1 (3%) 15 (24%)
Lymphoma 10 (38%) 4 (11%) 14 (22%)
Acute leukemia 0 19 (51%) 19 (30%)
Prior treatments
Chemotherapy exposure in months (mean (SD)) 6.6 (5.2) 7.2 (10.2) 7.0 (8.5)
Number of chemotherapy regimens (mean (SD)) 1.9 (1.2) 2.4 (1.7) 2.2 (1.5)
Number of chemotherapy cycles (mean (SD)) 8.0 (5.2) 5.9 (5.0) 6.8 (5.1)
Anthracycline 13 (50%) 22 (59%) 35 (56%)
Nucleoside analogue 4 (15%) 22 (59%) 26 (41%)
Lenalidomide or thalidomide 14 (54%) 2 (5%) 16 (25%)
Bortezomib 12 (46%) 0 12 (19%)
Prior Autologous transplant 1 (4%) 4 (11%) 5 (8%)
Comorbidity score (HCT-CI) (mean (SD)) 3.7 (2.8) 2.7 (2.0) 3.1 (2.4)
Table 3
Comparison ofp16INK4aexpression levels in T cells isolated from fresh blood (symptom
burden cohort (SB)) or frozen PBMCs (tissue procurement cohort (TP)). A Z score was cal-culated for samples in each cohort and the values of 20 samples shared between cohorts is
shown (r2
= 0.6).
p16_SB p16_TP
A101 1.83 0.34
A103 −1.34 −1.40
A108 6 months −0.33 0.14
A108 BL −0.74 −1.94
A109 6 months 0.44 0.68
A109 BL −1.52 −1.04
A110 −1.59 −0.50
A202 −0.50 −0.96
A203 0.52 −0.05
A204 0.13 1.39
A208 6 months 1.55 1.90
A208 BL −0.63 −1.17
B202 6 months −0.39 0.65
B202 BL −0.61 −0.54
B204 −1.32 −1.45
B205 0.06 −0.38
B206 0.94 2.05
B209 −0.63 −0.26
B211 1.61 1.27
elevated in the recipients from prior therapeutic exposure. In the alloge-neic HSCT setting, it is possible that other unaccounted factors (e.g. post-transplant calcineurin-inhibitor exposure) may have also contrib-uted to the observed effect.
In order to directly measure the effects of human HSCT per se on mo-lecular age, we turned to an analysis of patients undergoing autologous
HSCT. In accord with ourfinding that autologous HSCT prior to
allogene-ic transplant was associated with elevatedp16INK4ain pooled patients
(Table 4), we noted that within any given patient, autologous HSCT
was associated with a marked increase inp16INK4aexpression from
pre-transplant to 6 months post-transplant (3.05-fold, p = 0.002).
Thisfinding suggests that the forced bone marrow repopulation
associ-ated with transplantation per se accelerates the molecular aging of
PBTL, in the absence of significant chemotherapy exposure to the graft.
3.1. Relationship of Transplantation and Chemotherapy with Peripheral Blood T-cell Gene Expression
To further understand the long-term effects of DNA damaging agents and HSCT on PBTL, we performed whole transcriptome RNA se-quencing before and after cancer therapy. In order to identify
transcrip-tional changes that were not specific to a particular noxious insult, but
instead were induced by the generic insult of forced bone marrow re-generation, we performed an analysis of samples pre- and post-autolo-gous transplantation (3 pairs of samples) or pre- and post-cytotoxic chemotherapy (5 pairs of samples). In order to focus on durable changes
to the T-cell transcriptome, PBTL were collected 6 months
post-autolo-gous HSCT or 6–12 months post-adjuvant chemotherapy with
doxoru-bicin and cyclophosphamide for breast cancer (these samples are
described in (Sanoff et al., 2014)). We performed whole transcriptome
RNA sequencing of ribosome depleted total RNA on pre- and
post-ther-apy T-cell samples, and compared expression profiles through pairwise
supervised analysis. This approach identified a signature of ~500 coding
transcripts whose expression was significantly (adjusted
p-valueb0.05) and durably altered by these types of cancer therapy. If
re-stricted to genes whose expression changedN1.9-fold from baseline, we
identified 134 coding transcripts that significantly increased in
expres-sion, and 47 transcripts that significantly decreased in expression
(Supp. Tables 1, 2), which are presented as a representative subset in Fig. 1and overall by hierarchical clustering inFig. 2. These data demon-strate a potent and lasting effect on transcription of the T-cell organ after forced bone marrow regeneration.
In order to determine the effects of auto-transplant or chemotherapy on T-cell function, we performed several types of bioinformatic analysis on these RNA sequencing data. We used gene set enrichment analysis (GSEA) and supervised gene set analysis (SAM-GSA) to compare the genes altered by cancer therapy to ~8000 known gene sets in the
Molec-ular Signatures database (Subramanian et al., 2005). These analyses
identified a large number of published signatures with significant
over-lap with our gene list, of which the vast majority (N90%) were
immuno-logic. Using an adjusted p-value of 0.05, 211 gene sets significantly
overlapped with transcripts more highly expressed in the pre-therapy samples (Supp. Table 3), and 98 overlapped with transcripts that were more highly expressed in the post-therapy samples (Supp. Table 4). Hi-erarchical clustering of representative GSEA signatures are shown in Figs. 3–7. These GSEA results appear to be predominantly explained by changes in the composition of the CD3 + fraction of lymphocytes post-cancer therapy. For example, transcripts that were more highly expressed in memory CD4 + cells relative to naïve cells increased
after cancer therapy (Fig. 3), and the same was true for transcripts
that were more highly expressed in effector memory compared to
central memory CD4 + cells (Fig. 4). Transcripts that were more
highly expressed in regulatory T cells compared to conventional T
cells also increased following cancer treatment (Fig. 5). As shifts
from central memory and naïve cells to effector cells and Tregs are
hallmark changes of peripheral T-cells with aging (Desai et al.,
2010), these data provide further evidence that cancer therapy
ac-celerates the changes in T-cell subsets that are associated with aging of the cellular immune system.
An analysis of specific genes altered by cancer therapy was also
illu-minating (selected transcripts are clustered inFig. 1). For example, we
observed a robust increase in transcripts associated generally with
cel-lular senescence (e.g.CDKN2a,IL8,HMGA2,CCL4) (Narita et al., 2006;
Acosta et al., 2008; Hammond and Sharpless, 2008; Cheng et al., 2015)
or telomere shortening in T-cells (e.g. KLRK1, NUAK1, DSP, PIF1)
(Humbert et al., 2010; Soriani et al., 2014; Textor et al., 2011; Lansdorp, 2007; Robin et al., 2014). Additionally, we noted changes that have been previously associated with T-cell aging and
immunosenescence: decreasedCD28expression (Effros et al., 1994)
and increased expression of several NK markers (e.g.CX3CR1,KLRK1,
KLRA1) (Goronzy and Weyand, 2005; Sciume et al., 2011; Bauer et al., 1999; Bull et al., 2000). Consistent with the GSEA results and known patterns of human T-cell aging, there was a relative depletion of
Table 4
Pre-transplantp16INK4aexpression is associated with amount and type of pre-transplant
chemotherapy and history of prior autologous transplant in univariate analysis. Linear re-gression analysis (A) and one-way analysis of variance (B) demonstrate association of p16INK4a
with patient's characteristics and therapies.
A
Baseline characteristic
Autologous HSCT (N = 26)
Allogeneic HSCT (N = 37)
Estimate (log 2)
p-Value Estimate (log 2)
p-Value
Age −0.002 0.94 0.001 0.92
Comorbidity score (HCT-CI) −0.081 0.18 −0.40 0.60
Number of cycles of chemotherapy
0.014 0.68 0.086 0.003
B
Baseline characteristic
Autologous HSCT (N = 26)
Allogeneic HSCT (N = 37)
Difference (log 2)
p-Value Difference (log 2)
p-Value
Prior autologous transplant NA NA 1.22 0.01
Exposure to alkylator–incl
prior auto
0.20 0.56 0.91 0.01
Exposure to alkylator–not incl
prior auto
0.19 0.6 0.62 0.13
Exposure to anthracycline 0.28 0.41 −0.04 0.91
Exposure to nucleoside analogue
0.70 0.13 −0.23 0.45
Exposure to lenalidomide or thalidomide
−0.04 0.91 0.75 0.26
Exposure to bortezomib 0.05 0.88 NA NA
Table 5
High-dose chemotherapy increasesp16INK4a
expression. Changes inp16INK4a
expression between baseline and follow-up in aggregated cohort in autologous-HSCT, allogeneic-HSCT or breast cancer patients.
Treatment type Pre-treatment log2p16 Post-treatment log2p16 Change inp16INK4a
expression P-value
Autologous HSCT (mean (95% CI)); N = 6 −0.88 (−1.44,−0.32) 0.73 (0.20, 1.27) 3.05 0.002
Allogeneic HSCT (mean (95% CI)); N = 21 −0.13 (−0.53, 0.27) 0.82 (0.53, 1.11) 1.93 0.0004
transcripts associated with central memory cells with an enrichment of
transcripts associated with effector CD8+ T-cells (e.g. decreasedCCR7
andIL7Rα, with increasedGZMB,CD8aand NK markers (Fig. 1)). In
ac-cord with these processes, we observed that cancer therapy induced the expression of transcripts that are more highly expressed in T-cells
from old versus young donors (Fig. 6). The effects on transcripts
associ-ated with T-cell exhaustion were less consistent: a few well-recognized
markers of exhaustion significantly increased post-bone marrow insult
(e.g. CD160 and LAG3,Fig. 1), whereas published signatures of T-cell
ex-haustion demonstrated a mixed pattern of expression in GSEA analysis (Fig. 7, see also Tables 8 and 9). These gene-specific data provide
evi-dence beyond changes top16INK4a(Table 2) that generic types of
hema-topoietic injury (e.g. forced bone marrow repopulation, cytotoxic chemotherapy) induces durable transcriptional changes characteristic of T-cell aging and immunosenescence, suggesting these insults acceler-ate T-cell molecular aging.
4. Discussion
In this work, we show that that DNA damaging chemotherapy and stem cell transplantation potently induce the transcriptional changes characteristic of aging in PBTL. This includes both changes associated with an altered composition of the T-cell organ with aging (e.g. de-creased naïve and central memory cells versus inde-creased effector mem-ory cells and Tregs) as well as changes associated with telomere shortening and cellular senescence. While the notion that DNA damag-ing agents induce cellular senescence in vivo is non-controversial, a
re-markable aspect of this work is thefinding that autologous HSCT
markedly induces the transcriptional changes of PBTL aging. For
exam-ple, auto-HSCT increases the expression ofp16INK4a, a highly dynamic
marker of senescence, to a degree comparable ~30 years of
chronologi-cal age. A similar increase inp16INK4aexpression with auto-HSCT has
been reported in myeloma patients (Rosko et al., 2015). As the autograft
A109 A105 A103 1033 1022 1015 1009 1006 A109 A105 A103 1033 1022 1015 1009 1006
LAG3 CD160 KLRK1 KLRA1 CX3CR1 CD8A IFNG GZMB PIF1 DSP NUAK1 KLRK1 CD28 CDKN2A HMGA2 CCL4 IL8
−4 −2 0 2 4 Value
Color Key
Pre-Treatment Post-Treatment
Exhaustion
NK
Effector
Telomeres
Senescence-Associated
Fig. 1.A hierarchical clustering of representative transcripts whose expression significantly changes with cancer therapy (3 pair of auto-HSCT samples or 5 pair of chemotherapy-treated samples) in peripheral blood T-cells (CD3+). Pre-treatment samples are on the left (grey bar above the heatmap) and post-treatment samples are on the right (blue bar). Genes of interest
are ordered along the y-axis as described in theResultssection, with color-coding indicated to the left of the heatmap (purple = senescence associated; light blue = telomere shortening;
brown = effector; yellow = NK; orange = exhaustion). Sample numbers are shown below the heatmap, with an“A”prior to sample numbers indicating patients undergoing auto-HSCT.
is not exposed to DNA damaging chemotherapy, this observation sug-gests that the forced proliferation that accompanies BM re-engraftment, even in the absence of exogenous clastogens, may be age-promoting in humans.
In accord with prior work (Sanoff et al., 2014), we observed
relative-ly increased expression of PBTLp16INK4ain pre-treatment samples from
patients undergoing allogeneic, but not autologous stem cell transplant.
This observation likely reflects differences in prior therapy between
these two patient groups: with allogeneic HSCT patients having re-ceived high doses of alkylating agents and anthracyclines for acute leu-kemia, whereas autologous patients received largely non-cytotoxic anti-myeloma therapies such as bortezomib and lenalidomide. This ob-servation suggests that cytotoxic chemotherapy may be more age-pro-moting than non-cytotoxic drugs used for myeloma, and is consonant with the practice of avoiding alkylating agents in patients with
myelo-ma because such drugs impair subsequent stem cell collection (Clark
and Brammer, 1998).
It is perhaps surprising that autologous HSCT induces the strongest
effect on PBTL molecular age, as measured byp16INK4aexpression, of
any noxious stimulus to date tested, including cytotoxic chemotherapy
(Sanoff et al., 2014), chronic HIV infection (Nelson et al., 2012), tobacco
use (Liu et al., 2009) or physical inactivity (Liu et al., 2009). We believe
the most likely explanation for thisfinding is that the forced BM
regen-eration that accompanies re-engraftment induces intrinsic HSC aging.
Serial transplant readily‘exhausts’HSC in murine models (Harrison,
1979), leading to a‘myeloid skewing’characterized by a marked decline
in the per HSC capacity to produce naïve T-cells (Janzen et al., 2006), an
observation that is in accord with our RNAseq analysis (Fig. 3).
Further-more, though pre-treatment samples from patients undergoing
alloge-neic HSCT had higher PBTLp16INK4a expression than those from
patients undergoing autologous HSCT, it is possible that pre-transplant therapy had some age-promoting effect upon PBTLs in autologous HSCT recipients. Thus, in combination with forced BM regeneration,
PBTLs of autologous HSCT recipients were“aged”twice due to therapy
and then transplant, possibly helping to explain the larger effect on PBTLp16INK4aexpression from autologous in comparison with
allogene-ic HSCT.
Beyond an effect on HSC, however, it is possible that damage to other tissues contributes to this effect. For example, the thymus is damaged by pre-transplant conditioning with high-dose chemotherapy, and it is
A109 A105 A103 1033 1022 1015 1009 1006 A109 A105 A103 1033 1022 1015 1009 1006
SNORA23 SNORA74B SNORA62 PLCL1 HOOK1 SLC16A10 SNORA5A SNORD22 SNORA67 SNORA84 SNORA27 SNORA57 SNORA68 SNORA3 SNORA31 SNORA14B SNORA20 SNORA38B SNORA50 SNORA26 SNORA38 SNORA76 WWC2 SNORA22 ACVR1C C14orf132 AKR1E2 GNG7 NGFRAP1 PTK2 FAM153B RBM11 AK5 LOC100271722 STAP1 C6orf105 MMP28 IGF1R KBTBD11 SCML1 EDAR LRP6 CCR7 PFN2 GSTM3 PLAG1 DSC1 TCEA3 DUSP5 ANKRD20B IFNG FADS2 LOC441666 TNFSF9 C17orf91 ITGAM ZEB2 KLRC4 GPR56 NMUR1 MAP1B KIF19 MLC1 GNLY FGFBP2 CCL4 GZMH PDGFD CDCA7 C1orf21 GZMB APOB CSMD3 ZFHX4 GOLGA6L6 ERBB4 SGCD JAKMIP1 KCNK5 RGNEF FZD4 HMGA2 C6orf168 SCD5 MUC16 RNF165 LOC643677 ONECUT2 FREM2 KLRC3 LPAL2 NUAK1 SLC1A7 GRIN2C LRRC16B PDGFRB ESR2 LOC144571 CMKLR1 SPON2 LOC100130872 FAM179A B3GAT1 MYO3B XPNPEP2 PIK3R3 PRR5L KLRD1 SLAMF7 ELOVL6 MKI67 LAG3 ZNF462 B4GALT2 KLRK1 GPR44 SOX13 PLXNA4 SH3D19 PLEK SETBP1 RGS9 FASLG NKG7 ASCL2 PRSS23 TTC38 ADRB2 SLCO4C1 FCRL6 GPR114 PTGDR LGR6 WDR63 GPR153 OSBPL5 KCNH1 CLIC3 SLAMF8 ZNF683 CD8A TBX21 DLG5 PRF1 STYK1 RCAN2 C10orf128
−3 −2 −1 0 1 2 3 Value
Color Key
Pre-Treatment Post-Treatment
Fig. 2.A hierarchical clustering of all transcripts whose expression significantly changes with cancer therapy (3 pair of auto-HSCT samples or 5 pair of chemotherapy-treated samples) in peripheral blood T-cells (CD3+). Pre-treatment samples are on the left (grey bar above the heatmap) and post-treatment samples are on the right (blue bar). Sample numbers are shown
below the heatmap, with an“A”prior to sample numbers indicating patients undergoing auto-HSCT. Samples without an“A”indicate patients treated with chemotherapy and not
likely that graft-derived T-cells produced via a dysfunctional thymus
ex-hibit accelerated aging (Min et al., 2005; Montecino-Rodriguez et al.,
2013; Dorshkind et al., 2009; Linton and Dorshkind, 2004). Moreover, it is possible that not all host hematopoietic stem cells and self-renewing T-cells are destroyed by the conditioning regimen, and these surviving cells could exhibit accelerated aging as a result of exposure to conditioning. Since our analysis is performed on pooled PBTL, even
a rare population of surviving cells that highly expressp16INK4acould
af-fect a post-transplant sample's results. While such efaf-fects could afaf-fect
PBTLp16INK4, it is unlikely that thymic damage or very rare surviving
host T-cells would cause the wholesale transcriptional effects observed in the RNAseq analysis.
Ourfinding that post-transplant senescent T-cells were biased
to-ward the expression of transcripts associated with CD8+ effector cells and NK cells is consistent with prior studies of T-cell aging and
immunosenescence. (Perillo et al., 1993; Jaruga et al., 2000; Lemster et
al., 2008). In aggregate, our work and other studies suggest that noxious stimuli such as DNA damage, telomere shortening and forced regenera-tion mimic the effects of chronologic age to augment the producregenera-tion of hypo-replicative T-cells with distinct immunophenotype (e.g. CD8 + CD28-) that express effector molecules such as Granzyme B and NK markers as well as markers of cellular senescence (e.g. p16INK4aand IL8). Such senescence-promoting stimuli have a more
com-plex effect on markers of T-cell exhaustion, leading to increased expres-sion of some exhaustion-associated markers and decreased expresexpres-sion
of others. Thisfinding is in accord with the notion that there are at
least two different types of severely hyporeplicative states induced by
excess T-cell proliferation—cellular senescence and exhaustion (Akbar
and Henson, 2011)—with our work suggesting forced replication and DNA damaging agents induce the former, but not the latter, in humans. This work has several implications. First, it is possible that an assess-ment of T-cell molecular age could be used to predict suitability for transplantation. In fact, prior studies have shown that older autologous HSCT recipients have a higher likelihood than younger recipients of fail-ing to achieve complete peripheral blood count recovery at 1 year, par-ticularly true in patients who have been exposed to prior cytotoxic
chemotherapy (Woolthuis et al., 2014; Bhatia et al., 2005). Such a use
would be similar to the suggestion that a renal allograft's molecular
age, as measured byp16INK4aexpression, is a stronger predictor of
long-term graft function than donor age or telomere length (Koppelstaetter et al., 2008; McGlynn et al., 2009; Gingell-Littlejohn et al., 2013). Larger studies with longer follow-up would be needed to
con-firm the hypothesis that donor molecular age of HSC influences
long-term hematopoietic graft function. Second, post-transplant T-cell senes-cence may have important implications with regard to T-cell function, with an increase in the frequency of senescent T-cells leading to greater long-term risk of infection or decreased response to vaccination (Targonski et al., 2007). Additionally, if increased molecular age of PBTL is the result of intrinsic HSC aging, this marker could also perhaps predict other late complications of HSCT such as bone marrow failure,
MDS or secondary leukemia. Third, thefinding that HSCT and DNA
dam-aging agents promote the molecular dam-aging of T-cells suggests such
A105 1033 A109 A103 1006 1009 1022 1015 A105 1033 A109 A103 1006 1009 1022 1015
CRYBG3 CCR6 CD28 MIAT OSBPL3 DUSP5 IFNG MYO1F PREX1 CCL5 EFHD2 SAP30 CD58 FAM129A MYBL1 TMEM200A GZMA HOPX TTYH2 NPDC1 TBX21 ZC3H AV1L STOM CTSC PPP1CA NPC1 ATXN1 PRR5L ACTN4 RGS3 ATP2B4 SLC9A3R1 CXCR3 TLR3
Pre-Treatment Post-Treatment
Fig. 3.A hierarchical clustering of transcripts from a Gene Set Enrichment Analysis Signature (GSE11057) with increased expression in memory CD4+ cells compared to naïve cells.
Pre-treatment samples are on the left (grey bar above the heatmap) and post-Pre-treatment samples are on the right (blue bar). Sample numbers are shown below the heatmap, with an“A”prior
to sample numbers indicating patients undergoing auto-HSCT. Samples without an“A”indicate patients treated with chemotherapy and not transplantation. Samples are ordered along
agents may compromise the post-transplant ability to respond to ther-apies intended to activate exhausted T-cells (e.g. anti-PD1 antibodies).
Finally, the significant increase in T-cell senescence after HSCT further
raises questions about the potential long term risks related to accelerat-ed aging in recipients of two transplants (e.g. tandem autologous trans-plantation). For diseases in which credible non-transplant treatment
approaches exist, pre-transplant“molecular age”and subsequent risk
for further transplant-related accelerated aging could impact clinical de-cision-making.
We acknowledge limitations to our work. First, we did not have data to demonstrate a correlation between the observed changes in biomarker
expression with T cell function. However, inasmuch asp16INK4a
expres-sion is arguably one of the best in vivo markers of cellular senescence
and is directly associated with age-related deterioration (Baker et al.,
2016), the signal of increased senescence early after transplantation is
clear and concerning, even if a clearer explanation of this phenomena quires further study. Second, other aspects of post-transplant immune
re-constitution also influence the relative contribution of CD8 and CD4 T
cells to the CD3 population in the early post-transplant period. Third,
the relative contribution of clinical factors to PBTLp16INK4aexpression,
in-cluding graft versus host disease, infection, and use of immunosuppres-sive agents, could not be discerned in this analysis. Fourth, we did not have sequential longitudinal post-transplant samples available to study
changes inp16INK4aexpression over time. Fifth, donor samples were
limited. We were unable in this study to determine the source of the T cells that were undergoing changes in biomarker expression following al-logeneic transplantation; a clear idea of which cells were donor-derived and which were recipient-derived would help to discern the relative
ef-fects of chemotherapy vs transplant uponp16INK4aexpression.
In summary, we have shown that HSCT and cancer therapy strongly
increase the expression in T cells ofp16INK4a, a well-known biomarker of
cellular senescence. Further, this likely occurs via an effect on
hemato-poietic stem cells.p16INK4aexpression was markedly increased
follow-ing transplantation, and in association with amount and certain types of chemotherapy. This observation may have implications for the man-agement of patients with cancer as well as cancer survivors, in order to limit pro-aging effects of treatment and to protect against the develop-ment of frailty and other aging-related syndromes. Additional studies to investigate the relationships between T-cell aging and adverse out-comes following cancer therapy are warranted.
Supplementary data to this article can be found online athttp://dx.
doi.org/10.1016/j.ebiom.2016.08.029.
Funding Sources
This work was supported by NIH grant 2 R01 AG024379 11A1, The
Role ofp16INK4in Mammalian Aging, PI Norman Sharpless. The funder
has no role in data collection or analysis in this research.
1022 1015 1033 A103 A105 A109 1006 1009 1022 1015 1033 A105 A103 A109 1006 1009
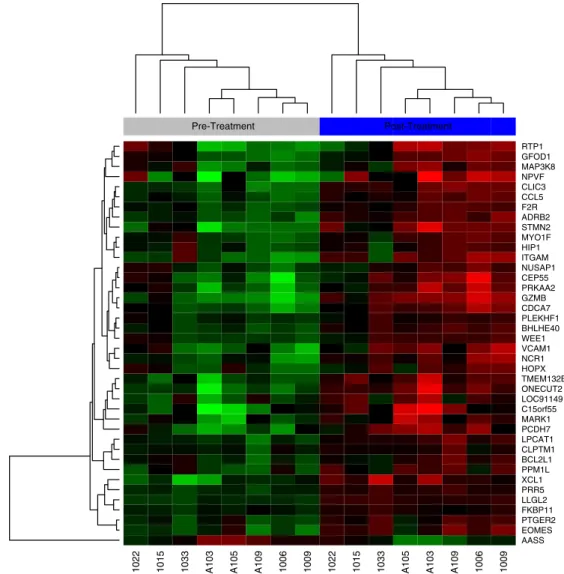
AASS EOMES PTGER2 FKBP11 LLGL2 PRR5 XCL1 PPM1L BCL2L1 CLPTM1 LPCAT1 PCDH7 MARK1 C15orf55 LOC91149 ONECUT2 TMEM132B HOPX NCR1 VCAM1 WEE1 BHLHE40 PLEKHF1 CDCA7 GZMB PRKAA2 CEP55 NUSAP1 ITGAM HIP1 MYO1F STMN2 ADRB2 F2R CCL5 CLIC3 NPVF MAP3K8 GFOD1 RTP1
Pre-Treatment Post-Treatment
Fig. 4.A hierarchical clustering of transcripts from a Gene Set Enrichment Analysis Signature (GSE26928) with increased expression in effector memory compared to central memory CD4 + cells. Pre-treatment samples are on the left (grey bar above the heatmap) and post-treatment samples are on the right (blue bar). Sample numbers are shown below the
heatmap, with an“A”prior to sample numbers indicating patients undergoing auto-HSCT. Samples without an“A”indicate patients treated with chemotherapy and not
Conflict of Interest Statement
N.M. and N.E.S. are founders and hold equity in HealthSpan Diagnos-tics, which is developing clinical grade assays for molecular aging relat-ed to this work. K.J. and N.E.S. are inventors on an issurelat-ed patent relatrelat-ed to this work.
Author Contributions
W.A.W., J.K., N.M., C.T., J.S.P, T.C.S, J.S.S, and N.E.S. designed the re-search, performed rere-search, and analyzed data. A.C.S. contributed to the statistical analysis. W.A.W. and N.E.S. wrote the paper. All authors contributed to the critical review and editing of the manuscript.
Acknowledgements
The authors wish to acknowledge the contributions of Hanna Sanoff,
whose Breast Cancer Samples (Sanoff et al., 2014) were used in the
cur-rent analysis; Wenjin Liu, who contributed to the analysis of the RNA se-quencing data; and Lei Lei, who contributed to the clinical data acquisition and analysis.
References
Acosta, J.C., O'loghlen, A., Banito, A., Guijarro, M.V., Augert, A., Raguz, S., Fumagalli, M., Da Costa, M., Brown, C., Popov, N., Takatsu, Y., Melamed, J., D'adda di Fagagna, F., Bernard,
D., Hernando, E., Gil, J., 2008.Chemokine signaling via the CXCR2 receptor reinforces
senescence. Cell 133, 1006–1018.
Akbar, A.N., Henson, S.M., 2011.Are senescence and exhaustion intertwined or unrelated
processes that compromise immunity? Nat. Rev. Immunol. 11, 289–295. Akiyama, M., Asai, O., Kuraishi, Y., Urashima, M., Hoshi, Y., Sakamaki, H., Yabe, H.,
Furukawa, T., Yamada, O., Mizoguchi, H., Yamada, H., 2000.Shortening of telomeres
in recipients of both autologous and allogeneic hematopoietic stem cell transplanta-tion. Bone Marrow Transplant. 25, 441–447.
Baker, D.J., Childs, B.G., Durik, M., Wijers, M.E., Sieben, C.J., Zhong, J., Saltness, R.A., Jeganathan, K.B., Verzosa, G.C., Pezeshki, A., Khazaie, K., Miller, J.D., Van Deursen,
J.M., 2016.Naturally occurring p16(Ink4a)-positive cells shorten healthy lifespan.
Na-ture 530, 184–189.
Bauer, S., Groh, V., Wu, J., Steinle, A., Phillips, J.H., Lanier, L.L., Spies, T., 1999.Activation of
NK cells and T cells by NKG2D, a receptor for stress-inducible MICA. Science 285, 727–729.
Bhatia, R., Van Heijzen, K., Palmer, A., Komiya, A., Slovak, M.L., Chang, K.L., Fung, H., Krishnan, A., Molina, A., Nademanee, A., O'donnell, M., Popplewell, L., Rodriguez, R., Forman, S.J., Bhatia, S., 2005.Longitudinal assessment of hematopoietic abnormalities after autologous hematopoietic cell transplantation for lymphoma. J. Clin. Oncol. 23, 6699–6711.
Bull, C., Sobanov, Y., Rohrdanz, B., O'brien, J., Lehrach, H., Hofer, E., 2000.The centromeric
part of the human NK gene complex: linkage of LOX-1 and LY49L with the CD94/ NKG2 region. Genes Immun. 1, 280–287.
Campisi, J., 2013.Aging, cellular senescence, and cancer. Annu. Rev. Physiol. 75, 685–705.
HIP1 MYO1G RALGPS1 F2R ACTN4 TTC38 HMGA2 PDE4A C1orf216 CENPE CXCR3 SLC38A5 PPP2R2B TOX CMYA5 LHX9 PBK SAP30 CD58 CEP55 TPX2 ATP8B3 MIAT MTMR7 STX1A LILRB1 BZRAP1 KIAA0913 CCR6 CDC42BPB SSTR3 Pre-Treatment Post-Treatment
Fig. 5.A hierarchical clustering of transcripts from a Gene Set Enrichment Analysis Signature (GSE22045) with increased expression in regulatory T cells compared to conventional T cells.
Cancer Genome Atlas Research, N., 2012.Comprehensive genomic characterization of squamous cell lung cancers. Nature 489, 519–525.
Cheng, N.L., Chen, X., Kim, J., Shi, A.H., Nguyen, C., Wersto, R., Weng, N.P., 2015.
MicroRNA-125b modulates inflammatory chemokine CCL4 expression in immune cells and its reduction causes CCL4 increase with age. Aging Cell 14, 200–208.
Clark, R.E., Brammer, C.G., 1998.Previous treatment predicts the efficiency of blood
pro-genitor cell mobilisation: validation of a chemotherapy scoring system. Bone Marrow Transplant. 22, 859–863.
Desai, A., Grolleau-Julius, A., Yung, R., 2010.Leukocyte function in the aging immune
sys-tem. J. Leukoc. Biol. 87, 1001–1009.
Dheda, K., Huggett, J.F., Bustin, S.A., Johnson, M.A., Rook, G., Zumla, A., 2004.Validation of
housekeeping genes for normalizing RNA expression in real-time PCR. Biotechniques 37, 112–114 (116, 118–9).
Dorshkind, K., Montecino-Rodriguez, E., Signer, R.A., 2009.The ageing immune system: is
it ever too old to become young again? Nat. Rev. Immunol. 9, 57–62.
Effros, R.B., Boucher, N., Porter, V., Zhu, X., Spaulding, C., Walford, R.L., Kronenberg, M.,
Cohen, D., Schachter, F., 1994.Decline in CD28 + T cells in centenarians and in
long-term T cell cultures: a possible cause for both in vivo and in vitro immunosenescence. Exp. Gerontol. 29, 601–609.
Fried, L.P., Tangen, C.M., Walston, J., Newman, A.B., Hirsch, C., Gottdiener, J., Seeman, T., Tracy, R., Kop, W.J., Burke, G., Mcburnie, M.A., Cardiovascular Health Study
Collaborative Research, G., 2001.Frailty in older adults: evidence for a phenotype.
J. Gerontol. A Biol. Sci. Med. Sci. 56, M146–M156.
Gingell-Littlejohn, M., Mcguinness, D., Mcglynn, L.M., Kingsmore, D., Stevenson, K.S.,
Koppelstaetter, C., Clancy, M.J., Shiels, P.G., 2013.Pre-transplant CDKN2A expression
in kidney biopsies predicts renal function and is a future component of donor scoring criteria. PLoS One 8, e68133.
Goronzy, J.J., Weyand, C.M., 2005.T cell development and receptor diversity during aging. Curr. Opin. Immunol. 17, 468–475.
Hake, C.R., Graubert, T.A., Fenske, T.S., 2007.Does autologous transplantation directly
in-crease the risk of secondary leukemia in lymphoma patients? Bone Marrow Trans-plant. 39, 59–70.
Hammond, S.M., Sharpless, N.E., 2008.HMGA2, microRNAs, and stem cell aging. Cell 135,
1013–1016.
Harrison, D.E., 1979.Proliferative capacity of erythropoietic stem cell lines and aging: an
overview. Mech. Ageing Dev. 9, 409–426.
Harrison, D.E., Astle, C.M., 1982.Loss of stem cell repopulating ability upon
transplanta-tion. Effects of donor age, cell number, and transplantation procedure. J. Exp. Med. 156, 1767–1779.
Humbert, N., Navaratnam, N., Augert, A., Da Costa, M., Martien, S., Wang, J., Martinez, D.,
Abbadie, C., Carling, D., De Launoit, Y., Gil, J., Bernard, D., 2010.Regulation of ploidy
and senescence by the AMPK-related kinase NUAK1. EMBO J. 29, 376–386. Janzen, V., Forkert, R., Fleming, H.E., Saito, Y., Waring, M.T., Dombkowski, D.M., Cheng, T.,
Depinho, R.A., Sharpless, N.E., Scadden, D.T., 2006.Stem-cell ageing modified by the
cyclin-dependent kinase inhibitor p16INK4a. Nature 443, 421–426.
Jaruga, E., Skierski, J., Radziszewska, E., Sikora, E., 2000.Proliferation and apoptosis of
human T cells during replicative senescence–a critical approach. Acta Biochim. Pol. 47, 293–300.
Jeck, W.R., Siebold, A.P., Sharpless, N.E., 2012.Review: a meta-analysis of GWAS and
age-associated diseases. Aging Cell 11, 727–731.
Koppelstaetter, C., Schratzberger, G., Perco, P., Hofer, J., Mark, W., Ollinger, R., Oberbauer, R., Schwarz, C., Mitterbauer, C., Kainz, A., Karkoszka, H., Wiecek, A., Mayer, B., Mayer,
G., 2008.Markers of cellular senescence in zero hour biopsies predict outcome in
renal transplantation. Aging Cell 7, 491–497.
Krishnamurthy, J., Torrice, C., Ramsey, M.R., Kovalev, G.I., Al-Regaiey, K., Su, L., Sharpless,
N.E., 2004.Ink4a/Arf expression is a biomarker of aging. J. Clin. Invest. 114,
1299–1307.
Lansdorp, P.M., 2007.Immortal strands? Give me a break. Cell 129, 1244–1247.
SORCS3 CLCC1 PAR5 ADAMTS1 PAFAH2 BDKRB1 SYT2 ATRNL1 CPT1A PPFIA2 ADH1B SPAG6 SLC25A20 FAM182B NEUROD6 GRIK3 SATB2 KCNQ3 HDGFRP3 KIR3DL1 KIR2DS4 B4GALT2 EYA1 Pre-Treatment Post-Treatment
Fig. 6.A hierarchical clustering of transcripts from a Gene Set Enrichment Analysis Signature (GSE36476) with increased expression of transcripts that are more highly expressed in T cells from old versus young donors. Pre-treatment samples are on the left (grey bar above the heatmap) and post-treatment samples are on the right (blue bar). Samples are ordered along the
Lee, J., Kook, H., Chung, I., Kim, H., Park, M., Kim, C., Nah, J., Hwang, T., 1999.Telomere length changes in patients undergoing hematopoietic stem cell transplantation. Bone Marrow Transplant. 24, 411–415.
Lemster, B.H., Michel, J.J., Montag, D.T., Paat, J.J., Studenski, S.A., Newman, A.B., Vallejo,
A.N., 2008.Induction of CD56 and TCR-independent activation of T cells with aging.
J. Immunol. 180, 1979–1990.
Lewis, N.L., Mullaney, M., Mangan, K.F., Klumpp, T., Rogatko, A., Broccoli, D., 2004.
Measur-able immune dysfunction and telomere attrition in long-term allogeneic transplant recipients. Bone Marrow Transplant. 33, 71–78.
Li, B., Dewey, C.N., 2011.RSEM: accurate transcript quantification from RNA-seq data with
or without a reference genome. BMC Bioinf. 12, 323.
Linton, P.J., Dorshkind, K., 2004.Age-related changes in lymphocyte development and
function. Nat. Immunol. 5, 133–139.
Liu, Y., Sanoff, H.K., Cho, H., Burd, C.E., Torrice, C., Ibrahim, J.G., Thomas, N.E., Sharpless,
N.E., 2009.Expression of p16(INK4a) in peripheral blood T-cells is a biomarker of
human aging. Aging Cell 8, 439–448.
Love, M.I., Huber, W., Anders, S., 2014.Moderated estimation of fold change and
disper-sion for RNA-seq data with DESeq2. Genome Biol. 15, 550.
Mane, V.P., Heuer, M.A., Hillyer, P., Navarro, M.B., Rabin, R.L., 2008.Systematic method for
determining an ideal housekeeping gene for real-time PCR analysis. J. Biomol. Tech. 19, 342–347.
Mcglynn, L.M., Stevenson, K., Lamb, K., Zino, S., Brown, M., Prina, A., Kingsmore, D., Shiels,
P.G., 2009.Cellular senescence in pretransplant renal biopsies predicts postoperative
organ function. Aging Cell 8, 45–51.
Min, H., Montecino-Rodriguez, E., Dorshkind, K., 2005.Effects of aging on early B- and
T-cell development. Immunol. Rev. 205, 7–17.
Montecino-Rodriguez, E., Berent-Maoz, B., Dorshkind, K., 2013.Causes, consequences, and reversal of immune system aging. J. Clin. Invest. 123, 958–965.
Narita, M., Narita, M., Krizhanovsky, V., Nunez, S., Chicas, A., Hearn, S.A., Myers, M.P.,
Lowe, S.W., 2006.A novel role for high-mobility group a proteins in cellular
senes-cence and heterochromatin formation. Cell 126, 503–514.
Nelson, J.A., Krishnamurthy, J., Menezes, P., Liu, Y., Hudgens, M.G., Sharpless, N.E., Eron Jr.,
J.J., 2012.Expression of p16(INK4a) as a biomarker of T-cell aging in HIV-infected
pa-tients prior to and during antiretroviral therapy. Aging Cell 11, 916–918. Perez-Simon, J.A., Martin, A., Caballero, D., Corral, M., Nieto, M.J., Gonzalez, M.,
Vazquez, L., Lopez-Berges, C., Canizo, M.C., Mateos, M.V., Orfao, A., San Miguel,
J.F., 1999.Clinical significance of CD34 + cell dose in long-term engraftment
fol-lowing autologous peripheral blood stem cell transplantation. Bone Marrow Transplant. 24, 1279–1283.
Perillo, N.L., Naeim, F., Walford, R.L., Effros, R.B., 1993.The in vitro senescence of human T
lymphocytes: failure to divide is not associated with a loss of cytolytic activity or memory T cell phenotype. Mech. Ageing Dev. 67, 173–185.
Pipes, B.L., Tsang, T., Peng, S.X., Fiederlein, R., Graham, M., Harris, D.T., 2006.Telomere
length changes after umbilical cord blood transplant. Transfusion 46, 1038–1043. Robin, J.D., Ludlow, A.T., Batten, K., Magdinier, F., Stadler, G., Wagner, K.R., Shay,
J.W., Wright, W.E., 2014.Telomere position effect: regulation of gene
expres-sion with progressive telomere shortening over long distances. Genes Dev. 28, 2464–2476.
Rodier, F., Campisi, J., 2011.Four faces of cellular senescence. J. Cell Biol. 192, 547–556.
Rosko, A., Hofmeister, C., Benson, D., Efebera, Y., Huang, Y., Gillahan, J., Byrd, J.C., Burd, C.E.,
2015.Autologous hematopoietic stem cell transplant induces the molecular aging of
T-cells in multiple myeloma. Bone Marrow Transplant. 50, 1379–1381.
Sanoff, H.K., Deal, A.M., Krishnamurthy, J., Torrice, C., Dillon, P., Sorrentino, J., Ibrahim, J.G., Jolly, T.A., Williams, G., Carey, L.A., Drobish, A., Gordon, B.B., Alston, S., Hurria, A.,
Kleinhans, K., Rudolph, K.L., Sharpless, N.E., Muss, H.B., 2014.Effect of cytotoxic
che-motherapy on markers of molecular age in patients with breast cancer. J. Natl. Cancer Inst. 106 (dju057).
Sciume, G., de Angelis, G., Benigni, G., Ponzetta, A., Morrone, S., Santoni, A., Bernardini, G.,
2011.CX3CR1 expression defines 2 KLRG1 + mouse NK-cell subsets with distinct
functional properties and positioning in the bone marrow. Blood 117, 4467–4475.
Sharpless, N.E., Depinho, R.A., 2007.How stem cells age and why this makes us grow old.
Nat. Rev. Mol. Cell Biol. 8, 703–713. 1033 1022 1015 A109 A105 1009 1006 A103 1033 1022 1015 A109 A105 1009 1006 A103
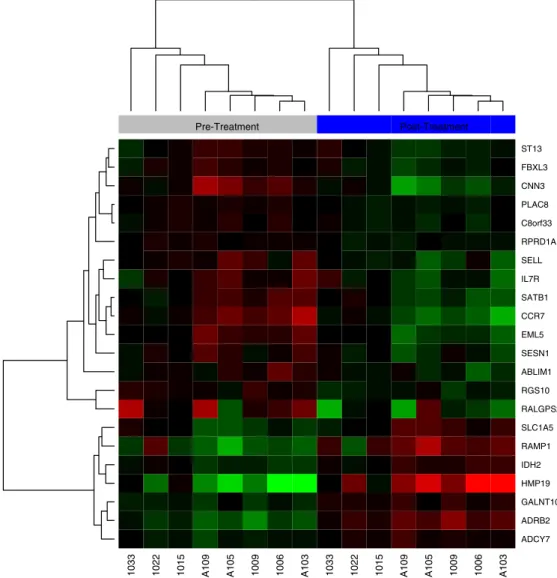
ADCY7 ADRB2 GALNT10 HMP19 IDH2 RAMP1 SLC1A5 RALGPS2 RGS10 ABLIM1 SESN1 EML5 CCR7 SATB1 IL7R SELL RPRD1A C8orf33 PLAC8 CNN3 FBXL3 ST13 Pre-Treatment Post-Treatment
Fig. 7.A hierarchical clustering of transcripts from a Gene Set Enrichment Analysis Signature (GSE9650) with a mixed pattern of expression of signatures associated with naïve versus exhausted CD8+ cells. Pre-treatment samples are on the left (grey bar above the heatmap) and post-treatment samples are on the right (blue bar). Sample numbers are shown below
the heatmap, with an“A”prior to sample numbers indicating patients undergoing auto-HSCT. Samples without an“A”indicate patients treated with chemotherapy and not
Sharpless, N.E., Sherr, C.J., 2015.Forging a signature of in vivo senescence. Nat. Rev. Cancer 15, 397–408.
Siegel, R., Desantis, C., Virgo, K., Stein, K., Mariotto, A., Smith, T., Cooper, D., Gansler, T., Lerro, C., Fedewa, S., Lin, C., Leach, C., Cannady, R.S., Cho, H., Scoppa, S., Hachey, M.,
Kirch, R., Jemal, A., Ward, E., 2012.Cancer treatment and survivorship statistics,
2012. CA Cancer J. Clin. 62, 220–241.
Soriani, A., Iannitto, M.L., Ricci, B., Fionda, C., Malgarini, G., Morrone, S., Peruzzi, G.,
Ricciardi, M.R., Petrucci, M.T., Cippitelli, M., Santoni, A., 2014.Reactive oxygen
spe-cies- and DNA damage response-dependent NK cell activating ligand upregulation occurs at transcriptional levels and requires the transcriptional factor E2F1. J. Immunol. 193, 950–960.
Subramanian, A., Tamayo, P., Mootha, V.K., Mukherjee, S., Ebert, B.L., Gillette, M.A.,
Paulovich, A., Pomeroy, S.L., Golub, T.R., Lander, E.S., Mesirov, J.P., 2005.Gene set
en-richment analysis: a knowledge-based approach for interpreting genome-wide ex-pression profiles. Proc. Natl. Acad. Sci. U. S. A. 102, 15545–15550.
Targonski, P.V., Jacobson, R.M., Poland, G.A., 2007.Immunosenescence: role and
measure-ment in influenza vaccine response among the elderly. Vaccine 25, 3066–3069.
Textor, S., Fiegler, N., Arnold, A., Porgador, A., Hofmann, T.G., Cerwenka, A., 2011.Human
NK cells are alerted to induction of p53 in cancer cells by upregulation of the NKG2D ligands ULBP1 and ULBP2. Cancer Res. 71, 5998–6009.
Wang, K., Singh, D., Zeng, Z., Coleman, S.J., Huang, Y., Savich, G.L., He, X., Mieczkowski, P.,
Grimm, S.A., Perou, C.M., Macleod, J.N., Chiang, D.Y., Prins, J.F., Liu, J., 2010.MapSplice:
accurate mapping of RNA-seq reads for splice junction discovery. Nucleic Acids Res. 38, e178.
Wildes, T.M., Rosko, A., Tuchman, S.A., 2014.Multiple myeloma in the older adult: better
prospects, more challenges. J. Clin. Oncol. 32, 2531–2540.
Woolthuis, C.M., Mariani, N., Verkaik-Schakel, R.N., Brouwers-Vos, A.Z., Schuringa, J.J.,
Vellenga, E., De Wolf, J.T., Huls, G., 2014.Aging impairs long-term hematopoietic
re-generation after autologous stem cell transplantation. Biol. Blood Marrow Transplant. 20, 865–871.
Zindy, F., Quelle, D.E., Roussel, M.F., Sherr, C.J., 1997.Expression of the p16INK4a