MARKERS OF EPITHELIAL-MESENCHYMAL TRANSITION AND COLORECTAL CANCER MORTALITY: TIME-TO-EVENT AND LATENT-CLASS ANALYSES
Evan L. Busch
A dissertation submitted to the faculty at the University of North Carolina at Chapel Hill in partial fulfillment of the requirements for the degree of Doctor of Philosophy in the Department
of Epidemiology in the Gillings School of Global Public Health.
Chapel Hill 2015
Approved by:
Robert S. Sandler
Christy L. Avery
David A. Eberhard
Temitope O. Keku
ii
iii ABSTRACT
Evan L. Busch: Markers of Epithelial-Mesenchymal Transition and Colorectal Cancer Mortality:
Time-to-Event and Latent-Class Analyses (Under the direction of Robert S. Sandler)
Most cancer arises in epithelial cells and most cancer deaths are due to metastases. Many
cancer patients diagnosed with local disease according to lymph-node evaluation and radiologic
imaging later experience disease recurrence within a few years of surgery. An additional measure
of cancer cell detachment from the primary tumor taken in the primary tumor itself at the time of
surgery might improve our ability to identify which patients are at risk for recurrence and
therefore should have their treatments adjusted accordingly.
Epithelial-mesenchymal transition (EMT) is a mechanism of cancer cell metastasis that
connects epithelial cells to metastasis. It identifies candidate markers for the additional
diagnostic test needed to stratify cancer patients by risk for recurrence.
I measured the EMT markers E-cadherin, Integrin beta-6, and Snail in primary tumors
from subjects in a population-based, case-only prospective cohort of colorectal cancer patients.
Using Cox proportional hazards models, I estimated the association between each marker and
time from surgery to death. I found that E-cadherin expression measured as a weighted average
of tumor cores was associated with time to death. No other marker expression variable was
associated with outcomes.
Using latent class analysis, I estimated the sensitivity and specificity of E-cadherin
expression as a weighted average of tumor cores to classify subjects as those likely to have
iv
conjunction with lymph node evaluation and radiologic imaging. Latent class analysis permitted
estimation of sensitivity and specificity under the realistic assumption that none of the tests
constituted a gold-standard measure of whether cancer cells had detached from the primary
tumor by the time of diagnosis. Across the various latent class models that I explored, I found a
peak E-cadherin sensitivity of 59% and peak specificity of 94%.
My results suggested that E-cadherin measurements in colorectal primary tumors at the
time of surgery might improve the ability of clinicians to assess whether the patient is at risk for
recurrence. Incorporating such measurements into standard colorectal cancer diagnostic
v
vi
ACKNOWLEDGEMENTS
I have been especially fortunate to have completed my doctoral work at UNC-Chapel
Hill. The outstanding resources and personnel at the university were used to the full to carry out
this project. The Translational Pathology Laboratory performed the tissue staining and
biomarker measurements. Throughout the process the entire lab was a model of helpfulness,
efficiency, thoroughness, and high-quality work. Nana Feinberg helped to identify appropriate
antibodies and advised on coordinating the entire process. Yongjuan Xia performed the staining.
Stephanie Cohen segmented the images, developed the annotation and scoring algorithms, and
carried out the application of the algorithms. Her generosity of advice and patience while I
learned the process went far beyond the call of duty.
Nikki McCoy from the Keku Laboratory prepared the tissue microarray slides and maps.
Christopher Martin provided database management assistance in working with the CanCORS
datasets. Thanks go to the Funkhouser Lab for providing control tissue specimens. Annie Green
Howard from the UNC Department of Biostatistics provided critical statistical advice late in the
project. Special thanks go to Christopher Wiesen of the UNC Odum Institute for his spectacular
statistical advice and support at several steps along the way. Kate McGraw of the UNC Health
Sciences Library was our collaborator on the systematic review that guided the design of many
aspects of the data collection and analysis. The entire administrative staff of the Epidemiology
Department facilitated my time in graduate school in ways too numerous to specify, with
particular thanks to Nancy Colvin, Carmen Woody, and Valerie Hudock from Epidemiology
vii
I literally could not have made it through graduate school without support from the
various funding sources I have enjoyed during my time at UNC. The UNC Graduate School
provided a scholarship that covered my first year in the program. Subsequently, Dora Il’yasova,
Clara Lee, Victor Schoenbach, Lorraine Alexander, Christy Avery, Eric Whitsel, Yang Claire
Yang, and Jose Zevallos gave me research and teaching assistant opportunities that supported me
and made my dissertation work possible. I also learned a tremendous amount about research
from them that indirectly influenced the dissertation in ways large and small.
David Richardson, Christy Avery, Temitope Keku, and David Eberhard reached the
Platonic ideal for dissertation committee members. They generously provided every bit of time,
effort, and insight that I needed. They were unfailingly flexible about making changes to the
project as we discovered better approaches over the course of the work. I believe that, not far off
in the future, cancer patients will experience real benefits that derive from the ideas they
contributed to this project. I would like to highlight Dr. Keku’s work years ago towards
assembling the cohort, as well as her advice and training me in the collection and analysis of the
marker expression data. Dr. Richardson provided analytic insights that fundamentally shaped
both the time-to-event and latent class analyses.
I especially want to thank my advisor and chair Robert Sandler. Listing everything he
has done for me would require another dissertation by itself. He gave me access to the data from
NC-CanCORS, and all of the work depended on his efforts to put together the cohort before I
arrived at UNC. He provided painstakingly-collected tissue specimens and, via the Sessions
Professorship, funds to carry out the laboratory work. Above all, he made a tremendous
viii
attention to detail, rigor, and insights into both substantive and process matters have helped make
me a better researcher than I ever could have expected to become.
Thanks to my family and friends for their love and support, especially to my mom Diane
and my buddy Todd Bergstrom for shouldering most of the load with my whining and
complaining over the past few years. Finally, perhaps the deepest gratitude of all goes to the
American military, taxpayers, and police. They make everything in our society possible. Public
ix
TABLE OF CONTENTS
LIST OF TABLES ... xiii
LIST OF FIGURES ... xiv
LIST OF ABBREVIATIONS ... xvi
CHAPTER 1. SPECIFIC AIMS ...1
CHAPTER 2. BACKGROUND AND SYSTEMATIC LITERATURE REVIEW ...3
2.1. Colorectal cancer ...3
2.2. Role of metastasis in CRC outcomes ...4
2.3. Epithelial-Mesenchymal Transition ...6
2.4. Public health significance ...8
2.5. Systematic review and marker selection ...10
2.5.1. Systematic review of literature on EMT markers and CRC outcomes ...10
2.5.2. Marker selection criteria ...12
2.5.3. Summary of systematic review findings ...13
2.5.4. Marker selection conclusions ...17
CHAPTER 3. METHODS ...20
3.1. Subject selection and enrollment ...20
3.1.1. Study population ...20
3.1.2. Subject identification, recruitment, and enrollment ...21
x
3.2. Specimen collection ...22
3.2.1. Collection at clinics...22
3.2.2. Specimen preparation and storage at UNC ...23
3.2.3. Control specimens ...24
3.2.4. Sample size ...24
3.3. Specimen staining ...28
3.3.1. Acquisition of antibodies for immunohistochemistry...28
3.3.2. Immunohistochemistry staining procedures ...28
3.4. Digital image annotation and analysis ...31
3.4.1. Annotation rationale and goal ...31
3.4.2. Image annotation and scoring procedures ...32
3.4.3. Linkage of marker data with main CanCORS data ...35
3.5. Assessment of reliability ...35
3.6. Statistical analysis for time-to-event analysis ...36
3.6.1. Overview ...36
3.6.2. Definitions...37
3.6.3. Descriptive statistics ...38
3.6.4. Identification of statistically-optimal cut points of marker expression ...40
3.6.5. Bivariate time-to-event analysis ...42
3.6.6. Covariate selection ...44
3.6.7. Multivariate time-to-event analysis ...46
3.6.8. Missing data and multiple imputation...47
xi
3.7.1. Overview ...49
3.7.2. Latent class framework ...51
3.7.3. Latent class model for diagnostics of cancer cell detachment from primary tumors...52
3.7.4. Data used for latent class analysis ...53
3.7.5. Analysis...56
3.8. Ethical Considerations ...57
3.8.1. IRB approval ...57
3.8.2. Informed consent ...57
3.8.3. Potential risks to subjects ...58
3.8.4. Potential benefits to subjects ...58
CHAPTER 4. MARKERS OF EPITHELIAL-MESENCHYMAL TRANSITION AND MORTALITY IN A POPULATION-BASED PROSPECTIVE COHORT OF COLORECTAL CANCER PATIENTS ...59
4.1. Introduction ...59
4.2. Methods...60
4.2.1. Study population ...60
4.2.2. Immunohistochemistry ...61
4.2.3. Automated analysis of digital IHC images ...62
4.2.4. Outcome ...64
4.2.5. Covariates ...65
4.2.6. Marker expression cut point optimization ...65
4.2.7. Statistical analysis ...66
4.3. Results ...67
xii
CHAPTER 5. ESTIMATING SENSITIVITY AND SPECIFICITY OF MARKERS OF EPITHELIAL-MESENCHYMAL TRANSITION TO EVALUATE CANCER CELL DETACHMENT FROM PRIMARY
TUMORS: A LATENT CLASS ANALYSIS ...95
5.1. Introduction ...95
5.2. Methods...96
5.2.1. Study population ...96
5.2.2. Latent class models ...96
5.2.3. Diagnostic tests of cancer cell detachment from primary tumors ...97
5.2.4. Analysis...99
5.3. Results ...101
5.4. Discussion ...102
CHAPTER 6. DISCUSSION ...111
6.1. Summary of findings...111
6.1.1. Associations between EMT marker expression and time-to-death ...111
6.1.2. Latent class estimates of EMT sensitivity and specificity to evaluate cancer cell detachment from primary tumors ...113
6.2. Strengths and limitations...115
6.3. Public health implications and future directions ...121
APPENDIX A. SEARCH TERMS FOR SYSTEMATIC LITERATURE REVIEW OF EMT MARKERS AND OUTCOMES ...123
APPENDIX B. MARKER CUT POINT OPTIMIZATION MACRO: SAS CODE AND DETAILS ...124
APPENDIX C. LATENT CLASS ANALYSIS: SAS CODE AND DETAILS ...130
xiii
LIST OF TABLES
Table 1. Sample size calculations for initial selection of subjects ...25
Table 2. Rules for inferring lymph node and radiologic imaging
test results from tumor stage ...55
Table 3. Subject characteristics for overall North Carolina CanCORS
and subset in whose primary tumors EMT markers were measured ...78
Table 4. Average continuous EMT marker expression in tumor tissue
compared to normal adjacent tissue ...79
Table 5. Optimally-dichotomized marker expression status cross-tabulated
with tumor stage and with risk of dying within 5 years of surgery ...80
Table 6. Unadjusted and adjusted Cox proportional hazards models of the effect of optimally-dichotomized marker expression status
on time-to-death censored at 5 years after surgery ...81
Table 7. Trade-offs between strength of cut-point/time-to-death association and number of patients whose treatments would be reassigned,
by stage distribution and 5-year risk of death for E-cadherin
weighted average status ...82
Table 8. Subject characteristics...107
Table 9. Estimated sensitivity and specificity of EMT markers, and prevalence of high risk for metastatic disease, at EMT cut point of 0.52 and
varying fixed values of sensitivity or specificity for other tests ...108
Table 10. Estimated sensitivity and specificity of EMT markers, and prevalence of high risk for metastatic disease, at EMT cut point of 0.60 and
varying fixed values of sensitivity or specificity for other tests ...109
Table 11. Estimated sensitivity and specificity of EMT markers, and prevalence of high risk for metastatic disease, at EMT cut point of 0.85 and
xiv
LIST OF FIGURES
Figure 1. Epithelial-mesenchymal transition and associated molecular markers ...7
Figure 2. Conceptual model of the role of EMT markers in determining CRC patient outcomes ...10
Figure 3. Flow of patient eligibility and inclusion ...27
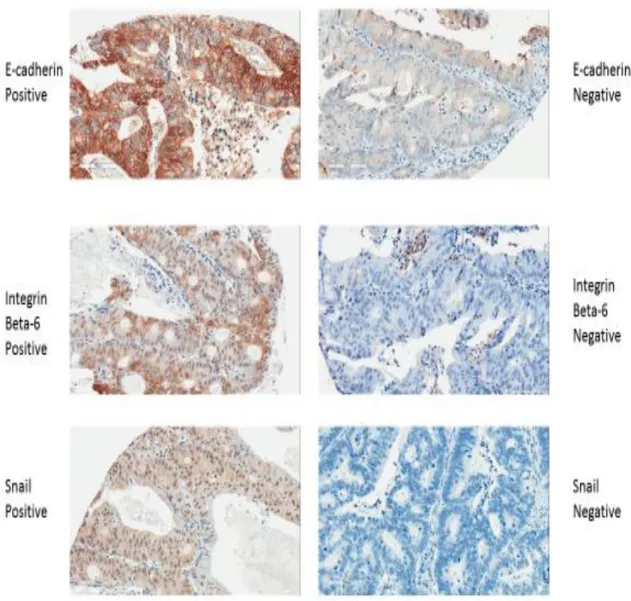
Figure 4. Immunohistochemistry examples for positive and negative staining for each of E-cadherin, Integrin beta-6, and Snail ...29
Figure 5. Illustration of Tissue Studio analysis of colon tumor tissue ...30
Figure 6. Illustration of Tissue Studio analysis of normal colon tissue ...31
Figure 7. Reductionist and heterotypic representations of cancer tumors ...32
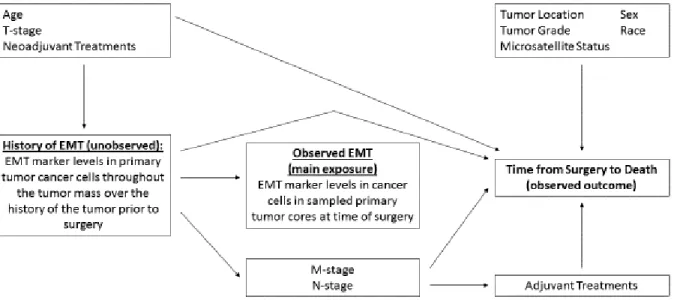
Figure 8. Directed acyclic graph (causal diagram) depicting postulated relationships between primary tumor cancer cell EMT marker expression, time-to-death, and other variables...45
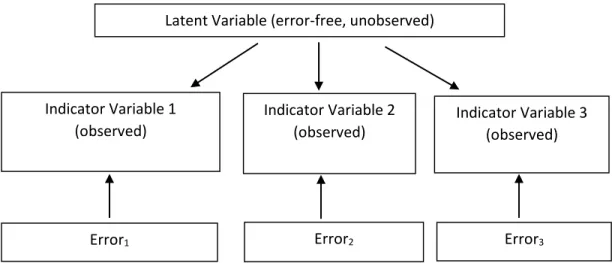
Figure 9. Generic latent class model with three indicator variables ...52
Figure 10. Latent class model of diagnostic tests to evaluate cancer cell detachment from primary tumors...53
Figure 11. Kaplan-Meier survival stratified by levels of dichotomous E-cadherin weighted average expression status ...83
Figure 12. Kaplan-Meier survival stratified by levels of dichotomous E-cadherin worst core expression status...84
Figure 13. Kaplan-Meier survival stratified by levels of dichotomous Integrin beta-6 weighted average expression status ...85
Figure 14. Kaplan-Meier survival stratified by levels of dichotomous Integrin beta-6 worst core expression status ...86
Figure 15. Kaplan-Meier survival stratified by levels of dichotomous Snail weighted average expression status ...87
xv
Figure 17. Kaplan-Meier survival jointly stratified by levels of dichotomous E-cadherin weighted average expression status and dichotomous
Integrin beta-6 weighted average expression status ...89
Figure 18. Kaplan-Meier survival jointly stratified by levels of dichotomous E-cadherin worst core expression status and dichotomous
Integrin beta-6 worst core expression status ...90
Figure 19. Kaplan-Meier survival jointly stratified by levels of dichotomous
E-cadherin weighted average expression status and dichotomous ...91
Figure 20. Kaplan-Meier survival jointly stratified by levels of dichotomous E-cadherin worst core expression status and dichotomous
Snail worst core expression status ...92
Figure 21. Kaplan-Meier survival jointly stratified by levels of dichotomous Integrin beta-6 weighted average expression status and dichotomous
Snail weighted average expression status ...93
Figure 22. Kaplan-Meier survival jointly stratified by levels of dichotomous Integrin beta-6 worst core expression status and dichotomous
xvi
LIST OF ABBREVIATIONS
BIC Bayesian information criterion model fit statistic
CanCORS Cancer Care Outcomes Research and Surveillance Consortium
CI Confidence interval
CRC Colorectal cancer
DAG Directed acyclic graph
Df Degrees of freedom
EMT Epithelial-mesenchymal transition
HR Hazard ratio
IHC Immunohistochemistry
LCA Latent class analysis
LN Lymph node evaluation
MI Multiple imputation
NC North Carolina
RI Radiologic imaging
ROC Receiver operating characteristic curve
1
CHAPTER 1. SPECIFIC AIMS
Roughly 80% of cancer arises from epithelial cells and about 90% of cancer deaths are
due to metastases (1). Epithelial-mesenchymal transition (EMT) is a mechanism of cancer cell
metastasis that links epithelial biology to the detachment of cancer cells from primary tumors
(2). EMT markers measured in primary tumor cancer cells could be important to identify
patients at risk for metastatic disease, even among those with no evidence of metastatic disease
according to lymph node evaluation or radiologic imaging. The impact of EMT markers could
be especially great in colorectal cancer (CRC), which is 95% epithelial in origin (3) and in which
about 25% of patients diagnosed with local disease eventually experience recurrence (4). This
suggests that many patients have metastatic disease at the time of diagnosis that is not
successfully captured by conventional diagnostics of lymph node evaluation and imaging.
Although several dozen studies of EMT markers in CRC primary tumors and patient
outcomes have been conducted over the past decade, the methods and results have been
inconsistent (5). In addition, data analyses have been crude and not informative in terms of
whether the markers could be translated to the clinic, where they could impact public health by
modifying tumor stage diagnosis procedures. I undertook this research to develop marker
measurement and data analysis procedures for studies of EMT markers and patient outcomes that
can standardize methods across studies and provide information that permits clear evaluation of
whether and how a marker could be used clinically. The goal was to develop methods that will
facilitate translation of EMT markers to clinical use so that cancer patients may benefit from the
2
for this research were applied to subjects from a population-based, case-only prospective cohort
of CRC patients. The specific aims of the project were as follows:
Specific Aim 1: Estimate associations between EMT marker expression levels in CRC primary tumor cancer cells and time from surgery to patient death.
a) Identify the optimal scale on which to measure each marker.
b) Determine the set of adjustment covariates to include in statistical models to produce
valid estimates of associations between EMT marker expression levels and patient outcomes.
c) Develop a method to identify clinically-informative cut points for observed values
along the scale of expression chosen for a given marker.
Hypothesis: Low E-cadherin expression, and high Integrin beta-6 and Snail expression,
will be associated with shorter times from surgery to death.
Specific Aim 2: Using latent class analysis, estimate the sensitivity and specificity of EMT markers to assess cancer cell detachment from primary tumors without assuming that lymph node evaluation or radiologic imaging are gold standard measures of such detachment.
a) Conduct sensitivity analyses to evaluate how varying one’s assumptions about the
sensitivity and specificity of lymph node evaluation and imaging impact estimates of the
sensitivity and specificity of EMT markers.
b) Assess how varying the cut point used to determine dichotomous EMT marker
expression status impacts estimates of the sensitivity and specificity of the EMT marker.
Hypothesis: EMT marker expression levels associated with time from surgery to death
3
CHAPTER 2. BACKGROUND AND SYSTEMATIC LITERATURE REVIEW 2.1. Colorectal cancer
Colorectal cancer (CRC) is a leading cause of morbidity and mortality both nationally
and globally. In the United States alone there are over 140,000 new cases and 50,000 deaths per
year attributable to the disease, giving CRC the fourth-largest incidence nationally of any tumor
site (after prostate, breast, and lung cancer) and second-largest mortality (after lung cancer) (6).
As is typical of cancer generally, a patient’s prospects for a full recovery decline sharply the
greater the spread of the tumor. The five-year relative survival proportion is approximately 90%
for localized tumors, 69% for tumors that have spread to adjacent lymph nodes and organs, and
12% for tumors that have spread to distant organs at the time of diagnosis (7).
Despite substantial morbidity and mortality due to CRC, the United States has seen a
declining disease burden. Overall age-adjusted CRC incidence has fallen from a peak of about
68 cases per 100,000 people per year in the mid-1980s to around 42 cases per 100,000 people per
year in 2009 (8). Similarly, overall age-adjusted CRC mortality has decreased from about 28
deaths per 100,000 people per year in 1978 to roughly 16 deaths per 100,000 people per year in
2009 (8). The improved mortality rate has been attributed to a combination of screening via
techniques such as colonoscopy; successful treatment via surgery, chemotherapy, and radiation
therapy; and changes in population risk factor exposures (9, 10). However, the fact that the CRC
morbidity and mortality burden remains high despite these trends suggests that additional clinical
4
A number of risk factors are associated with CRC. Increasing risk is associated with
increasing age, as over 90% of cases are diagnosed in people over the age of 50 (10). Smoking,
diets high in fat and low in folate, and a history of colonic inflammatory disease also increase the
risk of developing CRC (10). Blacks are at higher risk for CRC with an age-adjusted incidence
of nearly 53 cases per 100,000 people per year in 2009 compared to 41 cases per 100,000 people
per year among whites (8). Men are more likely to develop CRC with an age-adjusted incidence
of about 48 cases per 100,000 people per year in 2009 versus 38 cases per 100,000 people per
year among women (8).
Despite the vast increase in our biological understanding of cancer since the 1970s, our
ability to capitalize on this knowledge to reduce cancer incidence and mortality has been
relatively disappointing. Many of the anti-tumor treatments in clinical use were developed
decades ago without the benefit of the molecular and genetic insights obtained since (1).
However, the failure to date to match expectations does not mean that the biological insights of
recent decades do not open up rich possibilities for new clinical interventions that can improve
CRC outcomes. Translational research, which attempts to use basic biology knowledge to
discover effective clinical interventions, holds tremendous promise to build on past advances in
reducing CRC mortality.
2.2. Role of metastasis in CRC outcomes
To reduce the CRC mortality burden, effective interventions will target the ways in which
CRC kills people. Of course, one approach is to prevent the disease from occurring altogether,
as polypectomy during colonoscopy often does. When a tumor has already formed, an
appropriate approach is to target the particular mechanisms that the tumor uses that ultimately
5
The capacity to invade and metastasize is widely recognized as a distinguishing
characteristic of cancer, where metastasis can be defined as the spread of cancer cells to parts of
the body distant from the primary tumor (11). Such roving cancer cells are dangerous because
they can found new tumors throughout the body. More importantly, metastases are responsible
for approximately 90% of deaths due to cancer (1); it is surprisingly rare for the primary tumor to
directly kill the patient.
Therefore, when any patient is diagnosed with cancer, two of the most critical questions
that must be answered are whether cancer cells have already begun to detach from the primary
tumor and, if so, whether healthcare providers can still successfully treat the illness. Our ability
to answer these questions correctly depends on how accurately we can assess a host of additional
factors. One important issue is determining whether any cancer cells in the primary tumor
appear to have been capable of breaking off from it. A second consideration is whether
metastases can be detected elsewhere in the body. The latter is particularly difficult to determine
because most metastases break away from the primary tumor as micrometastases, defined as “[a]
metastasis that is composed of a single cell or a small clump of cells and is only apparent through
microscopy” (1). This definition suggests that there may be limits to how well radiologic
imaging can detect every metastasis that may exist in a patient’s body at the time of tumor
removal surgery. Micrometastases that break off from the primary just before the latter is
removed would be too small to be seen by imaging at that time.
Determining whether cancer cells in the primary tumor at the time of surgery have
acquired the ability to break off could suggest, by inference, whether other cancer cells might
have already broken off. This is an appealing approach to cancer treatment. First, the primary
6
has been producing cells capable of detaching may add crucial information beyond traditional
prognostic factors such as tumor size or grade, which can be limited in their ability to predict
CRC outcomes (12, 13). For example, while metastases are commonly thought of as being
produced by large tumors, it has been shown that cancer cells can detach from small tumors (12).
In short, whether a tumor has cancer cells detaching from it may be independent of its size,
extent of locoregional spread, and therefore stage (except in the sense that any finding of distant
metastases is by definition Stage IV). A tumor that appears to be Stage I or II may be generating
undetected micrometastases. Thus, fully assessing the primary tumor after removal may require
more measurements than the current diagnostics of lymph node evaluation and imaging.
2.3. Epithelial-Mesenchymal Transition
Given the importance of ascertaining whether a patient has metastatic disease, and the
appeal of doing so in part in the primary tumor itself, what measurements of cancer cell ability to
detach should be taken in the primary tumor? Basic research in recent decades suggests that an
important mechanism of cancer invasion and metastasis is epithelial-mesenchymal transition
(EMT). In EMT, epithelial cancer cells shed their epithelial characteristics and acquire a
mesenchymal phenotype, which confers greater cell motility and ability to migrate out of the
tissue of origin (2, 14). EMT could potentially play an enormous role in CRC metastasis because
roughly 95% of CRC tumors are adenocarcinomas, which arise from epithelial cells (3). Indeed,
about 80% of all cancer originates in epithelial cells (1). It has been suggested that patients
develop metastatic disease after cancer cells in the primary tumor acquire the capacity to undergo
7
Figure 1. Epithelial-mesenchymal transition and associated molecular markers (from Kalluri and Weinberg, 2009) (2)
Figure 1 shows that a large number of molecular markers have been associated with
EMT, and the lists are not exhaustive. This makes sense given that the model posits a global
change in phenotype from one cell type to another. Therefore, expression levels of many
markers should change as part of the process. Conceptually, EMT markers can be placed into
three categories: 1) those that induce EMT (i.e. EMT inducers), such as the transcription factors
Snail, Slug, and Twist; 2) markers of epithelial phenotype (i.e. epithelial markers), such as
E-cadherin and cytokeratin; and 3) markers of mesenchymal phenotype (i.e. mesenchymal
markers), such as N-cadherin and vimentin. For cells undergoing EMT, one would expect a
decrease in expression of epithelial markers, as well as an increase in expression of both EMT
inducers and mesenchymal markers (2, 14).
How can EMT markers be used to assess whether the primary tumor shows evidence of
containing substantial numbers of cells capable of breaking off? Prior to undergoing EMT, the
cancer cells in the tumor remain epithelial cells—albeit abnormal ones—that should exhibit
8
no expression of EMT inducers and mesenchymal markers). If the primary tumor, or at least part
of it, begins generating metastases using the EMT mechanism, it is likely that a steady stream of
cancer cells in the metastasis-generating portion will undergo the transition. Once the transition
is complete for any one cell, the previously-epithelial cancer cell will have become a cancerous
mesenchymal cell that could detach from the primary tumor and move away from it. At this
point the cell would exhibit typical mesenchymal-cell levels of EMT markers (low expression of
epithelial markers, and high expression of EMT inducers and mesenchymal markers).
While in transition, cancer cells will exhibit the “intermediate phenotypes” depicted in
the middle of Figure 1. During this time they will be partially epithelial and partially
mesenchymal, yet still attached to the primary tumor. Such cells may macroscopically appear to
remain epithelial but show molecular expression of EMT markers that is abnormal for epithelial
cells, such as low expression of E-cadherin or high expression of Snail. Finding cancer cells in
the primary tumor with molecular expression levels indicative of an intermediate state between
epithelial and mesenchymal phenotypes would suggest that the primary tumor is generating
metastases. Crucially, such measurements could be taken in any primary tumor, regardless of its
size, stage, or grade, thus satisfying the criterion set forth earlier that new diagnostics of
metastatic disease measured in the primary tumor should not depend on the established measures
of lymph node evaluation or imaging.
2.4. Public health significance
Given that EMT marker expression levels measured in primary tumor cancer cells could
suggest whether the patient is at high risk for metastatic disease independent of any other
measurements, there are two ways in which EMT markers could improve CRC outcomes. First,
9
primary tumor is discovered that appears to be Stage II by current assessment procedures. The
oncologist would likely decide based on current guidelines that surgery alone will suffice to treat
the tumor and that no systemic chemotherapy is needed (15). However, if the tumor appears to
be generating metastases via EMT marker measurements, the oncologist could instead prescribe
chemotherapy in an attempt to destroy micrometastases that may be present but were not
detected via imaging or lymph node assessment. Second, if EMT marker levels in primary
tumor cancer cells are associated with patient outcomes, then new treatments could be developed
that target the markers in an effort to hold metastasis in check. In this report, our concern is
solely with the use of EMT markers to improve patient risk stratification.
Given how closely a CRC patient’s outcome is tied to accurate clinical assessment of
whether cancer cells have been detaching from the primary tumor, EMT markers hold
tremendous promise as tools to reduce CRC mortality. The goal of the present research was to
assess this promise by estimating associations between EMT marker levels in CRC primary
tumors at the time of tumor removal and subsequent patient outcomes. More specifically, we
sought to do this while designing measurements and analyses that could directly inform and
facilitate translation of EMT markers to the clinic, where their public health impact stands to be
10
Figure 2. Conceptual model of the role of EMT markers in determining CRC patient outcomes
2.5. Systematic review and marker selection
2.5.1. Systematic review of literature on EMT markers and CRC outcomes There is no generally agreed upon histopathological definition of EMT (16).
Consequently, we developed our own approach to measure EMT for this dissertation. The first
task was to select which EMT markers to measure in CRC specimens. To do so, we sought to
identify original journal articles that measured EMT marker expression levels in clinical CRC
tumor specimens and related those measurements to patient outcomes. On 26 October 2012, we
searched PubMed, EMBASE, and BIOSIS using the same search terms for all databases (see
Appendix A). No publication date or language limitations were applied to the search. The
searches consisted of four groups of terms: EMT, tumor markers, outcomes, and colorectal
cancer. To be captured, an item had to have at least one term from each group.
Our searches returned 545 abstracts. Removing 184 duplicates yielded 361 unique
abstracts. I read the 361 abstracts and created a spreadsheet to record the following for each
abstract: 1) which markers the study examined, 2) whether it looked at cell lines, animals, and/or More informed use of currently-available therapies and
development of new therapies that target EMT markers may improve subsequent outcomes
Patient dies Primary tumor releases metastases Primary tumor initiation and growth
11
clinical tissue specimens, 3) whether the paper was a review, and 4) whether it looked at
outcomes. Meeting abstracts, reviews, papers not written in English, and studies that only
looked at animals and/or cell lines were excluded.
Based on the 361 abstracts, 122 appeared to have used clinical CRC specimens and
therefore warranted closer examination. Inspection revealed that 46 were meeting abstracts and
1 was a case report. These 47 were excluded, leaving 75 original journal articles that examined
EMT markers in CRC tissue specimens. I then created a second spreadsheet documenting the
following information for each of the 75 papers: 1) sample size, 2) whether Kaplan-Meier
survival curves were presented, 3) whether effect estimates such as hazard ratios were calculated,
4) whether correlations between EMT marker levels and other measurements were presented, 5)
whether the percent of cases found to have positive expression of EMT markers was provided, 6)
whether any measures of reliability were reported, and 7) which EMT markers were measured.
Thirty papers measured at least one EMT marker in clinical CRC primary tumors and
evaluated the relationship between EMT marker expression and CRC patient outcomes via either
Kaplan-Meier analyses or effect estimates. Between them, these papers measured dozens of
markers or categories of markers (“categories of markers” meaning, for example, measurement
of multiple micro-RNAs counts as simply “micro-RNA”). Because of the sheer diversity of
EMT markers, we focused on 14 markers and marker categories prominently discussed in the
EMT literature: E-cadherin, N-cadherin, Vimentin, Snail, Slug, Cytokeratins, Integrins,
Fibronectin, Twist, ZEB1, ZEB2, Beta-Catenin, TGF-Beta, and Micro RNAs. We excluded 6
papers that did not measure at least one of these markers in clinical CRC specimens (17-22),
leaving a final set of 24 papers that I evaluated for the markers of interest (23-46), though many
12
For each of the 24 papers, I recorded the following additional information for each EMT
marker that the paper measured from our selection of 14 markers: whether marker expression
was measured as protein and/or RNA, how the study defined positive expression for the marker,
and whether the paper presented Kaplan-Meier analyses stratified by expression levels of that
particular marker.
2.5.2. Marker selection criteria
In reviewing the literature, we considered seven criteria for judging whether a particular
EMT marker might be useful as a clinical tool to assess whether a primary tumor has potentially
been releasing cancer cells:
1. Biological Role: The role of the marker in the EMT mechanism should be well
understood and critical.
2. Percent of subjects with positive expression: A marker that is positive for nearly 0% or
100% of patients is unlikely to provide much information about the prognosis for different
patients, given how common metastasis is (47). Markers for which there are appreciable
numbers of both marker-positive and marker-negative tumors are likeliest to be clinically useful.
3. Reliability: A useful EMT marker for clinical purposes will exhibit a high degree of
reliability when measured in clinical CRC specimens in the same way. The reliability of EMT
markers was difficult to assess because the literature provided little information about both
inter-rater and intra-inter-rater reliability. Such inconsistencies made comparisons between studies
difficult, even between studies that measured the same marker using the same laboratory
technique.
4. Validity: To determine the sensitivity or specificity of EMT markers, one would need
13
metastatic disease. It was not clear what could constitute such a gold standard in this context.
Conventional diagnostics of metastatic disease—lymph node evaluation and imaging--are not
satisfactory because the goal of using EMT markers is to identify those at risk of metastatic
disease even when no metastases are detected by the other diagnostics. Correlation between
EMT marker expression levels and results of the other diagnostics is a helpful, but not definitive,
demonstration of the validity of an EMT marker for clinical purposes.
5. Association with patient outcomes: If the expression levels of a marker play a role in
generating metastases and the marker is to serve as a clinical indicator of whether the patient is at
high risk for metastatic disease, then the expression levels should be associated with patient
time-to-death, that is, the length of time between primary tumor surgery and patient death. This
can be assessed using Cox proportional hazards modeling and Kaplan-Meier curves stratified by
marker expression levels.
6. Amount of prior data: Clinical utility ought to be supported by as many studies as
possible, each of which includes as many subjects as possible. All else being equal, we had more
confidence in markers the evidence for which was based on a greater number of subjects.
7. Ability to measure the marker: If a marker is difficult to measure accurately in a
clinical setting, its utility is limited no matter how strong the evidence for it may be according to
the other criteria described above.
2.5.3. Summary of systematic review findings
Because most studies measured markers only as protein, results refer to protein
measurements unless noted otherwise.
14
found no difference in outcomes between marker-positive and marker-negative subjects (34, 40).
The only study that looked at effect estimates did not find any effect of beta-catenin
measurements on outcomes (26). Percent of subjects with positive expression varied,
particularly by location in the cell (nuclear, cytoplasmic, membranous), but was generally in the
40-50% range. Correlations between beta-catenin levels and location in tumor mass were
inconsistent.
Cytokeratins: Of four studies that stained for cytokeratins, two (44, 46) used them only as a background stain. Of the other two studies, one (36) found that cytokeratin-8-positive
subjects had better survival than cytokeratin-8-negative subjects. Cytokeratin-14-negative cases
had better survival than cytokeratin-14-positive cases. The percent of subjects with positive
expression was high for cytokeratin-8 (85%) and moderate for cytokeratin-14 (59%). The last
study (31) found positive cytokeratin-7 expression in 9% of tumors and no effect on outcomes or
difference in survival based on cytokeratin-7 expression.
E-cadherin: We found 15 papers that measured E-cadherin in clinical CRC tissue. Of these, three that measured protein (31, 34, 41) and one that measured RNA (39) failed to provide
information on the number of tumors considered marker-positive. Among the other 11 studies, a
wide range of definitions of marker-positive status were used (24-27, 29, 35, 37, 38, 42, 43, 45).
Percent of subjects with positive expression varied but mainly fell between 30 and 70%. Three
studies looked at survival by E-cadherin status, with all three finding poorer survival associated
with reduced E-cadherin expression (24, 29, 43). Three studies looked at effect estimates, with
two finding no effect of E-cadherin levels on outcomes (26, 27) and one finding that E-cadherin
15
Fibronectin: No paper measured fibronectin levels in clinical CRC specimens and related them to outcomes.
Integrins: Two papers looked at members of the integrin family of proteins, which are mesenchymal markers in the context of EMT. One study found 19% of subjects with positive
expression for integrin alpha-5-beta-1 and 88% of subjects with positive expression for integrin
alpha-3-beta-1 but did not look at the association of either protein with outcomes (45). The
other, much larger study found 37% of subjects with positive expression for integrin
alpha-v-beta-6 and clear differences in survival and effect estimates for the protein’s relationship with
outcomes (23).
Micro-RNAs: Two papers measured micro-RNAs (miR), but one (39) did not provide information on how many tumors were considered marker-positive. The other study reported
that subjects with high expression of miR-19b and miR-194 had shorter survival than those with
low expression (32).
N-cadherin: Two studies measured the mesenchymal marker N-cadherin in clinical CRC specimens. One of them that included 10 subjects did not find positive N-cadherin expression in
any of their tumors, and did not look at the relationship of N-cadherin with outcomes (37). The
other study found 44% of subjects with positive expression and, while it did not look at survival
by N-cadherin status, calculated effect estimates and found no effect of N-cadherin on outcomes
(26). However, in the latter study, the 193 subjects were divided into training and testing sets
before effect estimates were calculated, thus reducing the power for each estimate.
Slug: Three studies measured the EMT inducer Slug, though one of them (30) that measured RNA failed to provide information on the number of tumors considered
16
with positive expression in primary tumors, and observed no difference in survival by Slug status
(37). The other study found 37% of subjects with positive expression (43). Slug-positive
patients in this last study had poorer survival than Slug-negative patients, and using hazard
ratios, the authors concluded that Slug was an independent prognostic factor of outcomes.
Snail: Four studies measured the EMT inducer Snail. Three found 40-55% of subjects with positive expression (26, 27, 37) and one found 79% positive (28), though the studies used a
variety of definitions of Snail-positive status. The two studies that looked at survival both found
worse survival in Snail-positive subjects than Snail-negative subjects (28, 37). The two studies
that did not look at survival did look at effect estimates, and each obtained mixed within-study
results (26, 27).
TGF-beta: One study measured a member of the TGF-beta class of EMT inducers, namely TGF-beta-R2. It found almost 90% of subjects with positive expression and no
difference in survival by TGF-beta status (40).
Twist: Four studies looked at the EMT inducing Twist family in clinical CRC specimens. One study (30) that measured mRNA of Twist1 found that 86% percent of subjects showed
positive expression and that those with positive expression had worse survival than those with
negative expression. Survival differences were especially large among early-stage subjects. Via
effect estimates, Twist levels had an effect on outcomes. The other three studies measured
protein. One with 10 subjects found 100% of subjects with positive expression but did not look
at outcomes (37). The other two studies found roughly 50% of subjects with positive expression
and did not look at survival (26, 27). Both calculated effect estimates, with mixed results.
17
marker-positive. The other three studies measured protein. Of these, two (31, 37) found 0% of
subjects with positive expression—despite using different definitions of marker-positive status—
and another (38) found 9% of subjects with positive expression.
ZEB1: In the three studies that measured the EMT inducer ZEB1, two (41, 44) did not report percent of subjects with positive expression. The other found 29% of subjects with
positive expression and that ZEB1-positive patients had much shorter average survival than
ZEB1-negative patients (31 months vs. 67 months, respectively) (38).
ZEB2: Two studies measured the EMT inducer ZEB2. One with 10 subjects found 90% of subjects with positive expression and did not look at survival or effect estimates (37). The
other study found that 48% of the tumors were ZEB2-positive at the tumor invasion front and
41% were ZEB2-positive at the tumor center (33). This study reported that 73% of the primary
tumors had greater ZEB2 expression at the invasion front compared to the tumor center.
ZEB2-positive patients had poorer survival than ZEB2-negative patients. In terms of effect estimates,
ZEB2 levels at the invasion front were a predictor of outcomes, but ZEB2 expression at the
tumor center was not.
2.5.4. Marker selection conclusions
Of the three kinds of EMT markers—epithelial markers, mesenchymal markers, and
EMT inducers—it was not clear that one kind was likelier than the others to be a clinically useful
predictive tool. Given budgetary constraints, we could only afford to measure a few markers.
As a compromise between these considerations, we decided to measure three markers, namely,
the most promising marker from each category based on prior literature.
Epithelial marker:
18
Discussion: Effectively, only one study looked at cytokeratin. Although it provides some
support for cytokeratin in terms of percent of subjects with positive expression and survival by
cytokeratin status, this is swamped by the large number of studies on E-cadherin. The overall
trend of the results suggests that E-cadherin is a promising marker in terms of percent of subjects
with positive expression and the marker’s association with outcomes. Furthermore, its biological
role in EMT is clear and important, and it is by far the most commonly-studied EMT marker.
Also, E-cadherin antibody had already been optimized by the UNC Translational Pathology
Laboratory that performed the benchwork for the project, making E-cadherin more cost-effective
to measure than cytokeratin.
Choice: E-cadherin
Mesenchymal marker:
Options: beta-catenin, fibronectin, integrins, N-cadherin, vimentin
Discussion: There was no relevant data about fibronectin. The data strongly suggest that
beta-catenin is not a good marker based on lack of association with outcomes and an inconsistent
percent of subjects with positive expression. Likewise, the data do not support vimentin based
on its percent of subjects with positive expression of 0% or close to it, as well as the lack of
information about whether it is associated with outcomes.
The two best candidates are N-cadherin and integrins, specifically integrin
alpha-v-beta-6. N-cadherin is appealing because it plays an important biological role in the EMT mechanism
(part of “cadherin switch” with E-cadherin) and in mesenchymal cell motility. In the one
meaningful study that measured N-cadherin (the other study being tiny), the percent of subjects
19
its association found nothing, but the sample sizes involved in the calculations were not large
(roughly n=100).
Two of the three integrins on which we have any data are not serious candidates; only
integrin alpha-v-beta-6 is. The percent of subjects with positive expression and clear association
with outcomes in the one large study provide stronger support than N-cadherin received from its
one relevant study. Integrin alpha-v-beta-6 and N-cadherin have similar biological roles as
membrane-bound proteins that help mesenchymal cells move through their environment. All
told, integrin alpha-v-beta-6 is the stronger option. However, the prior study that measured this
integrin in CRC primary tumors did so by measuring only the beta-6 sub-unit and then making
an inference from that to the alpha-v-beta-6 complex (23). To make our study comparable, we
decided to measure only the beta-6 sub-unit as well.
Choice: Integrin beta-6
EMT inducer:
Options: Slug, Snail, TGF-beta, Twist, ZEB1, ZEB2
Discussion: TGF-beta was dismissed because the one study that measured it gave clear
evidence that it is not a good marker. The evidence was similar and moderately supportive for
the other five options. Each was measured in 2-4 studies, with a mixture of results suggesting
that the marker is and is not associated with outcomes. Considering all of our selection criteria,
Snail seemed the best choice because it was measured in the greatest number of studies,
generally had ideal percentages of subjects with positive expression, and had as much evidence
showing an association with outcomes as any of the other candidates.
20
CHAPTER3. METHODS 3.1. Subject selection and enrollment
3.1.1. Study population
The Cancer Care Outcomes Research and Surveillance Consortium (CanCORS) study
was undertaken by a consortium of seven teams of investigators across the United States (48).
Their aim was to study the impact of the characteristics of healthcare delivery systems, patient
characteristics, and patient beliefs on cancer outcomes. The study was a population-based,
case-only prospective cohort of lung and colorectal cancer patients. Subjects were enrolled between
2003 and 2006. Every site collected patient surveys, physician surveys, and medical records
data. Subjects completed surveys at baseline, 12 months after baseline, and 5 years after baseline
(49). Upon enrollment, each subject identified a proxy respondent who completed the next
follow-up survey in the event of the subject’s death or inability to complete the survey.
The patient surveys asked questions on a range of topics, including demographics,
treatments received (surgery, radiation, chemotherapy), quality of life, and health history and
behaviors. Tumor specimens were collected only among North Carolina subjects. Since the
main exposures of interest in this dissertation were primary tumor expression levels of EMT
markers, our study sample was limited to NC subjects for whom tumor tissue was available.
The NC site was based at the University of North Carolina at Chapel Hill (UNC). It
enrolled 990 incident colorectal cancer (CRC) cases during the CanCORS enrollment period (50)
21
population-based, case-only prospective cohort of incident CRC cases from the 33 counties in
2003-06.
3.1.2. Subject identification, recruitment, and enrollment
During the enrollment period, incident CRC cases were identified using a rapid-case
ascertainment protocol through the NC Central Cancer Registry, to which all new cases of CRC
in the study region must be reported (52). Of 1,899 nominally eligible case reports, 350 were
found to be ineligible and 43 could not be contacted due to physician refusal. Of 1,506 eligible,
contactable cases, 326 refused to participate, 77 could not be reached, and 85 were not capable of
giving consent and had no proxy to participate in their stead. This left 1,018 cases who agreed to
be interviewed, provide medical record data, or both, giving a response proportion of
1,018/1,506 = 67.6%. Of the 1,018 eligible subjects who agreed to participate, 28 did not end up
enrolling for unspecified reasons, giving the final UNC study sample of 990.
Whenever possible, the patient survey was administered to the patient or to a proxy 4
months from the date of diagnosis. Information from all patients selected for contact was
included in the data from the cohort, regardless of the survival status of the patient. For patients
who died by the time of initial contact or before the time of a scheduled interview, attempts were
made to interview an eligible proxy or surrogate.
If the patient was not able to complete an interview, a surrogate had to be interviewed
instead. Eligibility criteria for surrogates were: at least 18 years old; patient gave consent for
investigators to speak with the surrogate or the patient is dead; the patient indicated that the
surrogate knows best how the patient has done since diagnosis; and the surrogate had to reside in
22
Of the 990 subjects enrolled in NC, 506 subjects (51%) provided tumor specimens. The
major reasons for not obtaining tumor tissue from all study subjects were that subjects did not
consent to donate tumor tissue, and among those who did consent to give tissue, adequate tumor
blocks for research were not always available after surgery. Our study sample for the
dissertation was a subset of the 506 NC subjects who provided tumor specimens.
3.1.3. Subject eligibility criteria Inclusion criteria were as follows (52):
a) Sex: males and females eligible
b) Age: 21 years or older at time of diagnosis
c) Race: no exclusion based on race/ethnicity
d) Residence: At the time of diagnosis and initial contact, patient had to be a
resident of one of the 33 counties constituting the study region.
e) Language: Able to complete study interviews in English, Spanish, or Chinese
f) Cancer Diagnosis: A histologically-confirmed diagnosis of colorectal cancer
on 1 January 2003 or later. All stages of disease except in situ were
eligible.
3.2. Specimen collection 3.2.1. Collection at clinics
Tumor specimens were collected at the clinics across NC that performed cancer surgery
on enrolled subjects. Portions of these tumors were transported to UNC. Tumor samples were
fixed in formalin and embedded in paraffin after surgical removal (53). Since this initial tissue
23
may have been variation in terms of fixation protocols, time from tumor removal to fixation,
storage conditions at the clinic, and technician skill.
During the CanCORS data-collection period, investigators were informed via the
rapid-case ascertainment system of new, nominally-eligible incident rapid-cases of CRC within the study
region. Investigators checked the pathology report of each case to confirm eligibility (54). For
example, they ensured that the diagnosis was for invasive carcinoma since in situ tumors were
not eligible. After confirming patient eligibility, investigators requested tumor blocks from the
hospital or clinic that performed the patient’s cancer surgery. The goal was to obtain two blocks
of tumor tissue and two blocks from the tumor margins per patient, the latter including adjacent
normal tissue (55). Biopsies and metastases were not requested. When the primary tumor had
spread to an adjacent organ beyond the colon or rectum (but without metastasizing), investigators
obtained normal tissue from the adjacent organ.
3.2.2. Specimen preparation and storage at UNC
Upon receiving a patient’s tumor blocks at UNC, investigators cut the tissue to prepare
histology slides, which were then stained with hematoxylin and eosin (53). A trained pathologist
verified which parts of a stained slide were normal or tumor. The tissue was then incorporated
into a tissue microarray (TMA) along with tissue samples from other subjects. Using the
pathologist’s indications on the stained slides as to which parts of tissue samples were normal
and which were tumor, a TMA technician punched cores of normal and tumor samples from a
given patient’s blocks. Most patients had six cores on a TMA: 3 cores of normal tissue and 3
cores of tumor tissue. Some patients had more or less than 3 cores of a given tissue type.
24
Once prepared, TMAs were stored at 4 degree Celsius (54). Slides cut from the TMA but
left unstained for future use were stored at -80 degrees Celsius. Any unused tissue was returned
to the hospital or clinic from which it was obtained.
3.2.3. Control specimens
Tissue specimens for positive and negative controls were obtained from the Funkhouser
Laboratory in the UNC Department of Pathology and Laboratory Medicine. Positive control
specimens were colorectal tumor tissue and negative control specimens were normal
(tumor-free) colorectal tissue. Controls came from UNC patients who were not enrolled in CanCORS.
3.2.4. Sample size
The specimens of the 506 CanCORS participants who provided CRC tissue samples were
distributed across 56 TMAs stored at the Keku Laboratory. To minimize costs and use of
specimens, the dissertation committee recommended staining slides from a subset of subjects
large enough to provide a reasonable chance of observing a substantial hazard ratio estimate. If
little variation was found for a particular marker in a sufficiently large subset, this could suggest
that the expression levels of the marker likely are not able to distinguish between tumors that are
behaving differently from each other (47), assuming the sample includes a mixture of tumors
with high and low levels of cancer cell detachment. Logically, this would imply that it was not
worthwhile to measure a marker with a narrow expression distribution in more subjects.
Many of the TMAs containing CanCORS subject specimens also contain specimens
collected for another study (the Rectal Study). Some subjects were enrolled in both CanCORS
and the Rectal Study; such individuals were treated as CanCORS subjects. Random selection of
TMAs for the subset might have resulted in selecting TMAs containing only one or two
25
efficiency, we selected TMAs from among those containing the greatest number of CanCORS
subjects so that a minimal number of TMAs had to be stained to provide the desired sample size.
Table 1 shows the results of sample size calculations using PROC POWER in SAS. The
parameters used in the calculations were based on the E-cadherin, Integrin, and Snail results
from the systematic literature review (see Section I.E). From the literature overall, a 30%
proportion of patient deaths within 5 years of surgery in the unexposed (those with
non-EMT-like marker expression levels) seemed reasonable and the analysis of the subset aimed to achieve
80% power. As Table 1 indicates, this meant the analysis should have a sample size of at least
165 subjects.
Table 1. Sample size calculations for initial selection of subjects*
% outcomes (deaths) In unexposed (those with Non-EMT marker levels)
Statistical Power 70% 80% 90%
20% 190 240 325
30% 130 165 220
40% 100 130 170
*Total sample size for 70%, 80%, or 90% power to detect a hazard ratio of 2.00 across 5 years of follow-up, for 40% exposed (i.e. EMT-like marker levels) and with varying percentages of outcomes (deaths) in unexposed (i.e. non-EMT-like marker levels) over the 5-year window, with a 2-sided alpha of 5%.
In anticipation of possible laboratory error when handling the tissue samples, specimens
from 236 subjects across 13 TMAs with large numbers of CanCORS subjects were prepared for
staining. One TMA with specimens from 17 subjects could not be used because the position of
cores on the tissue section did not match the map for the TMA, making it impossible to
determine the identity of the cores. This reduced the available sample size to 219 subjects. To
be included in the study sample, subjects had to have at least one core of tumor tissue
26
unambiguous histology. From the 12 TMAs, we excluded 26 subjects lacking adequate tumor
tissue and an additional 3 subjects who could not be linked to medical records data, yielding a
final study sample of 190 subjects.
Figure 3 shows the overall flow of subject inclusion from nominally-eligible CRC cases
27 Figure 3. Flow of patient eligibility and inclusion
1,506 eligible, contactable cases
990 enrolled NC-CanCORS subjects 484 did not provide tumor specimens 1,899 nominally-eligible CRC cases
during 2003-06 in NC-CanCORS catchment area (33 counties in eastern and central NC)
350 ineligible 43 physician refused contact with case
326 refused participation 77 could not be reached 85 could not give consent and had no proxy 28 did not enroll for unspecified
reasons
506 provided tumor tissue 270 on TMAs not used due to budgetary constraints
236 subjects on immunostained TMAs
17 on a TMA for which position of cores on tissue section did not match TMA map, preventing determination of identity of cores 26 lacked adequate tumor tissue 3 could not be linked to medical
records data 190 subjects in final EMT study
28 3.3. Specimen staining
3.3.1. Acquisition of antibodies for immunohistochemistry The following antibodies were purchased:
a) E-cadherin: Mouse monoclonal ready to use (RTU), clone 36B5
(cat #PA0387) from Leica Microsystems Inc. (Norwell, MA)
b) Integrin beta-6: Goat polyclonal (sc-6632) from Santa Cruz
Biotechnology (Dallas, Texas)
c) SNAIL1: Goat polyclonal (ab53519) from Abcam (Cambridge, MA)
3.3.2. Immunohistochemistry staining procedures
Immunohistochemistry (IHC) was performed at the UNC Translational Pathology
Laboratory (TPL) using the Bond fully-automated slide staining system (Leica Microsystems
Inc., Norwell, MA). Slides were deparaffinized in Bond Dewax solution (AR9222) and hydrated
in Bond Wash solution (AR9590). Antigen retrieval was performed at 100C for Integrin beta-6
and Snail (for 20 minutes or 30 minutes, respectively) in Bond-epitope retrieval solution 1 at pH
6.0 (AR9961) and for E-cadherin for 20 minutes at 100C in solution 2 at pH 9.0 (AR9640).
After pretreatment, anti-E-cadherin was applied for 15 minutes, anti-Snail (1:200) for 30 minutes
and anti-Integrin beta-6 (1:100) was applied for 1 hour.
Detection of Snail and Integrin beta-6 was performed using the Bond Intense R Detection
System (DS9263) supplemented with the LSAB+ kit (DAKO, Carpinteria, CA). E-cadherin
detection used the Bond Polymer Refine Detection System (DS9800). Stained slides were
dehydrated and cover-slipped. Positive and negative controls (no primary antibody) were
29
Stained slides were digitally imaged at 20× magnification using the Aperio ScanScope
XT (Aperio Technologies, Vista, CA). Digital images were stored in the Aperio Spectrum
Database. Example images of staining and annotations are provided below in Figures 4-6.
30
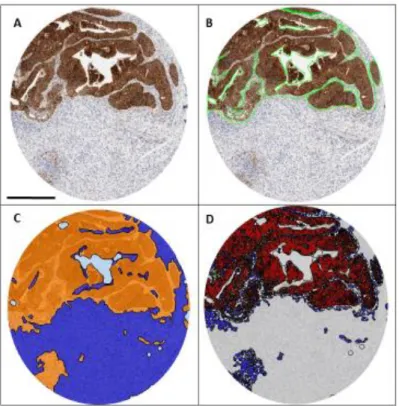
Figure 5. Illustration of Tissue Studio analysis of colon tumor tissue
31
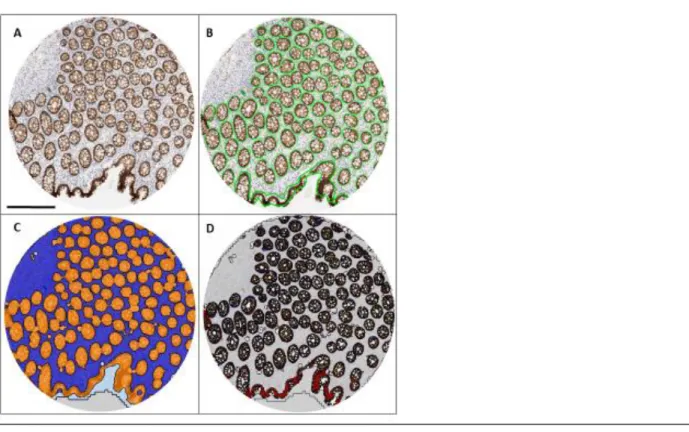
Figure 6. Illustration of Tissue Studio analysis of normal colon tissue
(A) Original image of TMA core stained for E-Cadherin. Bar = 300um. (B) Green lines show manual annotation of colon crypt areas on image (C) Mark-up of image by Tissue Studio Composer. The algorithm was trained to differentiate between epithelial and stromal regions. Orange highlighted areas are enriched in epithelial cells and closely match the regions that were manually annotated in (B). Blue highlighted areas are enriched for stromal cells. Only the epithelial enriched regions were analyzed. (D) Mark-up of analysis results for normal tissue. Blue= IHC negative, yellow = 1+, orange = 2+, red = 3+ (staining intensity).
3.4. Digital image annotation and analysis 3.4.1. Annotation rationale and goal
Tumors contain not only cancer cells but numerous other kinds of cells, including
fibroblasts, endothelial cells, cancer stem cells, and immune cells (Figure 7) (11). Metastases
form from a subset of the cancer cells within a primary tumor and not from the other cell types.
However, EMT markers may be expressed—or not expressed—by all types of cells found in a
tumor. Thus, when digital slide images are scored by computer, results could be misleading if
32
expression of cancer cells is relevant to determining whether the tumor has been producing cells
capable of acting as metastases, images must be marked (i.e. annotated) prior to scanning to
restrict the computer’s analysis of marker expression to cancer cells.
The goal of image annotation was to mark images prior to scoring such that all cancer
cells in the image would be included in the analysis of marker expression while all other cells
would be excluded.
Figure 7. Reductionist and heterotypic representations of cancer tumors (from Hanahan and Weinberg, 2000) (11)
3.4.2. Image annotation and scoring procedures
Computer algorithms annotated and scored every eligible tissue core to obtain continuous
marker expression data. Continuous expression data were sought because marker expression is
inherently continuous. In addition, continuous data provided maximum flexibility in identifying
33
the binary nature of treatment decisions. We used approximately 65 cores originating from two
TMAs for algorithm training and automated-analysis validation.
Definiens Composer Technology (Tissue Studio version 2.1.1 with Tissue Studio Library
version 3.6.1; Definiens Inc., Carlsbad CA) was used to identify regions enriched in epithelial
cells in IHC-stained TMA cores. To detect differences in cell shape and tissue structure, we
developed two Composer algorithms per marker—one for cores containing normal adjacent
tissue and a second for tumor cores—as both types of tissue were present on each TMA.
After Composer training, we developed two Tissue Studio scoring algorithms
(“solutions”) per marker. Different Composers were used to identify epithelial cell regions but
identical settings were used to determine relative DAB staining intensity. The
Composer_MarkerArea Solution was used to detect E-cadherin staining. This algorithm gave
average intensity readings for each core on a continuous scale of 0-3 and included both
membrane and cytoplasmic E-cadherin staining. Integrin beta-6 membrane staining was
detected using the Composer_Nuclei_Membranes&Cells Solution. We used the
Composer_Nuclei(Positive_vs_Negative) Solution to detect nuclear Snail expression. Integrin
beta-6 and Snail were measured as core percent positive cells (Integrin) or nuclei (Snail) on a
continuous scale of 0-100.
To evaluate the reliability of computer annotations, I used Aperio ImageScope (version
11.2; Leica Biosystem, Buffalo Grove, IL) to manually annotate the same 65 cores per marker
that were used to optimize Tissue Studio solutions. Included regions were marked with the
positive pen and excluded regions were marked with the negative pen. I remained blind to
patient and tumor characteristics while annotating. This was accomplished by keeping TMA