NATURAL AND ANTHROPOGENIC DRIVERS OF OYSTER REEF COMMUNITY DYNAMICS
Maxwell Lovell Tice-Lewis
A thesis submitted to the faculty at the University of North Carolina at Chapel Hill in partial fulfillment of the requirements for the degree of Master of Science in the Department of Marine
Sciences.
Chapel Hill 2018
2018
ABSTRACT
Maxwell L. Tice-Lewis: Natural and anthropogenic drivers of oyster reef community dynamics in a temperate estuarine context
(Under the direction of F. Joel Fodrie)
ACKNOWLEDGEMENTS
TABLE OF CONTENTS
LIST OF TABLES………..….viii
LIST OF FIGURES………ix
CHAPTER 1: ABIOTIC DRIVERS OF OYSTER-REEF COMMUNITY DYNAMICS IN TWO TEMPERATE ESTUARIES………..1
Introduction………..1
Materials and Methods……….5
Study sites………5
Continuous temperature and salinity monitoring……….6
Oyster reef sampling………7
Statistical analyses...………8
Results…...……….10
Faunal Composition...………11
Community structure response to abiotic gradients………...12
Discussion………..14
References………..34
CHAPTER 2: MULTIDECADAL CHANGES TO ESTUARINE GRADIENTS AND OYSTER-REEF COMMUNITIES: A COASTAL SQUEEZE FOR OYSTERS?...41
Introduction………41
Materials and methods………...……44
Salinity data collection………...46
Oyster community collection……….47
Statistical analyses………...48
Results………51
Multi-decadal salinity trends………..51
Community comparison: Wells vs. 2013-2015……….51
Discussion………..55
Mechanisms of community change………...55
Factors influencing salinity changes………..59
A “coastal squeeze” for subtidal oysters………61
References………..71
LIST OF TABLES
Table 1.1 – Newport and North River sampling locations………24
Table 1.2 – Species accounting for factor-group similarities via SIMPER…….………..25
Table 1.3 – Average dissimilarities between salinity-tidal emersion groups………27
Table 2.1 – Newport River oyster site characteristics………...66
Table 2.2 – Oyster reef sampling regimen in the Newport River 2013-2015………...…………67
LIST OF FIGURES
Figure 1.1 – Map of Newport and North River oyster reef sampling sites………28
Figure 1.2 – Relationship between mean salinity and salinity standard deviation………....29
Figure 1.3a – Newport River temporal mean salinity trend………...30
Figure 1.3b – Newport River temporal salinity standard deviation trend………..30
Figure 1.3c – North River temporal mean salinity trend………...30
Figure 1.3d – North River temporal salinity standard deviation trend………..30
Figure 1.4 – Mean oyster densities across tidal emersion-salinity contexts………..31
Figure 1.5 – Mean species richness across tidal emersion-salinity contexts……….32
Figure 1.6a – Relationship between oysters and species richness on intertidal reefs………33
Figure 1.6b – Relationship between oysters and species richness on subtidal reefs……….33
Figure 1.7 – Nonmetric multidimensional scaling plot coded by tidal emersion and salinity…...34
Figure 1.8a – Relationship between salinity and oyster density on intertidal reefs…………...…35
Figure 1.8b – Relationship between salinity and oyster density on subtidal reefs………35
Figure 1.8c – Relationship between salinity and species richness on intertidal reefs…………...35
Figure 1.8d – Relationship between salinity and species richness on subtidal reefs……….35
Figure 2.1 – Newport River oyster reef sampling sites for Wells (1961) and 2013-2015 surveys……….70
Figure 2.2a – Historical trend in yearly mean, maximum, and minimum salinity at Cross Rock……….………..71
Figure 2.2b – Historical trend in yearly mean, maximum, and minimum salinity at White Rock……….………..71
Figure 2.2c – Historical trend in yearly mean, maximum, and minimum salinity at Pivers Island………....71
CHAPTER 1: ABIOTIC DRIVERS OF OYSTER-REEF COMMUNITY DYNAMICS IN TWO TEMPERATE ESTUARIES
Introduction
Biogenic habitats are among the most ecologically important features in global
ecosystems. Species that form biogenic habitats, or foundation species, such as corals and plants engineer complex structures underpinning diverse faunal assemblages. The distribution of foundation species and associated faunal assemblages are regulated by the interactions between spatiotemporally varying abiotic physiological stressors, competition (Connell 1961), predation (Paine 1966), disturbance (Dayton 1971), and facilitation (Bruno et al. 2003). Anthropogenic disturbance threatens ecosystems through direct harvest and use, landscape modifications, climate change, pollution, and resource extraction, which may physically deteriorate biogenic habitats or cause shifts in abiotic conditions thereby changing environmental suitability for the foundation species and associated biota (Lenihan and Peterson 1998). Biodiversity enhances ecosystem functioning, services (Worm et al. 2006) and resilience (Elmqvist et al. 2003). In the face of global losses of biogenic habitats (Beck et al. 2011), it is critical to understand how biogenic habitats and associated communities vary in response to natural abiotic gradients to enhance the efficacy of restoration and conservation efforts and resilience to future
environmental perturbations.
shoreline environments that structures communities across both abiotic and biogenic habitat types (Connell 1961, Pennings and Bertness 2001, Fodrie et al. 2014). Natural gradients in salinity are an inherent feature of the estuarine environments (Pritchard 1952) that heavily influence community structure,in habitats such as marshes, oyster reefs, and mudflats (Odum 1988, Wells 1961, Ysebaert and Herman 2002). In North Carolina, Wells (1961) sampled reef communities across a polyhaline-euhaline salinity gradient, revealing distinct
oyster-associated species distribution patterns correlating directly with location along the salinity gradient. Oyster patches in higher salinity areas exhibited higher species richness than areas with lower means and higher variability (Wells 1961, Ortega and Sutherland 1992). Freshwater disturbances, referred to as freshets, occur after intense precipitation events, rapidly altering the salinity throughout an estuary, and can lead to massive die-offs of oyster associated fauna, and even oysters themselves (Wells 1961). These reoccurring events (hurricanes and seasonally varying rainfall) can serve as a reset to the oyster community, allowing oyster-reefs lying close to predator and pest salinity tolerance thresholds a release from those negative biotic interactions (Fodrie et al. 2014, Walles et al. 2016). Wet and dry seasons may have a substantial impact on oyster community structure as a whole; communities may shift differentially in response to interannual precipitation variability depending on their location in the estuary, and community variability among locations may increase or decrease depending on precipitation (Tolley et al. 2006). Eastern oysters (Crassostrea virginica) are an ecologically and socially important
decapods, non-decapod crustaceans, bivalves, gastropods, porifera, bryozoans, cnidarians, etc.), juvenile and resident fishes, all of which attract larger transient predatory fishes during foraging (Wells 1961, Meyer and Townsend 2000, Lenihan et al. 2001, Lehnert and Allen 2002,
Grabowski et al. 2005, Tolley and Volety 2005).
Over latitudinal gradients, eastern oysters exhibit differences in distribution relative to the tidal gradient. In the South Atlantic Bight, oysters are typically intertidal (Byers et al. 2015), while north of North Carolina, oysters are predominantly subtidal in distribution. In North Carolina, both subtidal and intertidal oysters occur in single estuarine systems. Researchers have noted for centuries that in euhaline, lower portions of estuaries, oysters are predominantly intertidal, whereas subtidal oysters are only found in mesohaline areas with more freshwater inflow (Winslow 1886, Grave 1901). The restriction of oyster populations to the intertidal in euhaline regions occurs as a result of largely marine, desiccation intolerant predators and competitors that limit oyster survival at the settlement and early post-settlement life history stages in the subtidal (Mackin 1946, Chestnut and Fahy 1953, Fodrie et al. 2014, Johnson and Smee 2014). Competitors limiting the settlement and recruitment of oysters in subtidal euhaline zones include sessile bivalves, sponges, ascidians, and bryozoans (MacDougall 1943). In fact, the benefit of reduced competition for resources in the intertidal outweighs the costs associated with tidal emersion (Bishop and Peterson 2005). Oyster predators and bioeroders such as
worst cases, specifically when carbonate substrates are utilized, creation of nursery habitat for oyster enemies (N. Lindquist, personal communication).
Materials and Methods
Study sites
Oyster reef sites selected for surveys occur within the Newport River Estuary (NPRE) and North River Estuary (NRE) in Carteret County, NC (Figure 1.1). The NPRE, located north of Morehead City and Beaufort, was selected to revisit habitats originally sampled by HW Wells from 1955 to 1956. The NPRE is a shallow, well-mixed system with an average residence time of 6 days or 12 tidal cycles (Jennings et al. 1970, Kirby-Smith and Costlow 1989). In addition, there is a long history of shellfishing in the upper NPRE, and has been an area of focus for oyster research since the 19th century. The North River Estuary was selected due its reputed oyster productivity (Grave 1904), protection from mechanized harvesting, and five recent cultch plantings (3-5 years old) created by the N.C. Division of Marine Fisheries. No information is available for mixing and exchange rates in the North River. Notably, both study sites are important areas for commercial and recreational oyster harvesting.
In the NPRE, five sites were selected to from most saline and least salinity-variable to least saline and most salinity-variable. The NPRE sites were (site names in parentheses indicate river basin: NP or NR, low numbers are closer to Beaufort Inlet, and tidal regime, “I” for intertidal and “S” for subtidal): Pivers Island (NP1I), Newport River Yacht Club (NP2I), White Rock (NP3I), Cross Rock Intertidal (NP4I) and Cross Rock Subtidal (NP4S). Six sites were selected for sampling in the NRE, encompassing a similar linear distance to Beaufort Inlet as that of the NPRE, such that broad comparisons between the two basins are possible. Sites listed from highest to lowest salinity are Carrot Island Subtidal (NR1S), Carrot Island Intertidal
Research Reserve, and is naturally occurring. Immediately adjacent to NR1I, and part of the same reef complex, exists a shallow subtidal reef (NR1S). Many adult oysters at NR1S appear to be of intertidal origin, dislodged at some point in time and forming this subtidal continuation of the larger intertidal patch. Upstream, NR2I is a naturally occurring intertidal patch reef within the North River Marsh complex. The first restored subtidal reef in our sampling regime, termed NR3S (NCDMF 2011 cultch planting # 11-011) exists south of the Highway 70 Bridge running over the North River. North of the bridge is the restored subtidal site NR4S, the NCDMF 2010 cultch planting # 10-012. The freshest site, NR5S, is a natural subtidal reef immediately south from the mouth NRE narrows.
Continuous temperature and salinity monitoring
fouling organisms were scraped from the logger housing and an additional calibration run was completed to serve as a beginning reference for the subsequent salinity sampling period. Raw conductivity data (mS/cm) were converted from conductivity to salinity (ppt) using the appropriate algorithms developed by Fofonoff and Millard (1983) and integrated into Microsoft Excel by Douglass (2010). Calibration drift was assumed to have begun immediately following deployment and ending at logger retrieval. Raw salinity was corrected for linear drift using calibration curves from before and after deployment.
Oyster-reef sampling
To assess oyster abundances and the structure of associated faunal assemblages, each site was sampled bimonthly beginning in August of 2013 and ending December of 2015, using the methodology of Grabowski et al. (2005). To sample a reef, three 0.1m2 quadrats (0.325 m x 0.325 m) were thrown haphazardly. An aluminum core was placed in the middle of each quadrat to 10cm past the surface of the mud layer, and the contents were placed in plastic woven
porous bioeroded shells will exit the shell or become exposed when dissolved oxygen becomes depleted in the jar (S. Fegley, personal communication). In quadrat and core samples, all fauna visible without microscopy were identified to the lowest possible taxonomic level using appropriate field guides, dichotomous keys, and online resources. Fauna not immediately identifiable, often due to high within-sample diversity and density, such as amphipods, were fixed in 10% formalin solution and transferred to 70% ETOH for long-term preservation and later enumeration. Additionally, microscopic photography using a Leica EC4 camera was utilized to aid in identification. All fauna were counted and identified to the lowest possible taxonomic level, abundances were recorded and standardized to 0.1m2. Oysters in core samples were measured (no more than 20 oysters) from the hinge to the outer edge of the right valve and meats were dried and weighed. Response variables inferred from these methods include species richness and evenness, abundance, oyster length, and oyster biomass.
Statistical analyses
To test if temporal trends in salinity existed over the 2013-2015 sampling periods, four linear regression models were run using temperature (oC) as the independent variable and salinity (ppt) and salinity standard deviation (ppt) as dependent variables, for each estuary. Salinity and temperature values used were calculated as the mean of all salinity and temperature
measurements in the 1-month leading up to each oyster-reef sample.
employed because pooled oyster density and richness data did not meet ANOVA assumptions for equality of variances (Welch’s test, p<0.05) and normality.
To evaluate any potential relationships between species richness and living oyster abundance, separate linear regressions were conducted for intertidal and subtidal samples.
All univariate statistical analyses were completed using the base R statistical software and JMP Pro 13.0 (SAS).
Non-metric dimensional scaling (NMDS) ordination was conducted to explore patterns in the data related to temperature (season), salinity and tidal emersion factors. NMDS is an
ordination technique based on Bray-Curtis dissimilarity matrices and is a valuable tool for
exploring relationships between biological communities that may be structured by environmental gradients (Clarke and Warwick 2001). Abundance data were 4th-root transformed to down-weight the occurrence of common species (Clarke and Warwick 2001). An NMDS plot was determined acceptable for use if stress values were >0.2.
Results
Salinity and temperature
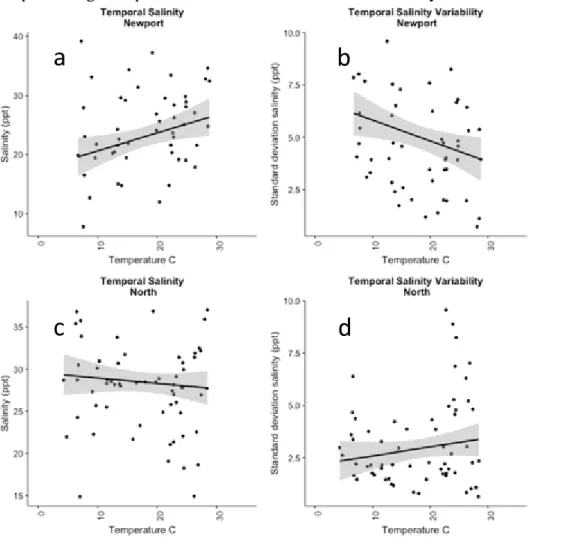
Continuous salinity measurements from September 2013 – December 2015 revealed the expected salinity gradients in the Newport and North Rivers; sites closer to Beaufort Inlet have higher salinity means and lower standard deviations (Table 1.1). Salinity variance displayed a significant negative relationship with mean salinity at a given site (F=129.8, p<0.001) (Figure 1.2). In the Newport River, higher temperatures correlated with higher salinities (F=6.069, p=0.0166) (Figure 1.3a) and lower variability (standard deviation) (F=6.091, p=0.0165) (Figure 1.3b), indicating higher salinities in summer months and lower salinities in winter months. The North River showed no significant temporal trend in salinity mean (F=0.6694, p=0.4159) (Figure 1.3c) or standard deviation (F=0.6694, p=0.4159) (Figure 1.3d).
Oyster densities
Across both the Newport and North Rivers, oyster densities were higher on natural intertidal reefs than on subtidal reefs in all salinity regimes (Mann-Whitney, Z=-9.8, p<0.0001). Intertidal low salinity (<20ppt average salinity) oyster-reefs supported 41.2% lower oyster densities (128.36/0.1m2) than reefs at intermediate salinity regimes (194.96/0.1m2)
(Mann-Whitney, Z=2.19, p=0.029). Oyster densities on high salinity intertidal reefs (146.67/0.1m2) were 28.27% lower and 13.31% higher than densities at intermediate and low salinity locations
with mean salinity (Figure 1.8a). Subtidal oyster-reefs also showed no significant trend in oyster abundance with salinity (Figure 1.8b). Species richness
In the Newport and North Rivers, intertidal oyster-reef species richness varied very little between low, intermediate, and high salinity regimes (Figure 1.5). On subtidal oyster reefs at high salinities, species richness was highest of any salinity and tidal emersion regime, averaging 20.08 species/0.1m2. Intermediate salinity, subtidal oyster-reefs were significantly less diverse than high salinity subtidal reefs (Wilcoxon, Z=-3.796, p=0.0001) and significantly more diverse than low salinity, subtidal reefs (Wilcoxon, Z=-4.039, p<0.0001). High salinity subtidal reefs were also significantly more diverse than low salinity subtidal reefs over the course of the study (Wilcoxon, Z=-5.034, p<0.0001). No significant correlations were found between 1-month pre-sample averaged salinity and species richness on intertidal reefs (Figure 1.8c). Subtidal reef species richness displayed a significant positive linear relationship with salinity (F=21.92, p<0.0001) (Figure 1.8d).
Oyster density was a poor predictor of species richness in intertidal oyster-reef settings across salinities (Figure 1.6a). However, in subtidal settings, there was a strong linear correlation between oyster density and species richness (F=17.85, p<0.0001) (Figure 1.6b).
Faunal composition
In total, 273 species were collected and identified from August 2013 – December 2015, comprising 12 phyla. Major groups found on oyster-reefs in this study include errant polychaetes (Subclass: Errantia; 29 species), sedentary polychaetes (Subclass: Sedentaria; 25 species),
isopod crustaceans (Order: Isopoda; 5 species), gastropods (Class: Gastropoda: 26 species), barnacles (Class: Maxillopoda: 6 species, Hexanauplia; 1 species), oligochaetes (Order:
Haplotaxida; 1 species), Collembola (1 species), porifera (Class: Demospongiae; 3 species), and bryozoans (Gymnolaemata; 4 species). Other groups were collected in this study, but not
typically common included sea spiders (Class: Pycnogonida), peanut worms (phylum: Sipuncula), flatworms (Class: Rhabditophora), and ascidians (Class: Ascidiacea).
Community structure response abiotic gradients
NMDS analysis revealed natural groupings based on abiotic environmental variables. Communities showed no obvious grouping based on season (Fall, Winter, Spring, Summer) and envfit showed no significant temporal correlation (R2=0.008, p=0.899). There was a strong grouping of communities based on tidal emersion regime (intertidal or subtidal) and envfit revealed a strong correlation between the tidal emersion vector and the community data (R2=0.37, p<0.001). Dispersion between samples was more pronounced in subtidal oyster-associated faunal communities than with intertidal communities, suggesting intertidal communities were more similar to one another. NMDS ordination by salinity bin (low, mid, high) revealed clustering of communities based on salinity differences (Figure 1.7) and envfit salinity correlation was significant (R2=0.34, p<0.001). Ordination based on a combined salinity and exposure factor guided subsequent multivariate analyses to understand differences in
community structure across estuarine salinity gradients between tidal emersion regimes. Across group combinations of salinity and tidal emersion, community structure varied significantly (ANOSIM, global R=0.66 p>0.01). Subsequent pairwise comparisons (post-hoc) reveal
characterized the high salinity intertidal, polychaetes, Maryphysa sanguinea, Cirratulus grandis,
andthe bivalve, Sphenia antillensis that were not abundant in the mid salinity intertidal, while mid salinity intertidal reefs were characterized by just one species not abundant in the high intertidal, the polychaete Nereiphylla fragilis - these faunal differences were insufficient for statistically significant differences in community structure. All pairwise comparisons were significant at the p<0.001 level, except for the comparison between low salinity intertidal and mid salinity intertidal reef community structure, for which p=0.008.
SIMPER analysis for oyster-reef communities pooled by exposure regime (intertidal, subtidal) reveals intertidal sites were on average, 74.43% dissimilar to subtidal sites (Table 1.2). Excluding Porifera and Bryozoa (presence/absence), on intertidal reefs across salinity regimes, 14 species accounted for 90% of the cumulative similarity, listed in order of percent
contribution: Alitta succinea, Eurypanopeus depressus, Panopeus herbstii, Geukensia demissa, Boonea impressa, Balanomorpha spp., Brachidontes exustus, Anurida maritima, Loxothylacus
panopeae, Polydora websteri, Melita nitida, Marphysa sanguinea, Amphipod spp., and
Sphaeroma quadridentata. Across salinities on subtidal oyster locations, 24 species account for 90% of the cumulative similarity, listed in order of percent contribution: Alitta succinea,
Marphysa sanguinea, Hydroides dianthus, Corophiid spp., Urosalpinx cinerea, Amphipod spp.,
Panopeus herbstii, Eurypanopeus depressus, Balanomorpha spp., Alpheus heterochaelis,
Dyspanopeus sayi, Gobiosoma bosc, Mercenaria mercenaria, Mytilid sp., Boonea impressa,
Polydora websteri, Sedentaria sp., Terebellid sp., Amphibalanus eburneus, Crepidula fornicata,
Discussion
Our results indicate that across wide-ranging salinity gradients and between intertidal and subtidal regimes, substantial differences exists in oyster densities, faunal richness, and
community composition. Oysters had much higher densities on intertidal than subtidal regimes. In the intertidal, intermediate salinities appear to offer the ideal conditions for high oyster densities, likely due to fewer predators and competitors capable of tolerating the environmental extremes of the intertidal zone. However, relatively high densities were found across salinities at intertidal reefs. Conversely, subtidal reef densities were highest when augmented by dislodged shell from adjacent intertidal areas, the example being at NR1S (eroded from NR1I). Over the polyhaline-euryhaline salinity gradient sampled in this study, only NP4S showed evidence of long-term subtidal oyster persistence. Oyster-reef community structure was most strongly affected by tidal elevation, secondarily by salinity regime, and temporal trends were
insignificant, such that in temperate, shallow systems, managers should primarily consider tidal emersion, salinity and their interaction when determining sites for oyster restoration.
In the NRE and NPRE basins, tidal emersion and then salinity were the most important variables in determining oyster density, richness, and community structure. Higher oyster densities on intertidal reefs (mean: 148.55 oysters/ 0.1m2) versus on subtidal reefs (mean: 27.99 oysters/ 0.1m2) is not unusual in the study region. Powers et al. (2009) observed a similar differences in oyster density between intertidal restored reefs in Back Sound, NC and subtidal restored reefs in the Neuse-Pamlico varied substantially between intertidal and subtidal reefs, regardless of salinity; intertidal reefs supported higher densities than those in the subtidal. The intertidal oyster densities in our study are similar to those reported in other NC intertidal oyster surveys in the literature (Grabowksi et al. 2005, Powers et al. 2009, Zeigler et al. 2017, Hanke et al. 2017).
An inherent goal in restoring oyster populations is to achieve high densities, or
abundances that successfully recruit future generations. Our results suggest that salinity and tidal emersion are both essential factors in determining oyster density patterns and that there is a strong interactive effect between tidal emersion and salinity. Between tidal emersion regimes, oyster densities showed differing patterns regarding positioning along the salinity gradient. Although intertidal mid salinity oyster densities were higher than those at low salinities, the low salinity intertidal reef (NP4I) in our survey displayed high densities relative to those in the subtidal NP4S nearby. High oyster densities on the high salinity subtidal reef at NR1S were likely skewed by subsidies from the adjacent intertidal reef. We could not determine with
be in a sufficiently low and variable salinity regime, such as that at NP4S, where oysters were entirely recruited from subtidal origin, to escape negative influences of marine adapted pests (Wells 1961, Fodrie et al. 2014). While densities were lower (25.07 oysters/m2 on average) at NP4S than on NP4I, these reefs show evidence of long-term persistence and provide a habitat function for species with tolerance for salinity variability, such as Xanthid crabs, Melitid and Corophiid amphipods, the oyster-commensal polychaete, Polydora websteri, and the Nereid worm, Alitta succinea.
Tidal emersion had an interactive effect with salinity regime on species richness, in that the strength of the salinity effectwas dependent upon whether a reef was intertidal or subtidal. In the intertidal, tidal emersion dampens the expected influence of salinity on species richness, which is that high salinity environments are less stressful to largely marine adapted oyster reef associated fauna, resulting in higher species richness and trophic complexity (Wells 1961, Odum 1988). Species adapted to the high stress of the intertidal may display resistance to multiple stressors, such that species assemblages in highly stressful environments resemble one another (Vinebrooke et al. 2004). This is potentially occurring on intertidal oyster reefs, where
adaptations of intertidal organisms enhance their ability to cope with intertidal stressors, such as desiccation and heat variability.
subtidal reefs, so there is little known about the individual and interactive effects of salinity and tidal emersion on oyster community In effect, the stress of intertidal environments is stronger than that of salinity in ordering oyster reef species assemblages,oyster density and species richness.
Surprisingly, temporal variation did not correlate with patterns in oyster community structure in the NRE and NPRE. We rank temperature as the third most important abiotic variable in regulating oyster reef community dynamics, due to the lack of temporal and community correlation as well as qualitative observations regarding a lack of temperature extremes in the study region. While temperature surely plays a role in the timing of individual species spawning events, including oysters, community level variation was not detectable in our analysis. Wells (1961) described temporally characteristic communities on NPRE oyster reefs for winter and summer months. Of the 11 winter and 19 summer “sub-community” species
documented in Wells study, only four species were detected in our modern study, each
considered very rare occurrences. Temporal variability may be more important on subtidal oyster reef communities, as the larger species pools are capable of expressing more variability. This is reflected in Wells account of seasonal community variability; the most common winter
inhabitant, Tubularia crocea, a subtidally occurring hydroid, provided secondary habitat and food for multiple amphipod species, a nudibranch species, and Mytilus edulis, the blue mussel. Such temporally defined communities likely exist on oyster reefs today and are certainly relevant to understanding oyster community variability, however, our analysis reveals it is likely more important to study within specific tidal emersion-salinity regime contexts.
through winter months, constricting oyster distributions to subtidal environments, temperatures in the NC study region are not low enough to cause this phenomenon. High summer
temperatures can enhance transmission of oyster pathogens Haplosporidium nelson (MSX) (Andrews 1966) and Dermocystidium marinum (Dermo) (Andrews and Hewatt 1957), but there was no evidence of oyster mortality from these diseases in our collections. In line with Walles et al. (2016), we maintain the notion that temperature extremes are unlikely to play a major role in broad scale oyster success in temperate regions, and that tidal emersion and salinity are the most critical abiotic variables for managers considering oyster restoration and conservation.
DO is likely a less significant variable affecting oyster reef ecology in our shallow well-mixed system, but this factor is potentially of great importance in deeper estuaries. For instance, in the Neuse River, where depths may reach 6m or more, subtidal reefs with crests deeper than 3m are likely to experience periods of hypoxia or anoxia during summer months when surface algal production and bottom water bacterial respiration are high (Lenihan and Peterson 1998). Even in these deeper systems where low oxygen bottom layers commonly occur, tidal emersion is a primary factor, as hypoxia is only an issue in the subtidal (Walles et al. 2016). Salinity may be considered less important than DO as a subtidal reef may be restored in the proper mesohaline salinity regime, but placed at depths where low DO causes significant mortality.
was supported by our salinity data; there was a ~4.5ppt difference in mean salinity and ~2ppt difference in standard deviation, NP4S fresher and more dynamic than NR5S despite being 2.7km closer Beaufort Inlet. These salinity differences were apparent in our collections of oysters and associated fauna. At NR5S and NP4S, the freshest subtidal sites (Table 1.1), live oysters and shell material contained the complex galleries characteristic of previous Cliona
infestation and at NR5S, dead shells from oyster drills, Urosalpinx cinerea and Eupleura caudata were regularly found.
Because we were interested in observations across contiguous salinity gradients, we were not able to control for reef size, height, shape, or complexity, as these factors are influenced by estuarine gradients in salinity and tidal exposure that informed site selection. However, we do recognize the importance of spatial factors and these reef characteristics. The size, height, and shape of oyster-reef structures can alter the physical flow regime of the local environment, which facilitates growth and settlement of future generations (Lenihan 1999). In addition, the structural complexity of a reef is of fundamental importance, affecting interspecific interaction strength (Grabowski 2004); higher complexity resulting in greater size distributions of individual species (Margiotta et al. 2016) and potentially higher species richness. Furthermore, in intertidal oyster habitats, reef elevation determines reef expansion rates; there exists an intertidal elevation where reef growth is optimal, likely by the general exclusion of dessication intolerance of oyster
al. 2015). Densities at these two reefs were lower than those at NP1I and NP2I, but were higher than NP4I, indicating densities were not significantly reduced by high elevation at the whole-reef scale. Elevation may have played a role at NP4I, in contributing to the high densities of
Geukensia demissa, whichwere often more abundant than the oysters themselves. This was particularly so at the crest of this reef (M. Tice-Lewis personal observation). In North Carolina, Hanke et al. (2017) determined major oyster-reef taxa displayed community responses to differing reef edge distances and species-specific responses to reef size. Brachidontes exustus, Geukensia demissa, Eurypanopeus depressus, and Panopeus herbstii were all more abundant at the farthest edge distance, and G. demissa were significantly more dense on reefs with widths of 5 meters.
The strong association between salinity and species richness on subtidal oyster-reefs is an important consideration for fisheries management and is consistent with the literature (Wells 1961, Tolley et al. 2005). As oysters provide refuge for a high diversity of soft bodied
invertebrates (Wells 1961, this study), they are highly suitable foraging grounds for juvenile and adult fish species, including those of recreational and commercial value (Lenihan et al. 2001). While the single euryhaline subtidal reef (NR1S) was the most diverse site by a wide margin, the relative area of high salinity subtidal reefs compared to intertidal reefs in the NRE and NPRE is small, but may play important ecological roles than suggested by spatial scale. Shallow subtidal reefs in high salinity areas may eventually succumb to predators and bioeroders, but in certain systems could be continuously or periodically replenished by intertidal subsidies. In a restoration context however, euhaline, subtidal reefs are are ill-advised ventures.
Theoretically, subtidal oyster reefs may have a higher potential to augment biological
communities than those in the intertidal, because relatively few marine species are adapted for tolerating the extreme environmental insult of an intertidal existence (as observed at NR1S). For instance, fish use of subtidal reefs is increased over that of intertidal reefs, because resident fish may remain on subtidal structures throughout the tidal cycle, whereas intertidal fish assemblages are largely transient in nature (Lehnert and Allen 2002). However, across salinity regimes, our results suggest that intertidal reef restoration yields more diverse community assemblages than those in low salinity subtidal environments, where subtidal reef restoration efforts are most likely to succeed. Although the most species rich assemblages in our study occurred in subtidal high and intermediate salinity areas, those reefs are largely transient efforts, as NC-DMF has largely ignored the qualitative and quantitative knowledge that salinity thresholds limit subtidal oyster distribution.
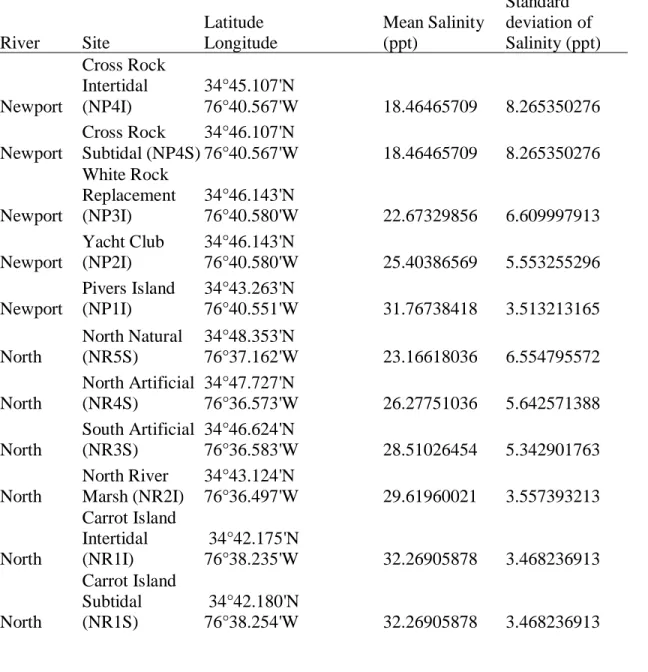
Table 1.1. Sampling locations in the Newport and North River estuaries. Mean and standard deviation of salinity, measured in parts per thousand, were calculated with continuously logged salinity (10-minute intervals) from September 2013-December 2015.
River Site
Latitude Longitude Mean Salinity (ppt) Standard deviation of Salinity (ppt) Newport Cross Rock Intertidal (NP4I) 34°45.107'N
76°40.567'W 18.46465709 8.265350276 Newport
Cross Rock Subtidal (NP4S)
34°46.107'N
76°40.567'W 18.46465709 8.265350276
Newport
White Rock Replacement (NP3I)
34°46.143'N
76°40.580'W 22.67329856 6.609997913 Newport
Yacht Club (NP2I)
34°46.143'N
76°40.580'W 25.40386569 5.553255296 Newport
Pivers Island (NP1I)
34°43.263'N
76°40.551'W 31.76738418 3.513213165 North
North Natural (NR5S)
34°48.353'N
76°37.162'W 23.16618036 6.554795572 North
North Artificial (NR4S)
34°47.727'N
76°36.573'W 26.27751036 5.642571388 North
South Artificial (NR3S)
34°46.624'N
76°36.583'W 28.51026454 5.342901763 North
North River Marsh (NR2I)
34°43.124'N
76°36.497'W 29.61960021 3.557393213
North
Carrot Island Intertidal (NR1I)
34°42.175'N
76°38.235'W 32.26905878 3.468236913
North
Carrot Island Subtidal (NR1S)
34°42.180'N
Continued on next page.
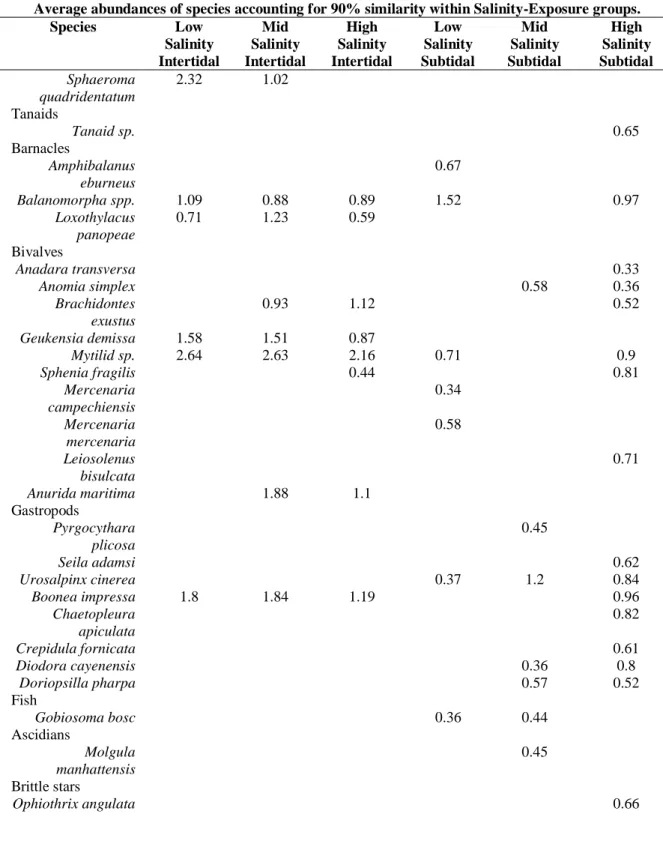
Table 1.2. SIMPER analysis results showing the major species and species groups responsible for community similarities within groups. Numbers denote the average density of each species.
Average abundances of species accounting for 90% similarity within Salinity-Exposure groups.
Species Low Salinity Intertidal Mid Salinity Intertidal High Salinity Intertidal Low Salinity Subtidal Mid Salinity Subtidal High Salinity Subtidal Cnidarians
Actiniaria sp. 0.31
Errant polychaetes
Alitta succinea 2.22 2 1.6 1.52 1.45 1.43
Nereis falsa 0.74
Nereiphylla fragilis 0.67
Oxydromus obscura 0.68
Harmothoe aculeata 0.47
Marphysa sanguinea 0.82 0.59 1.41 1.24
Lumbrineris sp. 0.78
Sedentary polychaetes
Amphitrite ornata 0.33
Terebellid sp. 0.74 0.72
Cirratulus grandis 0.78
Hydroides dianthus 3.16 1.29
Sabellaria sp. 1.1
Polydora websteri 1.78 1.48 0.53 1.05
Piromis eruca 0.53
Sedentaria sp. 0.79 0.6
Decapods
Alpheus heterochaelis 0.78 0.96
Eurypanopeus
depressus 1.5 2.04 1.58 0.45 1.17 0.59
Panopeus herbstii 1.03 1.49 1.43 0.9 1.32
Dyspanopeus sayi 0.72 0.64
Menippe mercenaria 0.41
Pinnixa
chaetopterana 0.41
Megalobrachium
soriatum 0.34
Amphipods
Amphipod spp. 1.34 0.66 0.81 1.08 1.66
Melita nitida 1.86 1.25
Rhepoxynius
epistomus 1.06
Corophiid spp. 1.55 1.48 0.76
Table 1.2 continued.
Average abundances of species accounting for 90% similarity within Salinity-Exposure groups. Species Low
Salinity Intertidal Mid Salinity Intertidal High Salinity Intertidal Low Salinity Subtidal Mid Salinity Subtidal High Salinity Subtidal Sphaeroma quadridentatum
2.32 1.02 Tanaids
Tanaid sp. 0.65
Barnacles
Amphibalanus eburneus
0.67
Balanomorpha spp. 1.09 0.88 0.89 1.52 0.97
Loxothylacus panopeae
0.71 1.23 0.59 Bivalves
Anadara transversa 0.33
Anomia simplex 0.58 0.36
Brachidontes exustus
0.93 1.12 0.52
Geukensia demissa 1.58 1.51 0.87
Mytilid sp. 2.64 2.63 2.16 0.71 0.9
Sphenia fragilis 0.44 0.81
Mercenaria campechiensis 0.34 Mercenaria mercenaria 0.58 Leiosolenus bisulcata 0.71
Anurida maritima 1.88 1.1
Gastropods
Pyrgocythara plicosa
0.45
Seila adamsi 0.62
Urosalpinx cinerea 0.37 1.2 0.84
Boonea impressa 1.8 1.84 1.19 0.96
Chaetopleura apiculata
0.82
Crepidula fornicata 0.61
Diodora cayenensis 0.36 0.8
Doriopsilla pharpa 0.57 0.52
Fish
Gobiosoma bosc 0.36 0.44
Ascidians
Molgula manhattensis
0.45 Brittle stars
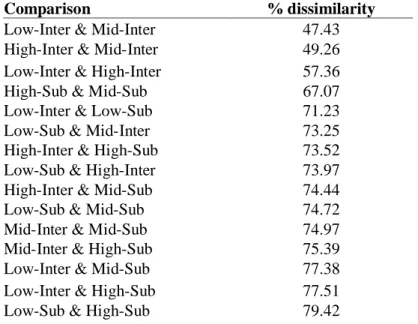
Table 1.3. SIMPER analysis results showing % dissimilarity between different salinity-tidal emersion treatment groups. Higher % dissimilarity indicates community structure is more different between a set of two oyster-reef environmental contexts (salinity-tidal emersion groups).
Comparison % dissimilarity
Low-Inter & Mid-Inter 47.43
High-Inter & Mid-Inter 49.26
Low-Inter & High-Inter 57.36
High-Sub & Mid-Sub 67.07
Low-Inter & Low-Sub 71.23
Low-Sub & Mid-Inter 73.25
High-Inter & High-Sub 73.52
Low-Sub & High-Inter 73.97
High-Inter & Mid-Sub 74.44
Low-Sub & Mid-Sub 74.72
Mid-Inter & Mid-Sub 74.97
Mid-Inter & High-Sub 75.39
Low-Inter & Mid-Sub 77.38
Low-Inter & High-Sub 77.51
Figure 1.1. Oyster-reef sampling locations in the Newport and North River Estuaries.
Beaufort Inlet Newport River
Figure 1.3. (a) Relationship between month pre-sample average temperature and average salinity in the Newport River (b) Relationship between month pre-sample average temperature and standard deviation of salinity in the Newport River (c) Relationship between month pre-sample average temperature and average salinity in the North River (d) Relationship between month pre-sample average temperature and standard deviation of salinity in the North River.
a
b
Figure 1.4. Mean oyster densities at intertidal (dark blue) and subtidal (light blue) oyster-reefs in high, mid, and low salinity regimes. Lowercase letters denote statistically different oyster
densities (pairwise Kruskall-Wallis, p>0.05).
0 50 100 150 200 250
high mid low
O
ys
te
rs
/
0.
1m
2
Salinity regime
Oyster Density
Intertidal
Subtidal
ab
d
b
d
a
Figure 1.5. Mean species richness (bars: +/- standard error) at intertidal (dark blue) and subtidal (light blue) oyster-reefs in high, mid, and low salinity regimes. Lowercase letters denote
statistically different oyster densities (pairwise Kruskal-Wallis Test, p>0.05).
0 5 10 15 20 25
high mid low
Figure 1.6. (a) Relationship between oyster abundance and species richness on intertidal oyster-reefs. (b) Relationship between oyster abundance and species richness on subtidal oyster-oyster-reefs.
Figure 1.7. Nonmetric multidimensional scaling plot (NMDS) of all samples. Blue-toned
triangles represent subtidal communities and red-toned triangles represent subtidal communities. Darker colors indicate high salinity sites, middle colors indicate mid salinity sites, and lighter colors indicate low salinity sites. Ellipses represent 95% confidence intervals for each factor group.
−1 0 1
−1 0 1
NMDS1 N M D S 2 tide.salbin I.low I.mid I.high S.low S.mid S.high −1 0 1
−1 0 1
Figure 1.8. (a) Relationship between pre-sample month averaged salinity and oyster density at intertidal sites. (b) Relationship between pre-sample month averaged salinity and oyster density at subtidal sites. (c) Relationship between pre-sample month averaged salinity and species richness at intertidal sites. (d) Relationship between salinity and species richness at subtidal sites.
a
b
REFERENCES
Andrews, J. D. (1966). Oyster mortality studies in Virginia V. Epizootiology of MSX, a protistan pathogen of oysters. Ecology, 47(1), 19-31.
Andrews, J. D., & Hewatt, W. G. (1957). Oyster mortality studies in Virginia. II. The fungus disease caused by Dermocystidium marinum in oysters of Chesapeake Bay. Ecological Monographs, 27(1), 1-25.
Baggett, L. P., Powers, S. P., Brumbaugh, R. D., Coen, L. D., DeAngelis, B. M., Greene, J. K., ... & Bushek, D. (2015). Guidelines for evaluating performance of oyster habitat restoration. Restoration Ecology, 23(6), 737-745.
Bahr, L. M., & Lanier, W. P. (1981). The ecology of intertidal oyster-reefs of the South Atlantic coast: a community profile(No. 81/15). US Fish and Wildlife Service.
Beck, M. W., Brumbaugh, R. D., Airoldi, L., Carranza, A., Coen, L. D., Crawford, C., ... & Lenihan, H. S. (2011). Oyster-reefs at risk and recommendations for conservation, restoration, and management. Bioscience, 61(2), 107-116.
Bruno, J. F., Stachowicz, J. J., & Bertness, M. D. (2003). Inclusion of facilitation into ecological theory. Trends in Ecology & Evolution, 18(3), 119-125.
Byers, J. E., Grabowski, J. H., Piehler, M. F., Hughes, A. R., Weiskel, H. W., Malek, J. C., & Kimbro, D. L. (2015). Geographic variation in intertidal oyster-reef properties and the influence of tidal prism. Limnology and Oceanography, 60(3), 1051-1063.
Chestnut, A. F., & Fahy, W. E. (1953). Studies on the vertical distribution of setting of oysters in North Carolina.
Clarke, K. R., & Warwick, R. M. (2001). Change in marine communities. An approach to statistical analysis and interpretation.
Coen, L. D., Brumbaugh, R. D., Bushek, D., Grizzle, R., Luckenbach, M. W., Posey, M. H., ... & Tolley, S. G. (2007). Ecosystem services related to oyster restoration. Marine Ecology Progress Series, 341, 303-307.
Connell, J. H. (1961). The influence of interspecific competition and other factors on the distribution of the barnacle Chthamalus stellatus. Ecology, 42(4), 710-723.
Dame, R. F. (1976). Energy flow in an intertidal oyster population. Estuarine and Coastal Marine Science, 4(3), 243-253.
Dayton, P. K. (1971). Competition, disturbance, and community organization: the provision and subsequent utilization of space in a rocky intertidal community. Ecological
Monographs, 41(4), 351-389.
Elmqvist, T., Folke, C., Nyström, M., Peterson, G., Bengtsson, J., Walker, B., & Norberg, J. (2003). Response diversity, ecosystem change, and resilience. Frontiers in Ecology and the Environment, 1(9), 488-494.
Fodrie, F. J., Rodriguez, A. B., Baillie, C. J., Brodeur, M. C., Coleman, S. E., Gittman, R. K., ... & Theuerkauf, E. J. (2014). Classic paradigms in a novel environment: inserting food web and productivity lessons from rocky shores and saltmarshes into biogenic reef restoration. Journal of applied ecology, 51(5), 1314-1325.
Fofonoff, N. P., & Millard Jr, R. C. (1983). Algorithms for the computation of fundamental properties of seawater.
Galtsoff, P. S. (1964). The American oyster Crassostrea virginica (Gmelin). US Fish Wildlf. Serv. Fish. Bull., 64, 1-480.
Grabowski, J. H., Hughes, A. R., Kimbro, D. L., & Dolan, M. A. (2005). How habitat setting influences restored oyster-reef communities. Ecology, 86(7), 1926-1935.
Grabowski, J. H., & Powers, S. P. (2004). Habitat complexity mitigates trophic transfer on oyster-reefs. Marine Ecology Progress Series, 277, 291-295.
Grabowski, J. H., & Peterson, C. H. (2007). Restoring oyster-reefs to recover ecosystem services. Ecosystem engineers: plants to protists, 4, 281-298.
Grabowski, J. H., Hughes, A. R., & Kimbro, D. L. (2008). Habitat complexity influences cascading effects of multiple predators. Ecology, 89(12), 3413-3422.
Grabowski, J. H., Brumbaugh, R. D., Conrad, R. F., Keeler, A. G., Opaluch, J. J., Peterson, C. H., Piehler, M. F., Powers, S. P. & Smyth, A. R. (2012). Economic valuation of
ecosystem services provided by oyster-reefs. BioScience, 62(10), 900-909.
Grave, C. (1901). The oyster-reefs of North Carolina: a geological and economic study. Place of publication not identified.
Grave, C., Moore, H. F., & Glaser, O. C. (1904). Investigations for the promotion of the oyster industry of North Carolina (Vol. 556). Govt. print. off..
Hanke, M. H., Posey, M. H., & Alphin, T. D. (2017). The effects of intertidal oyster-reef habitat characteristics on faunal utilization. Marine Ecology Progress Series, 581, 57-70.
Johnson, K. D., & Smee, D. L. (2014). Predators influence the tidal distribution of oysters (Crassostrea virginica). Marine biology, 161(7), 1557-1564.
Kimbro, D. L., White, J. W., Tillotson, H., Cox, N., Christopher, M., Stokes‐Cawley, O., ... & Stallings, C. D. (2017). Local and regional stressors interact to drive a salinization‐ induced outbreak of predators on oyster-reefs. Ecosphere, 8(11).
Kirby-Smith, W. W., & Costlow, J. D. (1989). The Newport River estuarine system. UNC Sea Grant College Program.
La Peyre, M. K., Gossman, B., & La Peyre, J. F. (2009). Defining optimal freshwater flow for oyster production: effects of freshet rate and magnitude of change and duration on eastern oysters and Perkinsus marinus infection. Estuaries and Coasts, 32(3), 522-534.
Lehnert, R. L., & Allen, D. M. (2002). Nekton use of subtidal oyster shell habitat in a southeastern US estuary. Estuaries, 25(5), 1015-1024.
Lenihan, H. S., & Peterson, C. H. (1998). How habitat degradation through fishery disturbance enhances impacts of hypoxia on oyster reefs. Ecological applications, 8(1), 128-140. Lenihan, H. S. (1999). Physical–biological coupling on oyster-reefs: how habitat structure
influences individual performance. Ecological Monographs, 69(3), 251-275. Lenihan, H. S., Peterson, C. H., Byers, J. E., Grabowski, J. H., Thayer, G. W., & Colby, D.
R.(2001). Cascading of habitat degradation: oyster-reefs invaded by refugee fishes escaping stress. Ecological Applications, 11(3), 764-782.
Mackin, J. G. (1946). A study of oyster strike on the seaside of Virginia. Commonweath of Virginia, Division of Purchase and Printing.
Margiotta, A. M., Shervette, V. R., Hadley, N. H., Plante, C. J., & Wilber, D. H. (2016). Species-specific responses of resident crabs to vertical habitat complexity on intertidal oyster-reefs. Journal of Experimental Marine Biology and Ecology, 477, 7-13.
McDougall, K. D. (1943). Sessile Marine Invertebrates of Beaufort, North Carolina: A Study of Settlement, Growth, and Seasonal Fluctuations among Pile‐Dwelling
Organisms. Ecological Monographs, 13(3), 321-374.
Menge, B. A., & Sutherland, J. P. (1976). Species diversity gradients: synthesis of the roles of predation, competition, and temporal heterogeneity. The American Naturalist, 110(973), 351-369.
Newell, R. I. (1988). Ecological changes in Chesapeake Bay: are they the result of
overharvesting the American oyster, Crassostrea virginica. Understanding the estuary: advances in Chesapeake Bay research, 129, 536-546.
Newell, R. I., Fisher, T. R., Holyoke, R. R., & Cornwell, J. C. (2005). Influence of eastern oysters on nitrogen and phosphorus regeneration in Chesapeake Bay, USA. In The
comparative roles of suspension-feeders in ecosystems (pp. 93-120). Springer, Dordrecht. O'Connor, N. E., Grabowski, J. H., Ladwig, L. M., & Bruno, J. F. (2008). Simulated predator
extinctions: predator identity affects survival and recruitment of oysters. Ecology, 89(2), 428-438.
Odum, W. E. (1988). Comparative ecology of tidal freshwater and salt marshes. Annual Review of Ecology and Systematics, 19(1), 147-176.
Paine, R. T. (1966). Food web complexity and species diversity. The American Naturalist, 100(910), 65-75.
Pennings, S. C., & Bertness, M. D. (2001). Salt marsh communities. Marine community ecology, 289-316.
Powers, S. P., Peterson, C. H., Grabowski, J. H., & Lenihan, H. S. (2009). Success of constructed oyster-reefs in no-harvest sanctuaries: implications for restoration. Marine Ecology Progress Series, 389, 159-170.
Pritchard, D. W. (1952). Estuarine hydrography. In Advances in geophysics (Vol. 1, pp. 243-280). Elsevier.
Ridge, J. T., Rodriguez, A. B., Fodrie, F. J., Lindquist, N. L., Brodeur, M. C., Coleman, S. E., ... & Theuerkauf, E. J. (2015). Maximizing oyster-reef growth supports green infrastructure with accelerating sea-level rise. Scientific reports, 5, 14785.
Rodney, W. S., & Paynter, K. T. (2006). Comparisons of macrofaunal assemblages on restored and non-restored oyster-reefs in mesohaline regions of Chesapeake Bay in
Maryland. Journal of Experimental Marine Biology and Ecology, 335(1), 39-51. Stachowicz, J. J., Bruno, J. F., & Duffy, J. E. (2007). Understanding the effects of marine
biodiversity on communities and ecosystems. Annu. Rev. Ecol. Evol. Syst., 38, 739-766. Tolley, S. G., Volety, A. K., & Savarese, M. (2005). Influence of salinity on the habitat use of
oyster-reefs in three southwest Florida estuaries. Journal of Shellfish Research, 24(1), 127-137.
Tolley, S. G., & Volety, A. K. (2005). The role of oysters in habitat use of oyster-reefs by
Tolley, S. G., Volety, A. K., Savarese, M., Walls, L. D., Linardich, C., & Everham Iii, E. M. (2006). Impacts of salinity and freshwater inflow on oyster-reef communities in Southwest Florida. Aquatic Living Resources, 19(4), 371-387.
Vinebrooke, R., L Cottingham, K., Norberg, M. S., I Dodson, S., C Maberly, S., & Sommer, U. (2004). Impacts of multiple stressors on biodiversity and ecosystem functioning: The role of species co‐tolerance. Oikos, 104(3), 451-457.
Walles, B., Fodrie, F. J., Nieuwhof, S., Jewell, O. J., Herman, P. M., & Ysebaert, T. (2016). Guidelines for evaluating performance of oyster habitat restoration should include tidal emersion: reply to Baggett et al. Restoration ecology, 24(1), 4-7.
Wells, H. W. (1959). Boring sponges (Clionidae) of Newport River, North Carolina. Journal of the Elisha Mitchell Scientific Society, 75(2), 168-173.
Wells, H. W. (1961). The fauna of oyster beds, with special reference to the salinity factor. Ecological Monographs, 31(3), 239-266.
Winslow, F. (1886). Report on the waters of North Carolina, with reference to their possibilities for oyster culture; together with the results of the surveys directed by the reolution of the general assembly, ratified March 11, 1885. Raleigh: North Carolina State Printer and Binder.
Worm, B., Barbier, E. B., Beaumont, N., Duffy, J. E., Folke, C., Halpern, B. S., ... & Sala, E. (2006). Impacts of biodiversity loss on ocean ecosystem services. science, 314(5800), 787-790.
Ysebaert, T., & Herman, P. M. (2002). Spatial and temporal variation in benthic macrofauna and relationships with environmental variables in an estuarine, intertidal soft-sediment
environment. Marine Ecology Progress Series, 244, 105-124.
Ziegler, S. L., Grabowski, J. H., Baillie, C. J., & Fodrie, F. J. (2017). Effects of landscape setting on oyster-reef structure and function largely persist more than a decade post‐
CHAPTER 2: MULTIDECADAL CHANGES TO ESTUARINE GRADIENTS AND OYSTER-REEF COMMUNITIES:
A COASTAL SQUEEZE FOR OYSTERS?
Introduction
The ecological responses to natural or anthropogenic environmental shifts are heavily dependent on the spatiotemporal scale of variability. Understanding how faunal communities respond to multiple scales of environmental variability is crucial to identify natural and anthropogenic-driven shifts in those communities, such that habitat conservation efforts are focused at appropriate spatial scales and siting tools that allow for long-term habitat persistence and function. Due to increased anthropogenic CO2 inputs in the 20th and 21st centuries,
researchers and environmental stewards are desperately trying to understand the potential for, and consequences of, ecological change under future climatic scenarios. Space-for-time approaches have commonly used relatively short-scale climatic perturbations, such as El Niño Southern Oscillation (ENSO) indices, or leveraging artificial temperature gradients to examine ecological community response to future thermal scenarios under climate change (Sagarin et al. 1999). For instance, ENSO cause ecological communities to shift drastically due to associated physical transport and thermal stress (Dayton and Tegner 1984, Chavez et al. 2003). However, these ”pulsed” changes may not reflect the gradual shift in abiotic factors under “press”
assessments of change in the studied parameter(s) over time and its potential ecological impacts. This situation decreases the potential for speculative conclusions that ignore the potential for environmental complexity to impact communities over long time scales (Sagarin et al. 1999). Relevant temporal scales of environmental change attributable to climate change are often multi-decadal, such as with relative sea level rise (RSLR), the combined effect of global SLR and regional subsidence or uplift (Church and White 2005). When possible, taking advantage of historical datasets offers an effective way of assessing the potential for future ecological change by leveraging knowledge of what has already changed over multi-decadal timescales.
redundant, additive or synergistic in their influence(s) on coastal communities already subject to the inherently stressful existence in a dynamic estuarine system.
Estuarine biogenic habitats such as saltmarshes, seagrasses, and oyster reefs harbor diverse faunal assemblages and are at particular risk for climate change and other anthropogenic impacts, because they often occur along relatively narrow environmental interfaces, such as in the intertidal zone, and across chemical gradients such as salinity. For salt marshes, the
combination of RSLR and upland development can result in what has been termed “coastal squeeze”, or the constriction of available intertidal space for salt-tolerant plants. Erosive wave energy, increased tidal magnitude, and altered sediment dynamics force transgressive movement of foundation species to maintain proper positioning within the intertidal. Eventually,
transgression is hindered by artificial coastal defenses or high relief, squeezing the width of suitable intertidal habitat (Doody 2013, Pontee 2013). Crassostrea virginica oyster reefs commonly fringe seaward salt marsh margins (Bahr and Lanier 1981) in estuarine systems, and are thereby subjected to similar physical forces imposed by RSLR but are considerably less studied in relation to coastal squeeze than saltmarshes. Oyster reefs are more resistant to erosive forces imposed by RSLR than marshes (Ridge et al. 2017a), and while marshes can adjust their position vertically via passive sediment trapping, augmenting below ground biomass, and
increasing above ground production (Morris et al. 2002), oysters accrete via individual vertically oriented growth (Chestnut and Fahy 1953, Bishop and Peterson 2006). Intertidal oysters respond rapidly to fluctuations in sea level (month to year timescales) via accretion or erosion across reef crests and (Ridge et al. 2017b), and over longer timescales can vertically accrete at rates
In temperate and subtropical estuaries, such as in North Carolina, oysters may occupy both intertidal and subtidal zones within estuaries, their distributions strongly regulated by salinity regime and aerial exposure (Baggett et al. 2015, Walles et al. 2016). Intertidal oyster reefs may be distributed throughout suitable salinity ranges (10-35ppt), subtidal oysters are constrained to areas with mesohaline salinity regimes because freshwater inputs to these regions act to exclude abundant marine-adapted predators and competitors (i.e. pests) of oysters (Fodrie et al. 2014, Powers et al. 2009 Walles et al. 2016). Further, the habitat function of oyster reefs is influenced by salinity, as community composition on oyster reefs varies with salinity regime and seasonal variability in freshwater outflow (Wells 1961, Tolley et al. 2006). Because RSLR and channel dredging impact tidal magnitudes, and thus the volume of saltwater entering estuaries on flood tides, there will be salinity increases occurring along coastlines that will impact oyster-reef distributions, as well as the associated communities.
by Wells (1961), who found over 300 species across the polyhaline-euhaline salinity gradient, and a positive association between salinity and faunal diversity. It is unknown how saltwater intrusion will impact the oyster reef community diversity gradients found by Wells, but long term changes in sea level may impact estuarine salinity dynamics at a given location, thus having the potential to impact the distribution biogenic structures and their associated communities.
Materials and Methods
Study Area
The NPRE, is a shallow (1m mean low water depth), tidally influenced (2m range) temperate estuary. From it headwaters (freshwater source), it flows in an eastward direction for approximately 8.5 km, or half of its length, before curving southward toward Beaufort Inlet which serves as its ocean connection (Kirby-Smith and Costlow 1989). The river-dominated portion of the NPRE, termed the “narrows”, is composed of a 20m wide channel of 2-4m depth with dense marsh growth on either bank. East of the “narrows”, the estuary widens where the tide dominates riverine outflow (Kirby-Smith and Costlow 1989). This upper portion of the estuary has historically supported natural and planted subtidal and natural intertidal oyster populations (Winslow 1889, Grave 1901, Grave 1904, Wells 1961).
To assess changes in the Newport River estuary since Wells (1961), sampling locations were selected that optimally replicated Wells’ original sites. Wells sampled oyster associated communities at five sites in the NPRE spanning the polyhaline-euhaline salinity gradient, to better understand oyster community assemblage distributions respective to salinity. In the lower, euhaline portion of the estuary, Wells (1961) sampled two sites: Shark Shoal and Pivers Island ; and in the upper, polyhaline portion of the estuary, he sampled three sites: Gallants Point, White Rock, and Cross Rock (Figure 2.1).
Salinity data collection
More than 100 years of marine research conducted in the Beaufort area by the United States Fisheries Commission, Duke University Marine Lab, the University of North Carolina at Chapel Hill’s Institute of Marine Sciences (UNC IMS), and North Carolina Division of Marine Fisheries (NC-DMF) has resulted in a long-term library of environmental data for the NPRE. To investigate multi-decadal salinity trends, I gathered historical salinity data from these sources to establish a salinity time series that covered 102 years between 1913 and 2015. At PI, Hoyt (1920) measured PI salinity daily from 1913-1914, and reported monthly maximum, minimum, and mean values. Gutsell (1930) measured PI salinity daily from 1924-1928, and also provided monthly maximum and minimum values. Wells (1961) sampled salinity monthly from January 1955 to October 1956 at nine sites over the NPRE polyhaline-euhaline salinity gradient. Wells point sampled salinity from PI, WR, Turtle Rock (located directly north of this study’s 2013-2015 WRR site), and CR, which were utilized in this analysis. PI, WR, WRR and CR site-proximal salinity data from 1965-2015 were acquired from the NC-DMF Shellfish Sanitation program (NC-DMFSS). NC-DMFSS routinely measures point salinities at 0.6 m depth at set sites along the Newport River to regulate shellfish harvesting in the context of water quality related to human health. The earliest salinity records from DMFSS were from 1965, and their sampling operations have continued to the present-day with some modifications to routine sampling sites. Because no single DMFSS site for a given study area was located directly
measurements were aggregated from DMFSS sites within 500 m of 34°43'14.66"N. For the WR-WRR area (WR area hereafter), DMFSS salinity measurements within 500 meters of the
respective site were considered (for WR, 76°43'28.97"W and WRR, 76°44'0.68"W). At CR, salinity measurements taken at DMFSS site 500 m from 76°45'0.62"W.
Oyster community collection
To sample oyster associated communities, Wells utilized a simple sampling
methodology. At each site except White Rock, 1-gallon buckets were filled with intertidal and shallow subtidal oyster clusters and associates at low tide. He identified all fauna to the lowest taxonomic level possible. At White Rock, oyster communities were sampled using a scallop dredge at high tide. Wells did not explain why this was done in lieu of the 1-gallon bucket sampling procedure. Wells sampled PI, WR, and CR 14, 6 and 15 times, respectively, between 1955 and 1956. All seasons are represented in Wells’ PI and CR samplings. He only sampled White Rock from July-September each year of the 2-year sampling period (Table 2.2).
My sampling of oyster-reef associated fauna began in July 2013 and was repeated monthly at each site until April 2014, at which time, sampling was done bimonthly and until December 2015. WRR was not sampled in October, 2015 due to exceedingly high water caused by Hurricane Matthew (Table 2.2). Two additional sampling trips (on top of the regular
Statistical analyses:
Multi-decadal (century to half-century) time series of salinity metrics in the NPRE were analyzed to evaluate long-term NPRE salinity trends. Yearly minimum, maximum, and mean (when possible) salinities were calculated from the raw salinity data for each site area (CR, WR-WRR, and PI). For PI, least-squares regressions were conducted for yearly minimum and maximum salinities for the time periods 1913-2015 and 1955-2015, while mean salinity regression was only possible for 1955-2015. WR and WRR salinities were pooled to provide spatial consistency between environmental and community analyses. For both WR-WRR and CR, least squares regression analyses were conducted for yearly minimum, maximum, and mean salinities from 1955-2015. For each site, we aimed to utilize as much salinity data as were available for establishing time series trends.
A series of univariate and multivariate statistical analyses were employed to examine multi-decadal salinity changes and alterations to oyster community structure at different spatial scales. We analyzed oyster community datasets from 1955-1956 and 2013-2015 using
community differences between the two studies, species were grouped into their respective families for analyses in both Wells and my datasets.
Nonmetric multidimensional scaling (NMDS) was used to visualize and identify natural groupings in the oyster community data from Wells (1961) and 2013-2015, as well as assess the role of salinity in driving community composition. Samples were coded by study (Wells or 2013-2015) and site within each study (PI, WR, CR) to explore oyster community patterns across an estuarine salinity gradient and over 60 years between sampling efforts. Environmental and temporal variables of salinity, Julian day, and year were fitted to the data using envfit in the R ‘vegan’ package, to determine how these variables possibly correlated with observed community groupings within the NMDS space. The salinity value corresponding to a particular sample were calculated as the site-specific mean salinity during the season and year of sampling. Envfit analysis indicates the statistical significance of environmental vector correlations with
community data. Only significant environmental variables, expressed as vectors, were included in the final ordination.
To determine if NPRE communities varied between studies and sites, a crossed
permutational MANOVA (PERMANOVA) was conducted, with study, site, and study*site as fixed factors. A pairwise PERMANOVA post-hoc procedure was used to determine significant differences in group means between pairs of study-site groupings. P-values were Bonferroni corrected for multiple comparisons. To determine which taxonomic groups (families) were driving differences between study groups and within-study site differences, similarity
(PERMDISP) was conducted on all samples, using study as the independent factor (Anderson 2006). PERMDISP pairwise tests with Bonferroni correction were conducted for all study-site groups to determine within site community variability over space and time. PERMDISP tests served an additional purpose to indicate whether PERMANOVA tests met the assumptions of homogeneity of multivariate dispersions.
To quantify variability (site-site beta-diversity) changes in oyster communities between paired sampling locations at different locations along the salinity gradient, as well as over the 60 year gap between studies, I calculated Jaccard dissimilarity scores (1-Jaccard index). Jaccard scores were generated for each site comparison for Wells (1961) and the 2013-2015 family-level presence/absence data using the ‘vegan’ package in R (Dixon 2003). To determine the
significance of observed differences in site-to-site community variability, nonparametric paired Kruskall-Wallis tests were performed for each site pair (CR-WR, WR-PI, CR-PI) between studies. This nonparametric approach was chosen as variances were heteroscedastic between site-pair groups.