TRANSACTIONS ON ENVIRONMENT AND ELECTRICAL ENGINEERING ISSN 2450-5730 Vol 2, No 2 (2017) ©Calebe A. Matias, Girodani Pacífico Medeiros, Pedro H. F. Moraes, Bruno de A. Fernandes, Aylton J. Alves, Wesley P. Calixto, Geovanne P. Furriel Abstract— the purpose of the present study is to
simulate and analyze an isolated full-bridge DC/DC boost converter, for photovoltaic panels, running a modified perturb and observe maximum power point tracking method. The zero voltage switching technique was used in order to minimize the losses of the converter for a wide range of solar operation. The efficiency of the power transfer is higher than 90% for large solar operating points. The panel enhancement due to the maximum power point tracking algorithm is 5.06%.
Index Terms—energy efficiency, geometric Brownian motion, Monte Carlo simulation, performance measurement and verification, solar water heating.
I. INTRODUCTION
HE concern to produce clean energy is relevant in view of the global warming and pollution. The search for new technologies to improve power conversion of renewable energy sources is the focus of studies and discussions in many academics centers and industries across the globe [1].
Photovoltaic (PV) panels are made of photosensitive semi- conductors. Their semiconductor cells are hit by solar radiation and produce a difference of potential. The problem is that panels cannot deliver the maximum power by their own considering the impedance matching principle. That is the main reason for using a power
converter running a maximum power point tracking (MPPT) algorithm [2].
DC/DC converters are used to change the impedance seen by any source, due to control of the trigger circuit of these switches [3]. A DC/DC converter is needed when speaking at tracking the maximum power of an energy source, as a photovoltaic panel [4].
The analysis of the behavior and power transfer ratios of a converter can determine its efficacy on deliver the maximum power to the load. A computer simulation provides lots of information about these characteristics. This can be used to help the development of a real converter [5].
This paper aims to analyze the power transfer ratios and the modified perturb and observe (P&O) MPPT performance of an isolated full-bridge DC/DC boost converter considering the power loss on its components in order to verify the feasibility of the development of a real device [6], [7].
In order to minimize the losses on the switches of the converter the zero voltage switching technique was applied to trigger the MOSFETs.
To perform the analysis of the results and approach of the electrical model of a photovoltaic panel was made for generating its characteristic curve. Later, there were made an analysis of the operation of the DC-DC converter and observations on the MPPT technique.
Simulation and analysis of an isolated
full-bridge DC/DC boost converter operating with a
modified perturb and observe maximum power
point tracking algorithm
T
Wesley P. Calixto Geovanne P. Furriel
School of Electrical, Mechanical and Computer Engineering
Federal University of Goiás (UFG), Goiânia, Brazil
Email: [email protected] Calebe A. Matias
Giordani Pacífico Medeiros Pedro H. F. Moraes Bruno de A. Fernandes
Aylton J. Alves
Experimental and Technological Research and Study Group (NExT)
Federal Institute of Goias (IFG), Goiânia, Brazil
II. METHODOLOGY
A simulation was performed aiming to analyze the power transfer ratio for a wide range of solar operation and the MPPT method.
A. Materials
The selected PV panel was KC200GT from KYOCERA, with 54 cells. Its main electrical performance under standard test conditions (irradiance 1000W/m2, AM 1.5 spectrum and module temperature at
25oC) data are shown in Table I. The simulation was
performed with SPICE software (Simulation Program with Integrated Circuits Emphasis).
B. Electrical model of a photovoltaic panel
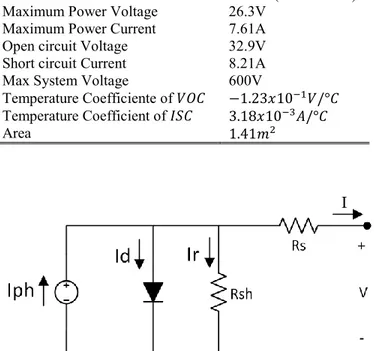
There are several electrical models that describe the behavior of a photovoltaic panel, among them stands out the model with one diode, one series resistance and one resistor in parallel [8], [9], as shown in Fig. 1.
Applying Kirchhoff’s law on the circuit, the equation of the load current is obtained as in (1).
𝐼 = 𝐼𝑝ℎ− 𝐼𝑑− 𝐼𝑟 (1)
Where 𝐼𝑝ℎ is the current generated by the photovoltaic
effect, 𝐼𝑑 is the current in the diode and 𝐼𝑟 is the current
in 𝑅𝑠ℎ.
The 𝐼𝑝ℎ current is dependent on the solar radiation and
temperature as (2).
𝐼𝑝ℎ = [𝐼𝑝ℎ,𝑠𝑡𝑐+ 𝐾𝑖(𝑇 − 𝑇𝑠𝑡𝑐)]
𝐺
𝐺𝑠𝑡𝑐 (2) Where 𝐼𝑝ℎ,𝑐 is the current generated by the
photovoltaic effect under standard conditions, 𝐾𝑖 is the
temperature coefficient of the short circuit current, 𝑇𝑠𝑡𝑐 is
the temperature at standard conditions (25∘C), G𝑠𝑡𝑐 is the
radiation at standard conditions (1000𝑊/𝑚2).
The current in the diode (𝐼𝑑) has a non-linear
characteristic and is dependent on such factors as the saturation current (𝐼0), the Boltzmann constant (𝑘), the
electron charge (𝑞), the ideality factor (𝑎1) and the
number of cells in series (𝑛𝑠) as (3).
𝐼𝐷= 𝐼0{𝑒𝑥𝑝 [𝑞 × (𝑉 + 𝐼 × 𝑅𝑠)
𝑛𝑠× 𝑘 × 𝑇 × 𝑎1] − 1} (3) The calculation of the saturation current considers the temperature coefficient of open circuit voltage (𝐾𝑣),
temperature coefficient of short circuit current (𝐾𝑖), the
short circuit current 𝐼𝑠𝑐 under standard conditions
(𝐼𝑆,𝑠𝑡𝑐) and the open circuit voltage under standard
conditions (𝑉𝑂𝐶,𝑠𝑡𝑐) as (4).
𝐼0= 𝐼𝑆,𝑠𝑡𝑐+ 𝑘𝑖(𝑇 − 𝑇𝑠𝑡𝑐)
𝑒𝑥𝑝 [𝑞 (𝑉𝑂𝐶,𝑠𝑡𝑐(𝑛 + 𝑘𝑣(𝑇 − 𝑇𝑠𝑡𝑐))
𝑠× 𝐾 × 𝑇) ] − 1
(4)
The current through the resistor in parallel is as (5). 𝐼𝑅=
𝑉 + 𝐼 × 𝑅𝑠
𝑅𝑠ℎ (5)
There are two other important parameters needed to be calculated: the value of 𝑅𝑠ℎ and 𝑅𝑠. These values lead the
calculated maximum power point match the experimental maximum power point (𝑉𝑚𝑝 × 𝐼𝑚𝑝). An
iteration algorithm, under PyLab environment, that increases the value of 𝑅𝑠 to estimate the 𝐼𝑝ℎ,𝑐, 𝐼𝑝ℎ and 𝑅𝑠ℎ
values as (2), (6) and (7). 𝐼𝑝ℎ,𝑠𝑡𝑐=
𝑅𝑠ℎ+ 𝑅𝑠
𝑅𝑠ℎ 𝐼𝑠𝑐,𝑠𝑡𝑐 (6)
𝑅𝑠ℎ = 𝑉𝑚𝑝(𝑉𝑚𝑝 + 𝐼𝑚𝑝 × 𝑅𝑠)
[𝑉𝑚𝑝+ 𝐼𝑝ℎ− 𝐼𝑑− 𝑃𝑚𝑎𝑥,𝐸] (7)
TABLEI
ELECTRICAL PERFORMANCE UNDER STANDARD
TEST CONDITIONS
Maximum Power 200W (+10% / -5%)
Maximum Power Voltage 26.3V Maximum Power Current 7.61A Open circuit Voltage 32.9V Short circuit Current 8.21A
Max System Voltage 600V
Temperature Coefficiente of 𝑉𝑂𝐶 −1.23𝑥10−1𝑉/°𝐶
Temperature Coefficient of 𝐼𝑆𝐶 3.18𝑥10−3𝐴/°𝐶
Area 1.41𝑚2
The characteristic curve of the photovoltaic panel was obtained using a computational algorithm. The following values of parallel (𝑅𝑠ℎ) and series (𝑅𝑠) resistances used
on simulation were:
𝑅𝑠ℎ = 158.66Ω
𝑅𝑠= 0.0053Ω
C. Modified perturb and observe MPPT method
This method was proposed by [7]. The classical P&O MPPT algorithm considers that the PV power variation is caused by only the PV voltage perturbation. In fact the PV power is influenced by both the converter and the environ- mental conditions, such as irradiance and temperature.
During rapidly irradiance changing period, on conventional P&O method, there is a wrong control signal due to simple observation of the PV power and voltage reference. Fig. 2 represents the PV power curve at irradiance 𝐼1 and irradiance 𝐼2. Considering that the
conventional P&O algorithm is running from point A to point B, trying to reach point D, at irradiance 𝐼1, so the
control signal must increase the voltage from 𝑉1 to a
short period of time (Δ𝑡) and soon back to irradiance 𝐼1,
the converter might read the power at point C and the next control signal must decrease power, for with the increasing voltage and the power reduction the algorithm will try to reach the maximum power point running the opposite way of the real condition, point D. So the conventional perturb and observe method fails to track the maximum power point [7].
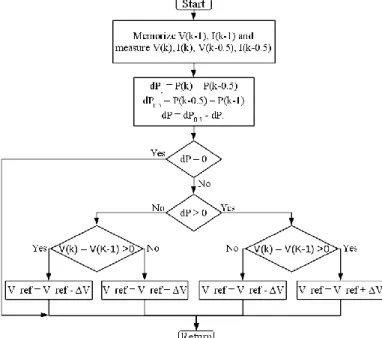
To fix this issue a modified P&O MPPT algorithm is needed. This method consists in distinguish the power variation caused by the MPPT control and the irradiance. This can be done by adding a PV power measurement between of control period. The diagram in Fig. 3 illustrates the process. Where 𝑑𝑃0.5, shown in (8), is the
power difference between the middle-point (𝑑𝑃𝑘−0.5) and
the starting point (𝑑𝑃𝑘−1), which contains the power of
both solar radiation and MPPT control; 𝑑𝑃1, shown in
(9), contains the power caused by only the irradiance variation and 𝑑𝑃 , shown in (10), is the power caused by only the MPPT control [10] [7].
𝑑𝑃0.5= 𝑃(𝑘 − 0.5) − 𝑃(𝑘 − 1) (8) 𝑑𝑃1= 𝑃(𝑘) − 𝑃(𝑘 − 0.5) (9)
𝑑𝑃 = 𝑑𝑃0.5− 𝑑𝑃1 (10)
So the algorithm uses the power variation caused by only the MPPT control signal to track the maximum power point. This fixes the problem of the conventional P&O method.
III. SIMULATION AND RESULTS
Using SPICE software a simulation was performed to determine the voltage and current values of each component.
Fig. 2: Control signal analysis of the conventional P&O.
The schematic in Fig. 4 represents the circuit used in the simulation. An algorithm running the mathematic model of the solar panel provides the voltage 𝑉𝑃𝑉 to
DC-DC converter.
A. Operating mode of full-bridge DC/DC boost converter
The isolated full-bridge DC/DC converter, depicted in Fig. 5, working as a step-up or boost converter. 𝑉𝑃𝑉 is
the operating voltage of the photovoltaic panel, which can be varied until the open circuit voltage limit (𝑉𝑜𝑐).
The use of 𝐶𝑃𝑉 decoupling capacitor is recommended to
prevent the effects of high frequency current ripple generated by the converter, in the photovoltaic panel.
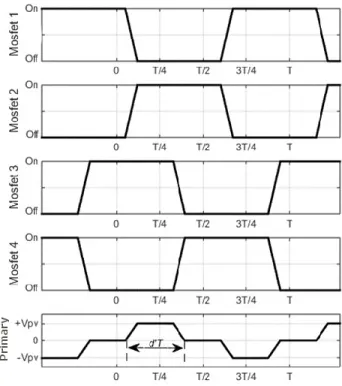
The MOSFETs are used to generate an alternating waveform in the primary of the transformer with a duty
cycle frequency equals 110 kHz. Fig. 6 shows the actuation cycle of the MOSFETs and the waveform generated in the primary of the transformer (V1). A charge/discharge time on the MOSFETs generate losses for there is voltage and current over them at the same time. To minimize these losses a Zero Voltage Switching (ZVS) technique is used. Therefore a time period in which the voltage at the primary of the transformer (V1) remains zero due to the use of this technique, so the switching time of the MOSFETs are different, depicted in Fig. 6.
The transformer amplifies the voltage at a ratio of 𝑛. The next stage is rectifying this voltage and then filters the current e voltage ripple through the inductor L and
the capacitor C_Link.
The DC link voltage is:
𝑉𝑙𝑖𝑛𝑘 = 𝑛 × 𝑉𝑃𝑉× 2𝑑′ (11) The duty cycle of the MOSFETs switching is equal D, where D = 2.d’. The voltage blanking time (voltage equals zero) in the primary of the transformer (V1) is changed by the duty cycle of effective work d’ = D/2, as depicted in Fig 6.
The simulation was performed under standard conditions, so the commercial electronic components are specified for its limits values. A load resistance was attached at the DC-DC converter, so measurements can be made. The voltage and current values were observed on each component; therefore the list of commercial components is determined, seen in Table II.
The performance analysis of the DC/DC converter is performed using the specification of the components of the Table II. A 1:18 transformer ratio was used to elevate the voltage to the desired level.
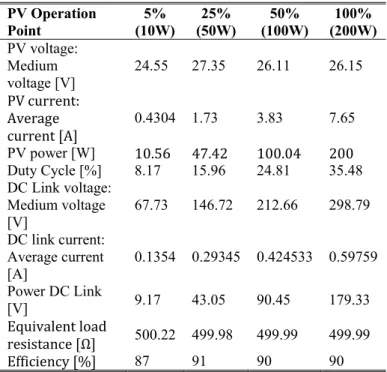
After running a new simulation, varying the solar radiation, the values on the Table III was obtained. This information shows that the converter works properly under wide range of solar operation points and it keeps the efficiency higher than 90% for operation points above 5%. When the solar panel is operating under low solar radiation the converter loses the efficiency and the MPPT algorithm does not work effectively.
Fig. 4: Schematic of the circuit used in simulation.
Fig. 5: DC-DC Isolated Full Bridge Power Converter Circuit.
Fig. 7 represents the output power of the panel due to suddenly irradiance variation. When the irradiance gets from 1000𝑊𝑚2 to 800𝑊/𝑚2 the output power decreases.
The implemented modified P&O MPPT has a batter dynamic response than the classic.
B. Modified P&O MPPT analysis
The modified P&O MPPT method was proposed to correct the MPPT control signal during rapidly solar radiation changing. During steady state both methods work properly, but when the irradiance changes suddenly the recovery time on the modified algorithm is faster than the classic.
The efficiency of the panel, 𝜂, can be evaluated as:
η = ∫ 𝑝(𝑡)𝑑𝑡
𝑇 0
𝐴𝑐∫ 𝐺(𝑡)𝑑𝑡0𝑇 (12) where 𝑝(𝑡) is the power output of the panel, G(𝑡) is the solar radiation and 𝐴𝑐 is the area of the panel.
A comparison between the panel efficiency under the conditions depicted in Fig. 7 using both algorithms gives that the conventional and the modified P&O efficiency is respectively 12.24% and 12,86%. So the enhancement on panel efficiency, using the modified P&O method, was 5.06%, compared to classical method.
The efficiency of the panel considers the integration on time interval [0, 𝑇], which means as more irradiance variation over the panel, during the time, higher is its efficiency gain, for the time recovering of the power is lower than conventional P&O.
IV. CONCLUSION
The performed simulations with the commercial specified components shows that the isolated full-bridge DC/DC boost converter is efficient because it keeps its efficiency above 90% almost in the entire operation range.
The modified P&O MPPT improved the power conversion compared to the classic method. The panel efficiency enhancement was 5.06%. The results could be better for a real condition of solar radiation, in view of the quick irradiance variation on time due to shadows caused by clouds.
TABLEII
COMPONENTS USED IN THE SIMULATION
Component Specification
Panel KC200GT 200W
𝐶𝑖𝑛 330uF
Mosfets 𝑅𝑠𝑜𝑛 = 0.07Ω, 16 A, 60V
Diodes 1000V, 2A
L 12mH, 5Ω
Transformer 1: 18
C_link 30𝑢𝐹, 450𝑉
𝐶𝑜𝑢𝑡 1000𝑛𝐹, 275 𝑉𝑎𝑐
Fig. 7: Modified P&O MPPT response.
TABLEIII
SIMULATION RESULTS OF THE DC-DC CONVERTER.
PV Operation
Point (10W) 5% (50W) 25% (100W) 50% (200W) 100%
PV voltage: Medium
voltage [V] 24.55 27.35 26.11 26.15 PV current:
Average current [A]
0.4304 1.73 3.83 7.65 PV power [W] 10.56 47.42 100.04 200 Duty Cycle [%] 8.17 15.96 24.81 35.48 DC Link voltage:
Medium voltage [V]
67.73 146.72 212.66 298.79 DC link current:
Average current
[A] 0.1354 0.29345 0.424533 0.59759 Power DC Link
[V] 9.17 43.05 90.45 179.33
Equivalent load
resistance [Ω] 500.22 499.98 499.99 499.99
The result shows that the physical implementation of the device is feasible.
ACKNOWLEDGMENT
The authors would like to thank Coordination for the Improvement of Higher Education Personnel (Capes), the National Counsel of Technological and Science Development (CNPq) and Research Support Foundation of Goias State (FAPEG) for financial support research and scholarships.
R
EFERENCES[1] M. I. Hofferta et al., “Advanced technology paths to global climate stability: Energy for a greenhouse planet,” Science, vol. 298, pp. 981– 987, 01 Nov 2002.
[2] B. Parida, S. Iniyanb, and R. Goic, “A review of solar photovoltaic technologies,” Renewable and Sustainable Energy Reviews, vol. 15, pp. 1625–1636, 2011.
[3] M. H. Rashid, Power electronics handbook, third edition ed. Butterworth-Heinemann, 2010.
[4] N. Femia, G. Petrone, G. Spagnuolo, and M. Vitelli, Power Electronics and Control Techniques for Maximum Energy Harvesting in Photo- voltaic Systems. CRC Press, 2013.
[5] M. G. Villalva, M. F. Espindola, T. G. de Siqueira, and E. Ruppert, “Modeling and control of a three-phase isolated grid-connected converter for photovoltaic applications,” Revista Controle & Automação, vol. 22, no. 3, pp. 215– 228, 2011.
[6] S. B. Kjær, “Design and control of an inverter for photovoltaic applications,” Ph.D. dissertation, Fac. of Eng. and Science, Aalborg University, Denmark, Aalborg, Jan. 2005.
[7] B. Yu, “An improved dynamic maximum power point tracking method for pv application,” IEICE Electronics Express, vol. 11, no. 2, pp. 1–10, 2014.
[8] M. G. Villalva, J. R. Gazoli, and E. R. Filho, “Comprehensive approach to modeling and simulation of photovoltaic arrays,” IEEE Transactions on Power Eletronics, vol. 24, no. 5, pp. 1198–1208, 2009.
[9] G.P. Medeiros, “Analysis and simulation of the p&o mppt algorithm using a linearized pv array model,” 10th Brazilian Power Electronics Conference (COBEP), 2009. [10] L. Piegari, R. Rizzo, I. Spina, and P. Tricoli, “Optimized
adaptive perturb and observe maximum power point tracking control for photovoltaic generation,” Energies 2015, vol. 8, pp. 3418–3436, 2015.