Research Article
July
2017
Computer Science and Software Engineering
ISSN: 2277-128X (Volume-7, Issue-7)
Characterization of Pancreas at Diabetic Patients in CT
Images using Texture Analysis
Mona E. Elbashier*, SuhaibAlameen, Caroline Edward Ayad, Mohamed E. M. Gar-Elnabi
College of Medical Radiological Science, Sudan University of Science and Technology, Khartoum, Sudan
DOI: 10.23956/ijarcsse/V7I7/01701
Abstract: This study concern to characterize the pancreas areato head, body and tail using Gray Level Run Length Matrix (GLRLM) and extract classification features from CT images. The GLRLM techniques included eleven’s features. To find the gray level distribution in CT images it complements the GLRLM features extracted from CT images with runs of gray level in pixels and estimate the size distribution of thesubpatterns. analyzing the image with Interactive Data Language IDL software to measure the grey level distribution of images. The results show that the Gray Level Run Length Matrix and features give classification accuracy of pancreashead 89.2%, body 93.6 and the tail classification accuracy 93.5%. The overall classification accuracy of pancreas area 92.0%. These relationships are stored in a Texture Dictionary that can be later used to automatically annotate new CT images with the appropriate pancreas area names.
Keywords: Pancreas, Computed Tomography, Texture Analysis, Gray Level Run Length Matrix
I. INTRODUCTION
Pancreas is a mixed lobulated pinkish grey colored gland lying transversely across the posterior abdominal wall extending from the concavity of duodenum to the hilum of spleen forming the stomach bed [1]. Being a mixed gland, the pancreas consists of two distinct populations of cells, the exocrine cells secrete enzymes into the digestive tract, and the endocrines secrete hormones into the blood stream [2].
Studies mentioned that both endocrine and exocrine cells arise from the same endodermal rudiment [3]. Knowledge about the normal radiographic anatomy of pancreas is required [4].
In recent years, pancreatic imaging has improved with the introduction of Ultrasonography (US), Computerized Tomography (CT), Magnetic Resonance Imaging (MRI) and Positron Emission Tomography (PET) and may provide an advance enhancement in the morphological study of pancreas. [5] Using the cross-sectional imaging, the pancreatic size is commonly expressed by the anterior–posterior (AP) diameters of the tail, body, and head [6,7].
Thus Computer-Aided Diagnosis (CAD) systems based on image processing and artificial intelligence techniques
have aroused a lot of interest, since they can provide constructive diagnosis suggestions to clinicians for decision-making [8]. Imaging features can be derived from standard of are modalities such as contrast-enhanced computed tomography (CT), magnetic resonance imaging (MRI) and positron emission tomography (PET) without modification of the acquisition protocols making them less cost prohibitive [9,10,11]. For example, texture features from grey level co-occurrence matrices (GLCM) [12], which generate second order statical features have been used improved [13] to quantify spatial texture of objects.
Texture analysis techniques played a vital role in medical imaging to automatically extract parameters that are used to classify normal and abnormal tissues.
II. GRAY LEVEL RUN LENGTH MATRIX
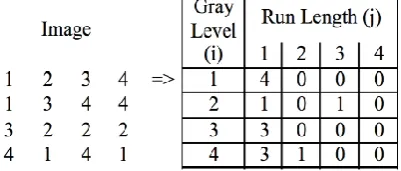
The Gray Level Run Length Matrix is a statistical texture characterization method [14,15,16]. This method consists in counting the number of pixel segments having the same intensity in a given direction, then representing the results in a matrix. A direction (0°, 45°, 90° or 135°) and a number of gray levels are decided on beforehand.
The value contained in the matrix’s (l,n) square is equal to the number of segments of length l and gray level n. This
implies that the matrix’s number of columns is dynamic, as it is determined by the length of the longest segment. By design, this calculation is symmetrical and consequentially, it is unnecessary to consider the four complementary directions (180°, 225°, 270° or 315°, in this example 8 possible directions between a given pixel and its neighbors are taken into account). Figure 4 shows an example of the calculation of a Run Length Matrix:
ISSN(E): 2277-128X, ISSN(P): 2277-6451, DOI: 10.23956/ijarcsse/V7I7/01701, pp. 8-12 Once the matrix obtained, 11 indexes are calculated (When using GLRLM in this study we clicks on areas represents these classes; in these areas a window of 3×3 pixel were set and the higher order statistic were calculated, which include Short Run Emphasis (SRE), Long Run Emphasis (LRE), Gray-Level Nonuniformity (GLN), Run Length Nonuniformity (RLN), Run Percentage (RP), Low Gray-Level Run Emphasis (LGLRE), High Gray-Level Run Emphasis (HGLRE), Short Run Low Gray-Level Emphasis (SRLGLE), Short Run High Gray-Level Emphasis (SRHGLE), Long Run Low Gray-Level Emphasis (LRLGLE), Long Run High Gray-Level Emphasis (LRHGLE),[17] to determine the vector that characterizes the texture.
To establish our model, the matrix for a given gray level and for four directions was calculated. Then, for each index, the average value of the four directions was taken.
A systematic study found that the best model was obtained for a set of 7 indexes and 32 gray levels. The classification success rate was 84.81% by logistic regression, which is inferior to the rate obtained with the cooccurrence matrix and the Haralick features (90%).
III. MATERIAL AND METHODS
All patients examined in two main hospital at Khartoum State-Sudan,with CT scanner Toshiba 64 slices, during the period from 2015 to 2017. CT scans were performed including protocol of axial images from the xiphoid process covers all abdominal area and pelvic down to pubic bone with patient in supine position, head first. with 100/120 Kv and 60/80 mAs and 5 mm slice thickness. Reconstruction used 3mm to obtain coronal views of KUB. analyzing the images with Interactive Data Language IDL software to measure the grey level distribution of images, a total of 100 patients were included in this study.
To classify the pancreas parts to head, body and tail the features of the classified regions of the whole images (as raw data) were classified furthers using linear discriminate analysis
IV. RESULTS AND DISCUSSION
In this paper were features extracted from CT images using GLRLM and All these features were calculated for all imagesand then the data were ready for discrimination which wasperformed using step-wise technique in order to select the most significant feature that can be used to classify the abdomenCT imaging for pancreas regions and the results show that:
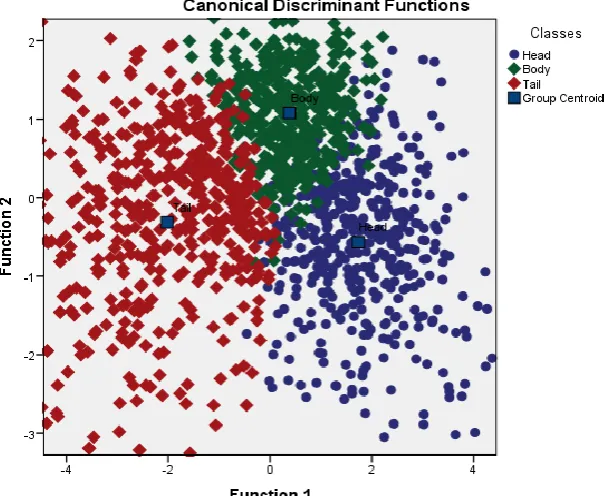
Fig. 2 Scatter plot generated using discriminate analysis function for three classes represents: pancreas head, body and tail the classification showed that the pancreas areas wereclassified well from the rest of the tissues although ithas characteristics mostly similar to surrounding tissue.
Table 1: Showed the classification accuracy of the pancreas regions using linear discriminant analysis:
Classes Predicted Group Membership Total
Head Body Tail
Original
Head 89.2 9.9 1.0 100.0
Body 4.2 93.6 2.1 100.0
Tail 1.1 5.3 93.5 100.0
ISSN(E): 2277-128X, ISSN(P): 2277-6451, DOI: 10.23956/ijarcsse/V7I7/01701, pp. 8-12 Table (1) show classification score matrixgenerated by linear discriminate analysis andthe overall classification accuracyof pancreas parts 92%, were the classificationaccuracy of head89.2 %, body accuracy 93.6 %, While the tail showed aclassification accuracy of 93.5%.
Fig .3 show error bar plot for the CI SRE texturalfeatures that selected by the linear stepwise discriminatefunction as a discriminate feature where it discriminates between all features. From the discriminate power point of view in respect to the applied features the SRE candifferentiate between all the classes successfully.
Fig .4 show error bar plot for the CI LRE textural featuresthat selected by the linear stepwise discriminate function as adiscriminate feature where it discriminates between allfeatures.
ISSN(E): 2277-128X, ISSN(P): 2277-6451, DOI: 10.23956/ijarcsse/V7I7/01701, pp. 8-12
Fig .6 show error bar plot for the CIRLN textural featuresthat selected by the linear stepwise discriminate function as adiscriminate feature where it discriminate between allfeatures.
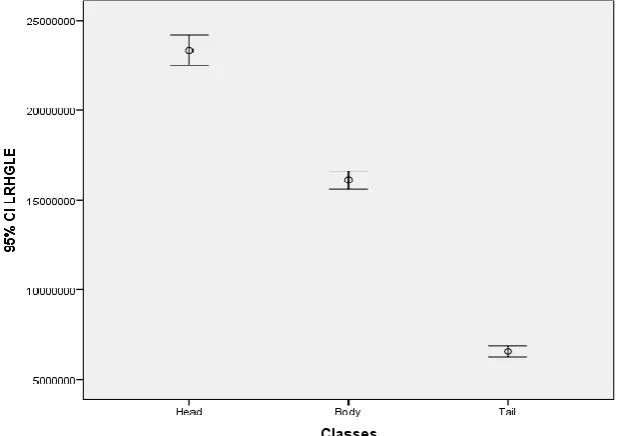
Fig .7 show error bar plot for the CI LRHGLE texturalfeatures that selected by the linear stepwise discriminatefunction as a discriminate feature where it discriminates between all features. From the discriminate power point of view in respect to the applied features the LRHGLE candifferentiate between all the classes successfully.
V. CONCLUSION
Theclassification processes of CT Abdomen were defining the pancreas to head, body and tail and carried out using Interactive Data Language (IDL) program as platform for the generated codes. The result of the classification showed that the pancreas areas were classified well from the rest of the tissues although it has characteristics mostly similar to surrounding tissue.
Several texture features are introduced from GLRLM and the classification score matrix generated by linear discriminate analysis and the overall classification accuracy of pancreas regions 92%, and the classificationaccuracy of pancreas head89.2 %, body 93.6 %, While the tail showed aclassification accuracy 93.5%.
Using Linear discrimination analysis generated aclassification function which can be used to classify otherimage into the mention classes as using the following multiregressionequation;
Head = (SRE * 1240.457) + (LRE * 8.996)+(GLN * 0.236) + (RLN * 221.674) + (RP * 1228.690) + (LRLGLE * -0.182) -1117.167
Body = (SRE * 1227.0.26) + (LRE * 9.080)+(GLN * 0.227) + (RLN * 220.826) + (RP * 1288.936) + (LRLGLE * -0.145) -1158.080
Tail = (SRE * 1121.857) + (LRE * - 8.944)+(GLN * 0.215) + (RLN * 213.636) + (RP * 1289.326) + (LRLGLE * -0.445) -1123.302
ISSN(E): 2277-128X, ISSN(P): 2277-6451, DOI: 10.23956/ijarcsse/V7I7/01701, pp. 8-12
REFERENCES
[1] Williams PL, Warwick R, Dyson M, Bannister HL. ThePancreas. Gray's Anatomy. 37th Ed. Edinburg Churchill
Livingstone. 1989; 1140-53.
[2] McMinn RMH, Rose PG, Hutchings RT, Logan BM.(1995).Pancreas. McMinn's Functional and
ClinicalAnatomy Mosby; 277-9.
[3] Slack JM. (1995).Developmental biology of thepancreas.Development; 121: 15 ,69-80
[4] Vesterhus M, Haldorsen IS, Ræder H, Molven A, Njølstad
[5] Oxford University Press. Oxford New York Toronto.1981; 485-8
[6] KS Basnet, TP Thapa, RP Upreti, PMS Dangol, RN Shrestha and S Dhungel .(2011).A morphometric study of
humanpancreas in Nepalese people Nepal Med Coll J; 13(2): 88-91
[7] Balthazar EJ, Megibow AJ, PozziMucelli R (2009) Imagingofthe pancreas. Acute and chronic pancreatitis.
Springer,Berlin.
[8] Gletsos M, Mougiakakou SG, Matsopoulos GK, Nikita KS; A computer Aided Diagnostic system to
characterize CT focal Liver Lesions: Design and optimization of a neural network classifier in Plastics, 2nd
edition, vol. 3, J. Peters, Ed. NewYork: McGraw-Hill, 1964; 15–64.
[9] Koo HJ, Sung YS, Shim WH, Xu H, Choi C-M, Kim HR, et al. Quantitative Computed Tomography Features
for Predicting Tumor Recurrence in Patients with Surgically Resected Adenocarcinoma of the Lung. Rubin DL, editor. PLoS One. Public Library of Science; 2017;12(1):e0167955
[10] Ahn SY, Park CM, Park SJ, Kim HJ, Song C, Lee SM, et al. Prognostic Value of Computed Tomography
Texture Features in Non–Small Cell Lung Cancers Treated With Definitive Concomitant Chemoradiotherapy. Invest Radiol. 2015;50(10):719–25.
[11] Chae H, Park CM, Park SJ, Lee SM, Kim KG, Goo JM. Computerized texture analysis of persistent part-
solid ground-glass nodules: differentiation of preinvasive lesions from invasive pulmonary adenocarcinomas. Radiology. 2014;273(1):285–93. Available from: http://pubs.rsna.org/doi/10.1148/radiol.14132187?
url_ver=Z39.88-2003&rfr_id=ori:rid:crossref.org&rfr_dat=cr_pub%3dpubmed.
[12] Haralick RM, Shanmugam K, Dinstein I. Textural Features for Image Classification. IEEE Trans Syst Man
Cybern. IEEE; 1973;3(6):610–21
[13] Sebastian B, Unnikrishnan A, Balakrishnan K. Grey level co-occurrence matrices: generalisation and some
new features. Int J Comput Sci Eng Inf Technol. 2012;2(2):610–21.
[14] Chu A., Sehgal C.M., Greenleaf J. F., “Use of grayvalue distribution of run length for texture analysis”.Pattern
Recognition Letters, vol. 11, n° 6, p. 415-419, 1990.
[15] Galloway M. M., “Texture analysis using grey levelrun lengths”, Computer Graphics Image Processing,vol. 4,
p. 172-179, July, 1975.
[16] Haralick R.M., Shanmugam K., Dinstein I., “Texturalfeatures for image classification”, IEEE Transactionson
Systems, Man and Cybernetics, vol. 3, p. 610-621,1973.
[17] Xu D., Kurani A., Furst J., Raicu D., “RunLengthEncoding For Volumetric Texture”,International Conference