Available online throug
ISSN 2229 – 5046
A GOAL PROGRAMMING MODEL
FOR FINANCIAL MANAGEMENT OF A HEALTHCARE SYSTEM
A.V.S.PRASAD*
1, Dr. Y. RAGHUNATHA REDDY
21
Research Scholar,
2Assistant Professor,
Department of OR & SQC, Rayalaseema University Kurnool, Andhra Pradesh, India.
Received On: 31-05-17; Revised & Accepted On: 13-06-17)
ABSTRACT
A
fter the II world war, the, Industrial world faced a depression and to solve the various industrial problems. Industrialist tried the models, which were successful in solving their problems. Industrialist learnt that the techniques of operations research can conveniently apply to solve industrial problems. Then onwards, various models of operations research /Goal Programming have been developed to solve industrial problems. In fact Goal Programming models are helpful to the managers to solve various problems; they face in their day to day work. These models are used to minimize the cost of production, increase the productivity and use the available resources carefully and for healthy industrial growth. Goal programming is an extension or generalisation of linear programming to handle multiple, normally conflicting objective measures and is a branch of multi-objective optimization, which in turn is a branch of multi-criteria decision analysis. In this paper, a goal programming model is developed for financial management of healthcare system in Hyderabad, by considering the goals: asset, liability, equity, profit, income of the health care system. The data was collected from the health care system’s financial statements from 2010 to 2016. The problem was solved using PM-QM for windows and the results are analyzed.Key words: Goal Programming, Financial Management, Asset, Liability, Equity, Profit, Income.
1. INTRODUCTION
For efficient performance of health care system the financial management is very important. A health care system without proper financial management can’t meet the requirements of the market. The various researches have been made so far and the researchers have been continually exploring the application goal programming on financial performance of health care system. MunjaLee [1] had discussed financial analysis of health care system by using liquidity, stability, growth, activity and profitability. Claverley et.al [2] had analyzed the financial performance of health care system by using short-term cash holdings, capital structure and profitability. Goldstein et.al [3] used net income on share holders equity, cash holdings, working capital flow, short -term liquidity, debt structure, accounts receivable recovery, return on asset and cash flow are as indicators for the financial performance of health care system. Trinh et.al [4] used profitability, fixed asset acquisition, working capital efficiency, liquidity, and debt service coverage ratio are the indicators for health care system performance.
The earlier studies were limited to discuss the performance of health care system, but not discussed the goals defined by the management are achieved or not. Financial management of health care system involves multiple criteria and goals, so it requires multiple criteria decision model, particularly goal programming model .In this study we considered asset, liability, income, equity, profit for financial management of a large health care system in Hyderabad.
Goal programming is widely used tool in multi criteria decision analysis [5]. Since goal programming techniques have been applied to many areas such as, plant management [6], portfolio decision analysis [7], marketing executive tour scheduling [8], nurse scheduling [9], agriculture [10], tourism[11], chemical industry [12,], project selection [13], health care planning [14] and many more. In the field of financial management goal programming techniques have been used in portfolio management [15, 16], asset liability management [17], budget planning [18], funding allocation [19] and many more.
Corresponding Author: A. V. S. Prasad*
1,
1Research Scholar,
A Goal Programming Model for Financial Management of a Healthcare System / IJMA- 8(6), June-2017.
2. METHODOLOGY
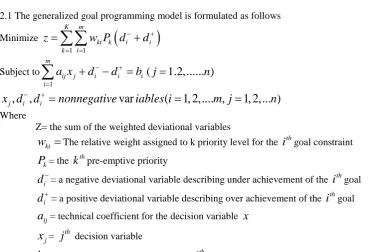
2.1 The generalized goal programming model is formulated as follows
Minimize
(
)
1 1
K m
ki k i i
k i
z
w P d
−d
+= =
=
∑∑
+
Subject to 1
m
ij j i i i
i
a x
d
−d
+b
=
+
−
=
∑
(
j
=
1.2,... )
n
,
,
var
(
1, 2,.... ,
1, 2,... )
j i i
x d
−d
+=
nonnegative
iables i
=
m j
=
n
Where
Z= the sum of the weighted deviational variables
ki
w
=
The relative weight assigned to k priority level for thei
thgoal constraintk
P
= thek
thpre-emptive priorityi
d
−= a negative deviational variable describing under achievement of thei
thgoali
d
+= a positive deviational variable describing over achievement of thei
thgoalij
a
= technical coefficient for the decision variablex
j
x
=j
th decision variablei
b
= the right –hand –side value for thei
thgoal constraintIn the goal programming the objective function is the minimization of the deviational variables. For a goal both the
under achievement (
d
i− ) and over achievement (d
i+ ) cannot be achieved at a time, hence either one or bothdeviational variables is zero, that is
d
i−×
d
i+=
0
.3. DATA OF THE PROBLEM
Table-1 shows the data of the health care system (in Rs.millions).
Table-1
Item(goal) Year Total
2010 2011 2012 2013 2014 2015 2016
Asset 6,196.62 5,980.23 9,640.36 14,632.9 13,575.63 16,963.33 17,828.42 84,817.49
Liability 5,228.46 5,350.15 5,438.24 5,050.31 5,550.09 7,959.93 9,821.75 44,398.93
Equity 15,417.78 17,721.65 23,522.66 27,275.97 29,647.25 31,610.71 34,301.31 1,79,497.33
Profit 1,519.64 1,817.18 2,309.90 3,091.08 3,307.20 3,465.95 3,694.39 19,205.34
Income 18,587.45 23,522.66 28,279.20 33,488.18 38,840.88 46,380.62 54,779.64 2,43,878.63
Total 46,949.95 54,391.87 69,190.36 83,538.44 90,921.05 1,06,380.54 1,20,425.51 5,71,797.72
Table -2 shows the coded values (in Rs. trillions) of the health care system. We coded the values because to enable the analysis with small values.
Table-2
Item(goal) Year Total
2010 2011 2012 2013 2014 2015 2016
Asset 0.0062 0.0060 0.0096 0.0146 0.0136 0.0170 0.0178 0.0848
Liability 0.0052 0.0054 0.0054 0.0051 0.0056 0.0080 0.0098 0.0444
Equity 0.0154 0.0177 0.0235 0.0273 0.0296 0.0316 0.0343 0.1795
Profit 0.0015 0.0018 0.0023 0.0031 0.0033 0.0035 0.0037 0.0192
Income 0.0186 0.0235 0.0283 0.0335 0.0388 0.0464 0.0548 0.2439
Total 0.0470 0.0544 0.0692 0.0835 0.0909 0.1064 0.1204 0.5718
The decision variables are defined as follows
1
x
= the amount of financial statement in year 20102
3
x
= the amount of financial statement in year 20124
x
= the amount of financial statement in year 20135
x
= the amount of financial statement in year 20146
x
= the amount of financial statement in year 20157
x
= the amount of financial statement in year 20163.1The goal constraints
Priority 1 (Asset Accumulation Goal): The management of healthcare system wants to maximize the asset
accumulation. So, we have to minimize the negative deviational variable
d
1− .1 2 3 4 5 6 7 1 1
0.0062
x
+
0.0060
x
+
0.0096
x
+
0.0146
x
+
0.0136
x
+
0.0170
x
+
0.0178
x
+
d
−−
d
+=
0.0848
Priority 2 (Liability Goal): The management wants to minimize the liability. So we need to minimize the over
achievement of the goal, that is positive deviational variable
d
2+1 2 3 4 5 6 7 2 2
0.0052
x
+
0.0054
x
+
0.0054
x
+
0.0051
x
+
0.0056
x
+
0.0080
x
+
0.0098
x
+
d
−−
d
+=
0.0444
Priority 3 (Equity Goal): The equity is to be maximized. So the under achievement variable
d
3− is to be minimized.1 2 3 4 5 6 7 3 3
0.0154
x
+
0.0177
x
+
0.0235
x
+
0.0273
x
+
0.0296
x
+
0.0316
x
+
0.0343
x
+
d
−−
d
+=
0.1795
Priority 4 (Income Goal): The management wants to maximize the income. We have to minimize the under
achievement variable
d
4−1 2 3 4 5 6 7 4 4
0.0186
x
+
0.0235
x
+
0.0283
x
+
0.0335
x
+
0.0388
x
+
0.0464
x
+
0.0548
x
+
d
−−
d
+=
0.2439
Priority 5 (Profitability Goal): To maximize the profit, the under achievement variable
d
5− is to be minimized.1 2 3 4 5 6 7 5 5
0.0015
x
+
0.0018
x
+
0.0023
x
+
0.0031
x
+
0.0033
x
+
0.0035
x
+
0.0037
x
+
d
−−
d
+=
0.0192
Priority 6 (Financial Statement Managing Goal): To maximize the proportion of the values in the financial
statement the under achievement variable
d
6− is to be minimized1 2 3 4 5 6 7 6 6
0.0470
x
+
0.0544
x
+
0.0692
x
+
0.0835
x
+
0.0909
x
+
0.1064
x
+
0.1204
x
+
d
−−
d
+=
0.5718
3.2 Objective function
Minimize
Z
=
Pd
1 1−+
P d
2 2++
P d
3 3−+
P d
4 4−+
P d
5 5−+
P d
6 6−4. RESULTS AND DISCUSSION
The problem was solved by using POM-QM for windows (formerly DS for windows). The following table-3and 4 shows the results. The table-3 shows that
1
0
P
=
,P
2=
0
,P
3=
0
,P
4=
0
,P
5=
0
,P
6=
0
. Therefore all the goals are achieved and the optimal solution is derived.Table-3: Goal achievement
Goal priority Output Achievement
P
1 0 Fully achieved 2P
0 Fully achieved3
P
0 Fully achieved4
P
0 Fully achieved5
P
0 Fully achieved6
A Goal Programming Model for Financial Management of a Healthcare System / IJMA- 8(6), June-2017.
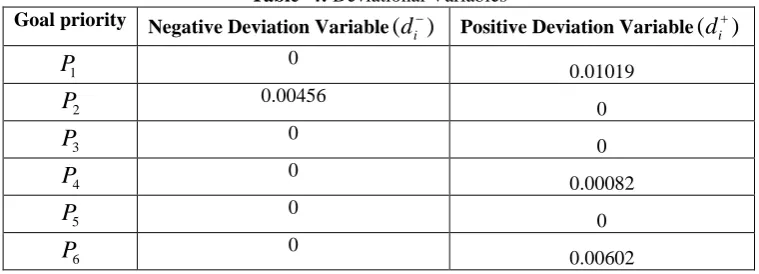
Table -4: Deviational Variables
Goal priority Negative Deviation Variable
(
d
i−)
Positive Deviation Variable(
d
i+)
P
1 0 0.010192
P
0.004560
3
P
00
4
P
00.00082
5
P
00
6
P
00.00602
The table -4 shows the values of positive and negative deviational variables related to the goals from
P
1toP
6. The first priorityP
1 is to maximize the total assets. The goal is fully achieved because the negative deviational variable1
0
d
−=
.But the positive deviational variabled
1+=
0.01019
, this means the asset of the health care system can be increased by 0.01019 trillion per year. The goal of liability reductionP
2 is also achieved sinced
2+=
0
, but the negative deviational variabled
2− =0.00456,this means the liability can be decreased 0.00456 trillion per year. Thethird priority goal
P
3 is fully achieved since both the deviational variablesd
3− andd
3+ are zero; this means the equity amount 0.1795 cannot be changed in the 6 year period. The fourth priority goalP
4is maximizing income is also achieved, since the negative deviational variabled
4− = 0, but the positive deviational variabled
4+ =0.0082, this indicates that the income per year can be increased by 0.0082 trillions. The profitability goal is fully achieved, sinceboth
d
5− andd
5+ are zero, this indicates the total profit 0.0192 cannot be changed in the 6 years period. Lastly the goal6
P
of maximizing the proportion of the values given in the financial statement is also achieved, because the negative deviational variabled
6− =0, but the positive deviational variabled
6+ =0.00602 indicates that the proportion of the values given in the financial statement can be increased by 0.00602 trillion per year.5. CONCLUSION
The model used in this paper indicates that the financial performance of health care system is good, because all the goals are achieved. But the four goals, namely asset, liability, income and proportion of the values of the financial statement can be modified to increase the aspiration level. The developed model can be used as a tool for financial performance of health care systems and other financial institutions also.
REFERENCES
1. Munja Lee. Financial analysis of national university hospitals in korea; Osong public Health Res Perspect: 2015, 6(1), 310-317.
2. Cleverley WO. Improving financial performance: a study of 50 hospitals; Hosp Health Serv Admin: 1989, 35(2), 173-187.
3. Goldstein SM, et al .The effect of location, strategy, and operations technology on hospital performance; Journal of Operations Management: 2002, 20(1), 63-75.
4. Trinh HQ, et.al .The strategic behaviour of US rural hospitals: a longitudinal and path model examination; Health Care Manage Rev: 2000, 25(4), 48-64
5. Ignizio J.P. Goal Programming and Extensions.Lexington:1976, Lexington Books.
6. Diaz-Balteiro, et.al. Forest management optimization when carbon capture disconsidered: A goal programming approach; Forest Ecology Management: 2003, 174,447-457.
7. Hassan, et.al. Portfolio decision analysis with maxmini criterion in the Malaysian stock market .Applied Mathematical Sciences: 2012, 6(110), 5483-5486.
8. M.Mathirajan, et.al A (0-1) Goal programming model for scheduling the tour of marketing executives; European journal of Operations Research: 2007, 179(2), 554-566.
9. M.N.Azaiez, et.al. A (0-1) Goal programming approach for nurse scheduling. Computers and Operations Research March: 2005, 32(3), 491-507.
11. Jiekuan Zhang. Weighing and realizing the environmental, economic and social goals of tourism development using analytical network process and goal programming approach; Journal of Cleaner Production :
2016,127(20), 262-273.
12. Luiz Carlos Barbosa , et.al. Assessment of efficiency and sustainability in a chemical industry using goal programming and AHP; Procedia computer science: 2015, 55,165-174.
13. M.A.Badri, et.al. A comprehensive 0-1 goal programming approach for project selection; International journal of project management: 2001, 19(4), 243-252.
14. Safiye Turgay, et.al. Fuzzy-Goal programming for health care organization; Computers and industrial engineering: 2015, 86, 14-21.
15. Agarana.M.C, et.al. Optimization of banks loan portfolio management using goal programming technique; International journal of research in Applied, Natural, Social sciences: 2014, 2(8), 43-52.
16. Belaid Aouni,et.al. Financial portfolio management through goal programming model; European journal of operations research: 2014, 234(2), 536-545.
17. Giokas.D, et.al. A goal programming model for bank asset and liabilities; European journal of operations research: 1991, 50, 48-60.
18. Ekezie.D, et.al. Goal programming-an application of budgetary allocation of institution of higher learning; Research journal in engineering and applied sciences: 2013, 2(2), 95-105.
19. Hassan.N, et.al. A goal programming with utility function for funding allocation of university library; Applied Mathematical sciences: 2012, 6(110), 5487-5493.
Source of support: Nil, Conflict of interest: None Declared.