Creating a Sticky MOOC
Barbara Oakley
Oakland University
Debra Poole
Central Michigan University
MaryAnne Nestor
Kent State University
Abstract
Learning How to Learn, a MOOC from UC San Diego, is one of Coursera’s most successful offerings; in its first year, nearly one million learners enrolled in the course. As a result of its high student satisfaction levels (4.55 on a 5-point Likert scale) and the persistence of strong student interest in the course, it is worth examining the course’s dynamics more closely in an effort to tease out its sources of satisfaction and popularity. For this paper, we used students’ responses to an open-ended question to develop a list of potentially important “stickiness” features. A subset of students enrolled in the third session of
Learning How to Learn then rated their overall satisfaction with the course and the extent to which each feature contributed to their persistence in the course. Three primary factors suggested by a factor analysis of stickiness items correlated most highly with course satisfaction: Instructor Quality,
Conceptual Clarity/Importance, and Format. A description of the course creation process explains how these factors were achieved through the use of metaphor and analogy, instructor interactions with the graphics, the use of motion to maintain students’ attention, tight scripting, a relaxed presentation demeanor, volunteer TA support, and relevant yet occasionally humorous quizzes.
Introduction
Learning How to Learn (LHtL) is a large and popular MOOC from UC San Diego offered through the Coursera platform. In its first year, the course boasted an enrollment of nearly one million users from over 200 countries and received high word-of-mouth enthusiasm and excellent student satisfaction scores (4.55 out of 5.0 on a Likert scale of 1 = Poor, 5 = Excellent). As a result, it is worth examining the course’s dynamics more closely in an effort to tease out the sources of students’
satisfaction and the course’s popularity. For this paper, we examined evaluation data for the third session of LHtL, which ran during the month of January, 2015. We quantified the activity levels of the session and correlated satisfaction levels with a set of primary factors that appear to provide the strongest motivational incentives for students to continue with the course. These results are presented with a discussion of how the course creation process can support factors that are most important for enhancing students’ satisfaction with a MOOC.
Background
The first three one-month sessions of LHtL, which were offered in late 2014 and early 2015, enrolled over 540,000 students. Presently, the new on-demand version of the course, which allows a rolling start date and variable completion date at the user’s discretion, has added another 370,000 enrolled learners in five months (at the time of this writing)—close to 2,500 learners per day.1
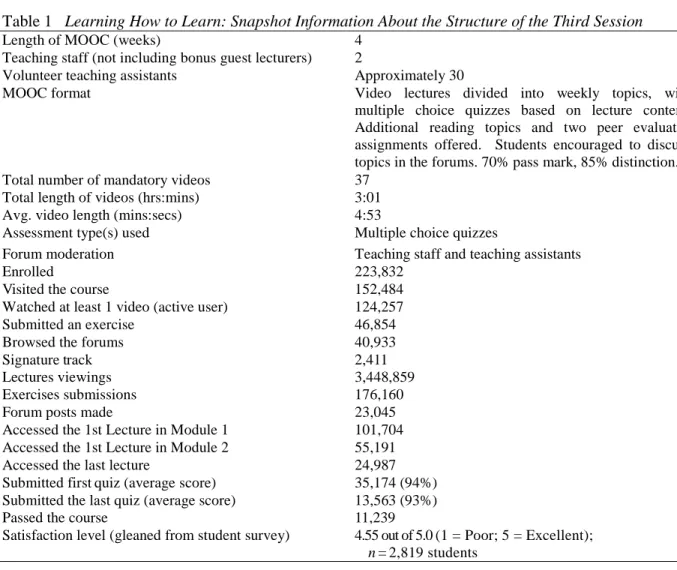
In the January 2015 session of LHtL, 223,832 learners enrolled in the course. Of these enrollees, 152,484 participants (68%) actually visited the course home landing page, and 124,257 participants were active users—that is, users who accessed at least one video. An overview of the January 2015 session of LHtL is provided in Table 1.
Table 1 Learning How to Learn: Snapshot Information About the Structure of the Third Session
Length of MOOC (weeks) 4
Teaching staff (not including bonus guest lecturers) 2
Volunteer teaching assistants Approximately 30
MOOC format Video lectures divided into weekly topics, with
multiple choice quizzes based on lecture content. Additional reading topics and two peer evaluated assignments offered. Students encouraged to discuss topics in the forums. 70% pass mark, 85% distinction. Total number of mandatory videos 37
Total length of videos (hrs:mins) 3:01 Avg. video length (mins:secs) 4:53
Assessment type(s) used Multiple choice quizzes
Forum moderation Teaching staff and teaching assistants
Enrolled 223,832
Visited the course 152,484
Watched at least 1 video (active user) 124,257
Submitted an exercise 46,854
Browsed the forums 40,933
Signature track 2,411
Lectures viewings 3,448,859
Exercises submissions 176,160
Forum posts made 23,045
Accessed the 1st Lecture in Module 1 101,704 Accessed the 1st Lecture in Module 2 55,191
Accessed the last lecture 24,987
Submitted first quiz (average score) 35,174 (94%) Submitted the last quiz (average score) 13,563 (93%)
Passed the course 11,239
Satisfaction level (gleaned from student survey) 4.55 out of 5.0 (1 = Poor; 5 = Excellent); n = 2,819 students
1During the first two months of the transitional period to the new on-demand platform, there was no promotion of the course while the initial bugs were being worked out of the platform.
Context and Literature Review
The average MOOC enrolls about 43,000 students (Jordan, 2014). The completion rate for Coursera, the largest of the MOOC platforms (McGuire, 2014), is typically around 5% (Jordan, 2014). Perna et al. (2014) found the range of completion of the University of Pennsylvania MOOCs to be between 5% and 12%. Jordan, looking at several MOOCs, found completion rates as little as 0.7% and as high as 36.1%, with the average median retention rate about 6.5%.
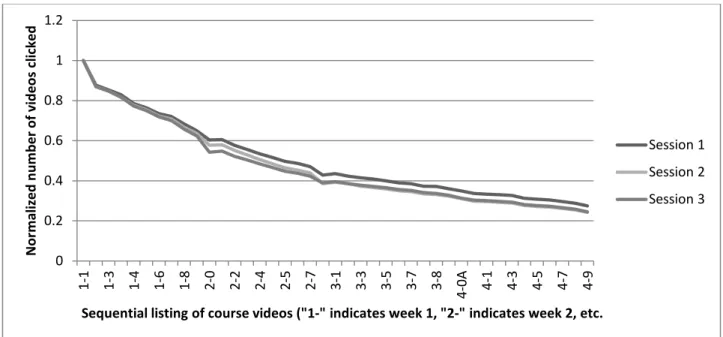
Figure 1 displays the drop off in the number of individuals who accessed a LHtL video over the roughly four-week period of the course. Almost half of the active users accessed the first lecture in Module 2, and 20% of active users (almost 25,000 students) accessed the last lecture. For context, Perna et al. (2014) defined retention rate as the number of students who accessed a lecture in the last module divided by the number who accessed a lecture in the first module. In their analysis of 16 MOOCs, they found median retention rates of 16% to 18%, depending on the method used. The minimum retention was 11% and the maximum was 39%.
The three LHtL sessions occurred in August 2014, October, 2014, and January 2015, before the on-demand version began (which is now in progress). Once a student enrolls in a course, the course (at the time of this writing) is open indefinitely to the student. Students continue to watch videos and submit quizzes long after the course has officially ended. This is most likely the reason why percentages were slightly larger in the first session and slowly decreased in each subsequent session. Session 1 has remained open for almost a year, whereas Session 3 has been closed for only 5 months. This reinforces previous findings by Ho and colleagues (Ho et al., 2014, 2015), as well as by Koller, Ng, and Chen (2013), that students do not necessarily participate in a MOOC in the traditional sense.
0 0.2 0.4 0.6 0.8 1 1.2 1-1 1-3 1-4 1-6 1-8 2-0 2-2 2-4 2-5 2-7 3-1 3-3 3-5 3-7 3-8
4-0A 4-1 4-3 4-5 4-7 4-9
N orma liz ed n umb er o f v id eo s cl ic ke d
Sequential listing of course videos ("1-" indicates week 1, "2-" indicates week 2, etc.
Session 1 Session 2 Session 3
Figure 1: Normalized activity levels for the first three 1-month sessions of LHtL, held in August 2014 (Session 1: 108,095 active learners accessed video 1-1), October 2014 (Session 2: 55,504 active learners accessed video 1-1), and January 2015 (Session 3: 101,704 learners accessed video 1-1). The session’s activity levels are normalized against the number of active learners in that session who accessed video 1-1.
Method
Questionnaire
The high satisfaction levels and resistant activity drop-off rates (i.e., stickiness) of LHtL raise the question, “What makes this MOOC sticky?” In other words, what made students want to stay in LHtL? To explore the characteristics of a sticky MOOC, first-session (August, 2014) students were asked to list the course characteristics/attributes they found most appealing in response to this prompt: This course has had exceptionally high rates of retention and participation. Do you have any thoughts that you could briefly summarize about why you think this course had such high rates of retention and participation? We would like to use the results of your feedback to help other instructors improve their courses.
Of the students responding to the overall survey containing this item (N = 3,043), 2,332 students responded to this open-ended question.
The individual characteristics most frequently mentioned in response to the prompt were grouped into categories representing different course features, and stickiness evaluation questions were constructed to capture these features. In Session 3 (January 2015) of LHtL, students rated how much they felt these course attributes positively or negatively influenced their decisions to stay with the course and participate in course activities. Response options on a 5-point Likert scale ranged from
Very Positively Influenced to Very Negatively Influenced, with an N/A option (See Table 2, next page, for the list of questions). We analyzed relationships between responses to these stickiness questions as well as overall student course satisfaction (M = 4.55, SD = .69) in an effort to tease out information that can help guide MOOC instructors towards making MOOCs with high retention and activity levels.
Student Demographics
In Session 3 of LHtL, 2,819 students provided an overall course satisfaction rating (1 = Poor; 5 = Excellent); the sample for stickiness analyses (i.e., students who answered all 14 stickiness questions) totaled 2,052 students. These students ranged from 14 to 83 years of age (after eliminating two responses with implausible ages), with an average age of 36.54 years (SD = 13.48). Overall, 63.2% of the sample reported being male, 36.6% reported being female, and 0.2% reported “other.” Respondents resided in 121 countries representing Africa (3.8%), Asia (19.2%), Europe (31.2%), North America (33.7%), Oceania (2.7%), and South America (9.5%), with the U.S. being the country with the largest percentage of students (26.5%). Varied responses from 1,980 students reporting their highest level of schooling included 2 students reporting no schooling completed, 42 with only some high school, and 169 students with a high school diploma or equivalent. The remaining students ranged from associate degree holders to individuals with professional (e.g., MD) or PhD degrees (10.0%); the most frequent educational level was a bachelor’s degree, 33.9%. Most respondents were not currently enrolled in an educational program (66.6%), over half were employed (or self-employed) and working at least 35 hours a week, and most reported their English proficiency to be native speaker level or the equivalent (48.7%) (43.0% said their English was “sufficient for most situations” and 8.3% said their English was “sufficient for limited situations”). Thus about half of the students did not have first-language proficiency.
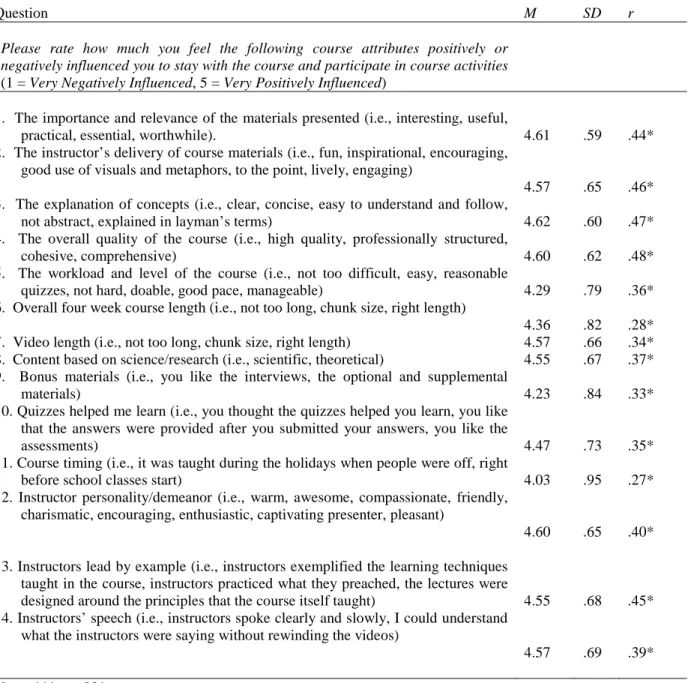
Table 2 Stickiness Questions: Descriptive Statistics and Correlations with Overall Course Ratings
Question M SD r
Please rate how much you feel the following course attributes positively or negatively influenced you to stay with the course and participate in course activities (1 = Very Negatively Influenced, 5 = Very Positively Influenced)
1. The importance and relevance of the materials presented (i.e., interesting, useful,
practical, essential, worthwhile). 4.61 .59 .44*
2. The instructor’s delivery of course materials (i.e., fun, inspirational, encouraging, good use of visuals and metaphors, to the point, lively, engaging)
4.57 .65 .46* 3. The explanation of concepts (i.e., clear, concise, easy to understand and follow,
not abstract, explained in layman’s terms) 4.62 .60 .47* 4. The overall quality of the course (i.e., high quality, professionally structured,
cohesive, comprehensive) 4.60 .62 .48*
5. The workload and level of the course (i.e., not too difficult, easy, reasonable
quizzes, not hard, doable, good pace, manageable) 4.29 .79 .36* 6. Overall four week course length (i.e., not too long, chunk size, right length)
4.36 .82 .28* 7. Video length (i.e., not too long, chunk size, right length) 4.57 .66 .34* 8. Content based on science/research (i.e., scientific, theoretical) 4.55 .67 .37* 9. Bonus materials (i.e., you like the interviews, the optional and supplemental
materials) 4.23 .84 .33*
10. Quizzes helped me learn (i.e., you thought the quizzes helped you learn, you like that the answers were provided after you submitted your answers, you like the
assessments) 4.47 .73 .35*
11. Course timing (i.e., it was taught during the holidays when people were off, right
before school classes start) 4.03 .95 .27*
12. Instructor personality/demeanor (i.e., warm, awesome, compassionate, friendly, charismatic, encouraging, enthusiastic, captivating presenter, pleasant)
4.60 .65 .40* 13. Instructors lead by example (i.e., instructors exemplified the learning techniques
taught in the course, instructors practiced what they preached, the lectures were
designed around the principles that the course itself taught) 4.55 .68 .45* 14. Instructors’ speech (i.e., instructors spoke clearly and slowly, I could understand
what the instructors were saying without rewinding the videos)
4.57 .69 .39* Note. ***p < .001
Results
We reversed-scored stickiness questions for data analyses (i.e., 5 = Very Positively Influenced). As reported in Table 2 (above), stickiness ratings were excellent for all course features, ranging from a low of 4.03 for Course Timing (i.e., dates of availability) to a high of 4.62 for Explanation of Concepts. Correlations among pairs of features ranged from a low of .31 (for the relationship between Bonus Materialsand Course Length) to .74 (for the relationship between Overall Quality of the Course and The Explanation of Concepts); all intercorrelations were significant (p < .001). Correlations between Overall Course Satisfaction and stickiness ratings for individual course features were highly significant (see Table 2, above).
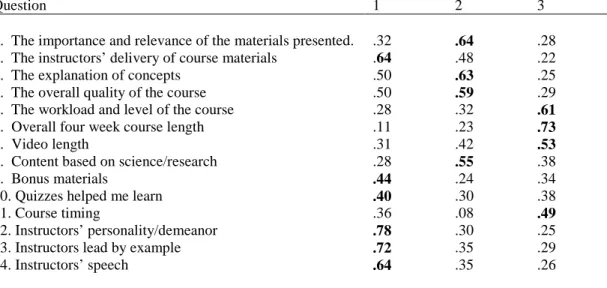
To aid us in reducing stickiness items to a smaller set of course features for further analyses, we entered responses into a principle axis exploratory factor analyses (varimax rotation). Although results of a parallel analysis authorized extracting up to 5 factors, the 3-factor solution reported in Table 3 produced the most interpretable results. Four questions loading most strongly on the first factor reflected instructor characteristics, and these were averaged to create a composite feature called
Instructor Quality: Instructor’s Delivery of Course Materials, Instructor Personality/Demeanor, Instructors Lead by Example, and Instructors’ Speech. Three questions loading most strongly on the second factor composed a second composite called Conceptual Clarity/Importance: Importance and Relevance of the Materials Presented, Explanation of Concepts, and Content Based on Science/Research. Four questions loading most strongly on the third factor composed a third composite called Format: Workload and Level of the Course, Overall Four Week Course Length, Video Length, and Course Timing. Because Quizzes and Bonus Materials showed strong cross-loadings and were distinct course features, we retained these as separate predictors. Finally, Overall Quality of the Course was dropped for subsequent analyses because this question also did not load cleanly on a single factor and did not isolate an individual course feature.
Table 3 Factor Loadings for Exploratory Factor Analysis with Varimax Rotation of Stickiness Questions
Question 1 2 3
1. The importance and relevance of the materials presented. .32 .64 .28 2. The instructors’ delivery of course materials .64 .48 .22
3. The explanation of concepts .50 .63 .25
4. The overall quality of the course .50 .59 .29
5. The workload and level of the course .28 .32 .61
6. Overall four week course length .11 .23 .73
7. Video length .31 .42 .53
8. Content based on science/research .28 .55 .38
9. Bonus materials .44 .24 .34
10. Quizzes helped me learn .40 .30 .38
11. Course timing .36 .08 .49
12. Instructors’ personality/demeanor .78 .30 .25
13. Instructors lead by example .72 .35 .29
14. Instructors’ speech .64 .35 .26
Note. The highest factor loading for each question is bolded.
Mean stickiness ratings for the resulting predictors, in descending order, are as follows:
Conceptual Clarity/Importance, M = 4.59 (SD = 0.53), Instructor Quality, M = 4.57 (SD = 0.58),
Quizzes, M = 4.47 (SD = 0.73), Format, M = 4.31 (SD = 0.62), and Bonus Materials, M = 4.23, SD = .84. All differences between pairs of adjacent features were significant (and remained so with the false discovery rate method; Benjamini & Hochberg, 1995), tConceptual vs. Instructor (1, 2051) = 2.02, p =
.04; tInstructor vs. Quizzes (1, 2051) = 7.60, p < .001; tQuizzes vs. Format (1, 2051) = 10.57, p < .001; tFormatvs.Bonus Materials(1, 2051) = 5.01, p < .001. Correlations between these stickiness features and Overall Course
Satisfaction are reported in Table 4 (next page).
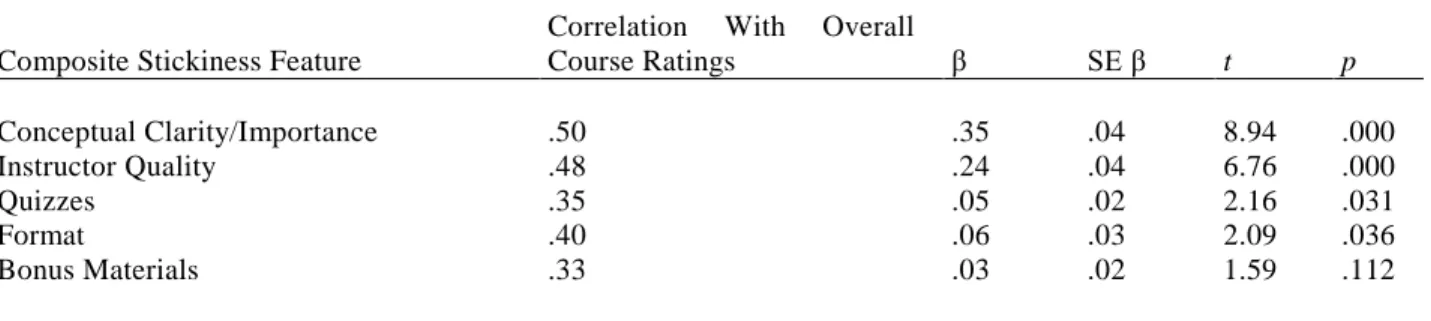
Next, we conducted a multiple regression analysis to explore whether each of the five stickiness features uniquely contributed to predicting Overall Course Satisfaction (Table 4). Collectively, the features predicted 28% of the variability in Overall Course Satisfaction (R2), F(5, 2051) = 162.67, p < .001, and only Bonus Materials did not significantly improve prediction after
controlling for the other features. To view results another way, we entered stickiness scores for the five features into a discriminate analysis to determine how accurately they discriminated students who gave the highest satisfaction rating to the course (5, which was given by 64.13% of students) from other students. The significant model correctly categorized 74.8% of the students, canonical R2 = .48,
Λ = .77, χ2
(5) = 534.87, p < .001.
Table 4 Prediction of Overall Course Satisfaction from Stickiness Ratings: Correlations and Results of a Multiple Regression Analysis
Composite Stickiness Feature
Correlation With Overall
Course Ratings β SE β t p
Conceptual Clarity/Importance .50 .35 .04 8.94 .000
Instructor Quality .48 .24 .04 6.76 .000
Quizzes .35 .05 .02 2.16 .031
Format .40 .06 .03 2.09 .036
Bonus Materials .33 .03 .02 1.59 .112
Note: β = unstandardized estimated coefficients
Discussion
It is perhaps most worthwhile to discuss how the course was created in the context of the three primary factors, Instructor Quality, Conceptual Clarity/Importance, and Format, which appeared to provide the strongest motivational incentives for students to continue with the course. Understanding how the course was created can help explain how the three primary factors of student satisfaction were achieved.
Metaphor and Analogy With Greenscreen
The LHtL instructors attempted to “walk the walk” with learning—i.e., demonstrating through their videos the very techniques they described as being effective techniques for learning. An example of this involves the use of
metaphor and analogy, which can help learners more efficiently grasp difficult ideas (Cat, 2001; Duit, 1991). Metaphor and analogy were not just described by the instructors as being helpful learning techniques, but metaphors and analogies were also included in the course (Fig. 2), using vivid green screen technology that allowed the instructors to walk through PowerPoint animations of the metaphors. In other words, instructors were able, during the course of their videos, to move within the very imagery they were
Fig. 2: The instructor walks amongst the visual metaphors being used to convey important concepts in the course. This image conveys how two differing neural modes are communicated to students as the “focused” and “diffuse” (neural resting state) modes.
describing. Not only did this make the concepts more vividly memorable for students, it also reduced viewers’ cognitive overload (Mayer & Moreno, 2003). This reduction in cognitive overload occurred because viewers did not have to try to process a talking head alluding to other images elsewhere on the screen. Generic clip art type images were avoided. Instead, many of the visuals were created specifically to illuminate the ideas of the course. Many learners commented that some of their most-liked aspects of the course were “the visual tools (animations, pictures, videos) that were used.”
When emphasizing the research basis of the material being presented, the instructor could, for example, “walk” (via green screen) in front of a PubMed abstract, emphasizing the research basis involved, and the research referred to in each video was referenced at the end of each video. Many learner comments highlighted students’ admiration for the “research based facts [and] simple and easy to apply techniques.”
Deliberate, Continuing Sense of Motion in the Videos—The Importance of Hands
The videos were intentionally filled with motion; for example, the instructors might pop from a full standing position “forward” to showing a closer cropped image of the body’s upper half (Fig. 3.) This allowed for an illusion of motion that appears to activate attentional mechanisms in a way that a standard “talking head” does not (Congping Shang et al., 2015; Rossini, 2014; Skarratt, Gellatly, Cole, Pilling, & Hulleman, 2014). The LHtL approach contrasts with that of many MOOCs where an instructor often appears on screen as a relatively motionless talking head through the entire Fig. 3: Each scripted video was filmed twice—once while the instructor was standing full body, and the second while the instructor was filmed from a closer, half-body perspective. This allowed the final cut to cut back and forth from half to full body, providing an illusion of motion that tricks the eye into remaining on the screen.
video. Also, care was taken in LHtL to keep the instructor’s hands in view wherever practicable, so gesticulations made by the instructor could be echoed in viewers’ own mirror neuron systems, helping viewers gain an understanding of what was being taught (Hurley, 2008; Roth, 2001).
Tight Scripting
All videos were tightly scripted, that is, written and rewritten to ensure the instructor’s speech was simple and concise. Unfortunately, it is all too easy for a script from an academician to come out sounding like an academic paper. Careful pre-planning through scripts ensured everything sounded casual yet remained perfectly on point and without a wasted second. “Ums,” “ahs,” and other distracting asides rarely occurred. All of this careful pre-planning, plus the short videos (5 minute on average), helped prevent students from becoming bored. As one learner commented, “[I] really liked how broken down and well-paced it was. Very manageable to complete. Actually it is my first MOOC completed [in] real time.” Another commented that “I liked the structure of [the] course, it was structured in the way that each video tackled specific issue giving both basic information about issue as well as guide how to deal with it.”
Occasional dollops of unexpected humor rewarded students for persisting (for evidence that humor activates a dopaminergic reward system in the brain, see Mobbs, Greicius, Abdel-Azim, Menon, & Reiss, 2003). The contrasting comments of two learners in the course were illuminating. One noted:
[A]ll the structure of the course, even details like proper words, proper pictures, proper timing and elegant messages were of deep meaningful aspects in the course. The professors really know what they are talking about and that has helped me a great deal, for I have been in the education area for 37 years, and now I can start structuring solid basis for my classes.
This contrasted in complementary fashion with the comments of a young fifth grader who also took the course: “I never knew that professors were very witty and the entire course was fun learning.”
The instructors took care to avoid showing off how much they knew—they also avoided lengthy discourses on tangential information. This was possible in part because of the careful scripting. Many learner comments were similar to the following: “Both professors’ dedication to and talent for their subjects, combined with exemplary lack of academic arrogance.” A positive, cheerful attitude was always maintained, leading many learners to find that “[t]he positive attitude!” was one of their favorite aspects of the course. Some learners commented that they came to see the instructors as their friends. Learners also seemed to appreciate that the instructors spoke clearly and enunciated well. Non-native speakers of English—nearly half the students—seemed particularly appreciative that the instructors did not speak too fast. One comment summarizes many open-ended survey comments related to how learners appreciated “[h]ow the instructors speak clearly so non-natives can understand.”
Information was kept precisely on target; essential ideas were conveyed in as simple and practical a way as possible. This helped keep the length of the course to 3 (somewhat breathless) hours of video, making for a one-month timeframe for the course. This is unlike the longer timeframes of many MOOCs and most university classes. Key ideas were emphasized by having limited amounts of text or visuals fly onto the screen. Scripting was the essential key that made this all possible.
Relaxed Demeanor
At first, it is often difficult for instructors to be filmed; often, presenters’ first efforts in front of a screen reveal significant nervousness. To make things easier, video equipment was purchased and the vast majority of the MOOC was filmed in one of the instructor’s basement (Fig. 4). It is worthwhile to note because the instructors did the video editing themselves, the entire MOOC was produced for less than $5,000. Basement-style filming meant the instructors were not under pressure to film under a particular budget or other constraints that often accompany the booking of studio time.
The Importance of TAs/Mentors
The support staff—roughly 30 volunteer Teaching Assistants (“TAs” [now termed “Mentors”])—played an important role in enabling the course to function smoothly. This was noticed by learners, who commented in the open-ended survey question about the “Great interaction in the forums from course staff.”
The importance of a smooth running course team cannot be overstated: It is clear that TAs/Mentors play an extremely important underlying role in making the Format of the course work to fine effect as well as in contributing to Instructor Quality. The TAs/Mentors also contributed to the continued improvement of the course in many different areas. For example, quizzes with pictures, and a humorous introductory quiz that tested on frequently asked questions about the course, grew from ideas by TAs.
Quizzes
The course quizzes were developed with serious care—one of the instructors spent several weeks developing the nearly 100 questions, with their alternates. Teaching Assistant/Mentors, as well as feedback and advice from Coursera, helped improve the quizzes even further. This led some learners to actually list “the short and engaging videos with fun quizzes” as their favorite part of the course. It should be noted that although the quizzes had humor, they retained a strong integrity for bearing down on the central concepts of the course, rather than concentrating on simple memorized facts that did not display true learning of the most important concepts.
Study Limitations
This study was limited in that the final satisfaction survey was completed by students who were largely highly satisfied with the course. Thus, these results do not explore why students might have dropped from the course or why dissatisfied students were dissatisfied. Also, this discussion has laid out one set of course features associated with satisfaction, but this is not restrictive; other approaches might be highly successful as well.
Fig. 4: The LHtL MOOC was filmed almost entirely in a basement studio for less than $5,000 dollars. Note the teleprompter and camera on the right, the three lights in the middle and foreground, and the green screen to the back. It is worth noting that neither instructor had video-editing experience prior to making the MOOC.
Conclusion
Many of the filming approaches used by the creators of LHtL were very supportive of the three primary factors mentioned by students as driving its stickiness: Instructor Quality, Conceptual Clarity/Importance, and Format. These filming approaches included use of metaphor and analogy via green screen technology; deliberate, continuing sense of motion in the videos; gesticulation; tight scripting; solidly evidence-based material that is clearly shown on-screen; an enthusiastic, upbeat, humorous, relaxed demeanor on the part of the instructors; solid support by an enthusiastic team of volunteer TAs; and carefully developed quizzes.
In conclusion, stickiness ratings suggested a set of core characteristics for creating a sticky MOOC:
1. Most important to students is conceptual clarity and importance: a sense that the MOOC presents a coherent set of course concepts that are important, evidence-based, and of practical significance to their lives.
2. Students also place high value on instructors who speak clearly and are warm, engaging, and represent course values through their teaching choices.
3. Assessment is an expected part of learning, and students appreciate when quizzes help them learn.
4. Format and timing decisions are important. Students thrive when material is not overly difficult, is presented in small chunks that can be easily navigated using a variety of paths, and when material can be completed at a convenient time over a number of weeks (4 weeks for LHtL). 5. Finally, students said that stimulating bonus features contributed to their persistence, although
bonus features did not add to the prediction of overall course satisfaction when other core characteristics were already considered.
References
Benjamini, Y., & Hochberg, Y. (1995). Controlling the false discovery rate: a practical and powerful approach to multiple testing. Journal of the Royal Statistical Society: SeriesB, 57, 289–300. Cat, J. (2001). On understanding: Maxwell on the methods of illustration and scientific metaphor. Studies
In History and Philosophy of Science Part B, 32, 395–441.
Congping Shang, Zhihui Liu, Zijun Chen, Yingchao Shi, Qian Wang, Su Liu, . . . Peng Cao. (2015). A parvalbumin-positive excitatory visual pathway to trigger fear responses in mice. Science, 348, 1472–1477.
Duit, R. (1991). On the role of analogies and metaphors in learning science. Science Education, 75, 649– 672.
Ho, A. D., Chuang, I., Reich, J., Coleman, C., Whitehill, J., Northcutt, C., . . . Petersen, R. (2015). HarvardX and MITx: Two years of open online courses Fall 2012–Summer 2014 (March 30, 2015). Retrieved from: Available at SSRN: http://ssrn.com/abstract=2586847
Ho, A. D., Reich, J., Nesterko, S., Seaton, D. T., Mullaney, T., Waldo, J., & Chuang, I. (2014). HarvardX and MITx: The first year of open online courses, Fall 2012–Summer 2013. Retrieved from: Available at SSRN: http://papers.ssrn.com/sol3/papers.cfm?abstract_id=2381263
Hurley, S. (2008). The shared circuits model (SCM): how control, mirroring, and simulation can enable imitation, deliberation, and mindreading. Behavioral and Brain Sciences, 31, 1–22. doi: 10.1017/s0140525x07003123
Jordan, K. (2014). Initial trends in enrollment and completion of massive open online courses. The International Review of Research in Open and Distance Learning, 15, 133–160.
Koller, D., Ng, A., Do, C., & Chen, Z. (2013). Retention and intention in massive open online courses: In depth. Educause Review, 48, 62–63.
Mayer, R. E., & Moreno, R. (2003). Nine ways to reduce cognitive load in multimedia learning.
Educational Psychologist, 38, 43–52.
McGuire, R. (2014). The Best MOOC Provider: a review of Coursera, Udacity and Edx. Skilledup. Retrieved from: http://www.skilledup.com/articles/the-best-mooc-provider-a-review-of-coursera-udacity-and-edx
Mobbs, D., Greicius, M. D., Abdel-Azim, E., Menon, V., & Reiss, A. L. (2003). Humor modulates the mesolimbic reward centers. Neuron, 40, 1041–1048.
Perna, L. W., Ruby, A., Boruch, R. F., Wang, N., Scull, J., Ahmad, S., & Evans, C. (2014). Moving through MOOCs: understanding the progression of users in massive open online courses.
Educational Researcher, 43, 421–432. doi: 10.3102/0013189x14562423
Rossini, J. C. (2014). Looming motion and visual attention. Psychology & Neuroscience, 7, 425–431. Roth, W.-M. (2001). Gestures: their role in teaching and learning. Review of Educational Research, 71,
365–392.
Skarratt, P. A., Gellatly, A. R., Cole, G. G., Pilling, M., & Hulleman, J. (2014). Looming motion primes the visuomotor system. Journal of Experimental Psychology: Human Perception and Performance, 40, 566–579.