To ensure accurate planning of combined orthodontic-surgical treatment of patients with gnathic defects, a careful assessment concern-ing the severity of the maxillo-facial and occlu-sal defect is required. An extremely important el-ement of restoring the correct bone and occlusal relation is taking into consideration the improve-ment of facial aesthetics. Planning and assessing the objective outcome of the surgical-orthodontic defects’ treatment in the craniofacial area is based
on multiple measurements of cephalometric pa-rameters performed on radiographs. The stan-dard remains to conduct measurements on two dimensional images (2D), however, the popular-ity of three-dimensional cephalometry is contin-uously increasing (3D). Nonetheless, due to the lack of population norms and the lack of recog-nized, repeatable, not to mention reliable, param-eters, the 3D method is not perceived as a routine procedure [1].
ORIGINAL PAPERS
Katarzyna Bogusiak
1, A–D, Marek Kociński
2, A, Adam Łutkowski
2, C, D,
Andrzej Materka
2, E, F, Aneta Neskoromna-Jędrzejczak
1, E, FSoft Tissue Profile Changes
After Mandibular Setback Surgery
Zmiana profilu tkanek miękkich
po jednoszczękowych zabiegach korekcji progenii
1 Department of Craniomaxillofacial and Oncological Surgery, Medical University of Lodz, Łódź, Poland 2 Institute of Electronics, Department of Medical Electronics, Technical University of Lodz, Łódź, Poland
A – research concept and design; B – collection and/or assembly of data; C – data analysis and interpretation;
D – writing the article; E – critical revision of the article; F – final approval of article
Abstract
Background. The improvement of facial aesthetics is an important element of restoring the correct bone and occlusal relation. Planning and objectively assessing the outcome of surgical-orthodontic defect treatment in the craniofacial area is based on multiple measurements of cephalometric parameters performed on radiographs.
Objectives. The aim of this study was to assess soft tissue profile changes after vertical (25 patients) and sagittal split ramus osteotomy (28 patients).
Material and methods. The study included 53 patients with mandibular prognathism. The study group included 28 women and 25 men. The age of the patients ranged from 17 to 51 years. Lateral cephalograms (performed before the surgery and 6 months after the surgery) were used to evaluate the results of the treatment. The method proposed by Hwang et al. and the facial contour angle were used as a cephalometric analysis of soft tissue profile changes.
Results. There was no significant difference concerning the changes within the value of the facial contour angle depending on the type of treatment (t = 0.401, p > 0.05). The absolute change of this parameter in the overall group of patients equaled 11.39° ± 6.84, 10.99° ± 7.33 after the EVRO, and 11.75° ± 6.49 after the BSSO.
Conclusions. Both sagittal split ramus osteotomy and vertical ramus osteotomy provide similar improvement in the aesthetics of the facial profile, assessed with cephalometric measurements (Dent. Med. Probl. 2016, 53, 4, 447–453).
Key words: bilateral sagittal split ramus osteotomy (BSSO), extraoral vertical ramus osteotomy (EVRO), cephalo-metry.
Słowa kluczowe: obustronna strzałkowa osteotomia gałęzi żuchwy, zewnątrzustna pionowa osteotomia gałęzi żuchwy, cefalometria.
Dent. Med. Probl. 2016, 53, 4, 447–453
have been created. These programs are based on different two-dimensional (2D) and three-di-mensional (3D) visualization methods of the soft tissues, bones and teeth [2–9]. Due to the great potential provided by modern technology, it is al-so possible to perform a virtual surgery. In addi-tion, the available programs are able to provide an approximate visualization of the aesthetic ef-fect after surgical treatment. Both convention-al and the newest ideas in treatment implement-ed while developing a therapeutic strategy for pa-tients with gnathic defects take into account and focus on profile changes within the soft tissue.
An accurate prediction of soft tissue chang-es after mandibular osteotomichang-es is difficult. This may be related to the large individual variabilities in soft tissue thickness and response to the surgi-cal procedure and changes in bone relation. Oth-er confoundOth-ers that are difficult to foresee include differences in skeletal stability, technical issues and factors associated with the operator, as well as a possible gender and age impact [10]. Although there are certain studies on soft tissue changes, these are mostly based on small samples, and fre-quently concern additional surgical procedures, such as genioplasty or maxillary surgery [11–17].
The aim of this study was to assess soft tissue profile changes after vertical and sagittal split ra-mus osteotomy.
Material and Methods
The study included 53 patients with man-dibular prognathism, who underwent orthogna-thic surgery in our department between January 2005 and December 2013. All patients included in the study also received preoperative orthodon-tic treatment. The age of the patients ranged from 17 to 51 years (mean age = 25.25 years ± 6.95). The study group included 28 women (mean age = 23.64 years ± 7.02) and 25 men (mean age = 27.04 years ± 7.15). The majority (28 out of 53) of patients underwent bilateral sagittal split osteotomy (BSSO) of the mandibular ramus with intraoral access with Obwegeser-Dal Pont’s [18] modification. The remaining patients were treat-ed with an extraoral vertical ramus osteotomy (EVRO). Patients that, for correction of aesthetic defects, required rotation movement of the man-dible and those who did not accept the presence of scars were qualified for the BSSO method. EV-RO was performed in cases for whom feeling dis-turbances were less acceptable than facial scars.
more, the groups did not differ significantly in the aspect of age (p > 0.05). The average age equaled 25.8 years ± 6.61 in the group treated with EVRO and 24.8 years ± 7.45 in patients after the BSSO treatment.
Lateral cephalometric radiographs (performed before the surgery and 6 months after the surgery) were used to evaluate the results of the treatment. Cephalometric measurements based on the meth-od proposed by Hwang et al. [19] and facial con-tour assessment were performed [20]. All mea-surements were carried out by one person, us-ing the digital radiographs and the OrthView 0.6 computer program created in cooperation with the Technical University of Lodz. Each point was marked twice. In case of any discrepancies be-tween the measurements (angles and lengths) ex-ceeding 1° or 1 mm, the mean values were includ-ed in further analysis and comparisons. Each im-age underwent computer geometrical calibration before performing any measurements.
Cephalometric Measurements
The following points are used for measur-ing the facial contour angle: N’ (soft tissue na-sion), Sn (subnasale) and WPg (soft tissue po-gonion) [20]. The following lines are conduct-ed through these points: the SnWPg line and the N’Sn line. The desired angle is contained between the extension of the SnWPg line and the N’Sn line. Negative values of the angle occur when the WPg point is located rearwardly from the extension of the N’Sn line. Angle values ranging from –15º to –7º are assumed as the norm [20]. The method implemented to determine the angle of the facial contour is shown in Fig. 1.Cephalometric analysis according to Hwang et al. [19] includes the determination of the follow-ing reference points:
N – hard tissue nasion, the most prominent point in the frontonasal suture,
N’ – soft tissue nasion, the most concave point in the tissue overlying the frontonasal suture area,
O – indicates the intersection of the NP line (line perpendicular to the Frankfort plane) and the forehead,
G’ – soft tissue glabella, the most prominent point in the midsagittal plane of the forehead,
Prn – pronasale, the most prominent point of the nose,
Sn – subnasale, the point at which the colu-mella merges with the upper lip in the midsagit-tal plane,
Cm – columella, the most anterior soft tissue point on the columella (nasal septum) of the nose,
Ls – labrale superius, the most anterior point on the upper lip,
Li – labrale inferius, the most anterior point on the lower lip,
Sm – supramentale, the point of the greatest concavity in the midline of the lower lip between the labrale inferius and the soft tissue pogonion point,
Pog’ – soft tissue pogonion, the most anterior point on the soft tissue of the chin,
Me’ – soft tissue menton, the most inferior point on the soft tissue of the chin,
Th – throat, the intersection between the sub-mental area and the tangent line of the neck.
The main reference lines determined in this method include:
– NP – nasion perpendicular, established by dropping a line inferiorly from the nasion (N) that is perpendicular to the Frankfort horizontal line,
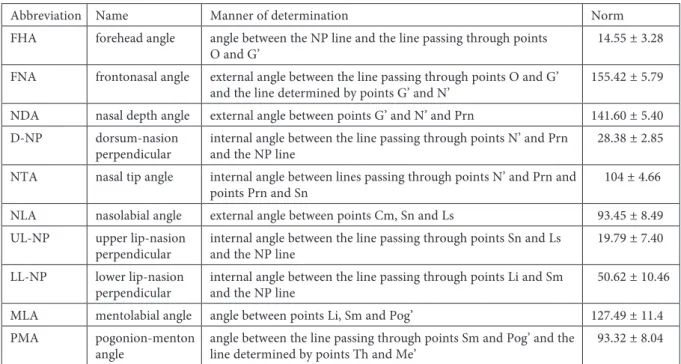
– the line established by the Frankfort plane. The points and main reference lines of the Hwang et al. [19] analysis are shown in Fig. 2, whereas the cephalometric parameters are pre-sented in Table 1.
Statistical Analysis
The mean values of the angles before and af-ter surgical treatment were compared using the Student’s t-test for independent samples. In
or-der to compare the size of an angle change before and after orthognathic surgeries in the analyzed groups of patients, the Student’s t-test was also used. The comparison of the number of patients whose angles were within the norm was made us-ing the c2 test. The normality of the quantitative
variable distributions were assessed using the Kol-mogorov-Smirnov test. The p value < 0.05 was ac-cepted as the level of significance.
Results
The average value of the facial contour an-gle measured in the overall group of patients (in-cluding the patients classified to sagittal split and vertical ramus osteotomy) before surgery equaled 1.52º ± 6.62, and after the treatment it reached –9.87º ± 4.44. All values of this angle after the sur-gery were lower than the values before sursur-gery, so changes of these values are expressed as an ab-solute value. Statistical analysis showed that the value of the facial contour angle after the surgery was significantly improved in comparison to the value before the treatment (t = 12.119; p < 0.0001).
There was no significant difference concern-ing the changes within the value of the facial con-tour angle depending on the type of treatment (t = 0.401, p > 0.05). The absolute change of this parameter in the overall group of patients equaled 11.39º ± 6.84, after the EVRO: 10.99º ± 7.33, and after the BSSO: 11.75º ± 6.49. In the female
Fig. 1. Method implemented to determine the angle of
and male groups, the mean change of this angle was also similar and equaled 11.56º ± 7.12 and 11.20º ± 6.66, respectively (t = 0.187; p > 0.05).
Additionally, the number of patients with a normal value of the facial contour angle report-ed before and after the treatment was comparreport-ed. This comparison revealed that there was no signif-icant correlation between the gender, type of sur-gery and the opportunity to obtain the correct val-ue of this parameter after the surgery (Table 2).
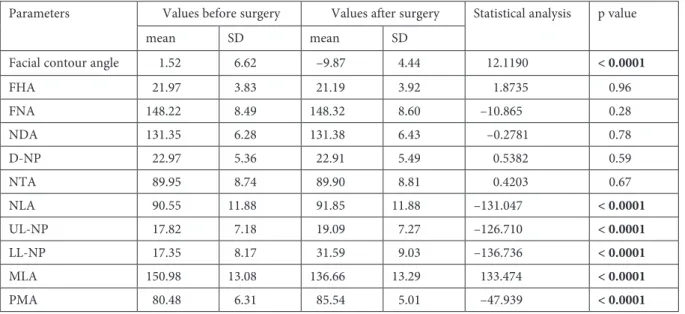
Based on the results of the Hwang et al. [19] analysis, it was observed that the only significant differences in the values of the soft tissue profile noted before and after the treatment concerned the following angles: NLA, UL-NP, LL-NP, MLA and PMA (which essentially relate to the maxillary portion of the face) (Table 3).
Sagittal split and vertical ramus osteotomy cause similar changes in the soft tissue profile. We observed that there were no significant differences within the range of changes concerning particular angles de-pending on the type of surgery conducted (Table 4).
Additionally, we analyzed the number of pa-tients with angle parameters falling in the normal range before and after surgery. Only three param-eters revealed significant increases in the number of patients reaching the population norm after the surgical procedure (lower lip-NP line angle, men-tolabial angle and pogonion-menton angle). It is worth emphasizing that, after the surgery, the value of the angle between the lower lip and NP line was higher in all patients. After the treatment, the num-ber of patients with a normal value of this param-eter increased from 0 to 17 (c2 = 4.63926, p < 0.05).
The value of the mentolabial angle decreased af-ter surgery in all patients. Twenty-four patients reached the normal values of this parameter after the treatment (c2 = 21.91561, p < 0.0001). In the case
of the pogonion-menton angle, its value increased in 37 patients and decreased in 16. However, the av-erage value of this parameter increased statistical-ly significantstatistical-ly. After the treatment, the number of patients with a normal value of this parameter in-creased from 12 to 28 (c2 = 10.27879, p < 0.005).
FHA forehead angle angle between the NP line and the line passing through points
O and G’ 14.55 ± 3.28
FNA frontonasal angle external angle between the line passing through points O and G’
and the line determined by points G’ and N’ 155.42 ± 5.79 NDA nasal depth angle external angle between points G’ and N’ and Prn 141.60 ± 5.40 D-NP dorsum-nasion
perpendicular internal angle between the line passing through points N’ and Prn and the NP line 28.38 ± 2.85 NTA nasal tip angle internal angle between lines passing through points N’ and Prn and
points Prn and Sn 104 ± 4.66
NLA nasolabial angle external angle between points Cm, Sn and Ls 93.45 ± 8.49 UL-NP upper lip-nasion
perpendicular internal angle between the line passing through points Sn and Ls and the NP line 19.79 ± 7.40 LL-NP lower lip-nasion
perpendicular internal angle between the line passing through points Li and Sm and the NP line 50.62 ± 10.46 MLA mentolabial angle angle between points Li, Sm and Pog’ 127.49 ± 11.4 PMA pogonion-menton
angle angle between the line passing through points Sm and Pog’ and the line determined by points Th and Me’ 93.32 ± 8.04
Table 2. Number of patients with normal value of the facial contour angle in the analyzed groups of patients
Groups After the treatment Statistical analysis p value angle within the norm angle out of the norm
n % n %
Women 18 51 10 56 0.0812 0.77
Men 17 49 8 44
EVRO 17 49 8 44 0.0812 0.77
BSSO 18 51 10 56
Discussion
An objective evaluation of facial aesthetics is extremely difficult. That is why different meth-ods of cephalometric measurement, based on de-termining the angles and distances, have been cre-ated [19–21]. In this study, the facial contour angle measurements and analysis proposed by Hwang et al. [19] were applied in order to evaluate the changes within the soft tissue profile. The evalua-tion was performed 6 months after surgery. Our re-sults of the cephalometric analysis showed a signif-icant improvement in soft tissue profile proving the favorable aesthetic result of the treatment.
In the group of patients examined, the an-gle of the facial contour improved significantly. The absolute change in the value of this param-eter 6 months after surgery was similar in both groups, female and male, both among patients af-ter the BSSO and the EVRO.
Other authors have also observed an improved value of this angle in patients with mandibu-lar prognathism who underwent combined orth-odontic-surgery treatment [22]. Williams [20] em-phasizes that the facial contour angle is particu-larly useful in assessing changes in the soft tissue profile in patients with mandibular prognathism due to the fact that it takes into consideration the change in the position of the pogonion point to-wards the line passing through the following skin points: nasion and subnasale.
Out of 10 angle parameters measured in the soft tissue profile analysis proposed by Hwang, et al. [19], only 5 parameters, describing the max-illary part of the face, improved significantly after surgery. Both methods of surgical treatment led to similar changes in the angles. A statistically sig-nificant change was observed in the average value of the angle expressing the position of the upper lip to the nose (NLA), which strongly affects the Table 3. Values of the parameters before and after surgical treatment
Parameters Values before surgery Values after surgery Statistical analysis p value
mean SD mean SD
Facial contour angle 1.52 6.62 –9.87 4.44 12.1190 < 0.0001
FHA 21.97 3.83 21.19 3.92 1.8735 0.96
FNA 148.22 8.49 148.32 8.60 –10.865 0.28
NDA 131.35 6.28 131.38 6.43 –0.2781 0.78
D-NP 22.97 5.36 22.91 5.49 0.5382 0.59
NTA 89.95 8.74 89.90 8.81 0.4203 0.67
NLA 90.55 11.88 91.85 11.88 –131.047 < 0.0001
UL-NP 17.82 7.18 19.09 7.27 –126.710 < 0.0001 LL-NP 17.35 8.17 31.59 9.03 –136.736 < 0.0001
MLA 150.98 13.08 136.66 13.29 133.474 < 0.0001
PMA 80.48 6.31 85.54 5.01 –47.939 < 0.0001
Table 4. Changes in values of parameters in group of patients who underwent EVRO and BSSO
Changes in values of parameters EVRO BSSO Statistical analysis p value Facial contour angle –10.99 7.33 –11.75 6.49 0.4012 0.68
FHA –0.88 0.49 –0.68 0.44 0.6021 0.54
FNA 0.13 0.74 0.09 0.77 0.1889 0.85
NDA 0.00 0.74 0.06 0.76 –0.2973 0.76
D-NP –0.20 0.83 0.06 0.80 –1.1804 0.24
NTA –0.06 1.11 –0.05 0.87 –0.0514 0.95
NLA 1.28 0.76 1.33 0.70 –0.2614 0.79
UL-NP 1.25 0.72 1.30 0.75 –0.2383 0.81
LL-NP 14.41 7.88 14.10 7.45 0.1462 0.88
MLA –14.56 8.13 –14.10 7.65 –0.2156 0.83
ber of people who reached the norm values after the surgery.
The NLA parameter is extremely important in an aesthetic evaluation of the facial profile. The nasolabial angle is characterized by a large in-ter-individual and population variability, which is reflected in a wide range of norms provided by various authors [21, 23, 24]. Some authors empha-size that the value of this angle should be slightly higher for women than for men [24]. These slight-ly higher values of the nasolabial angle for wom-en prove the fact that a slightly upturned female nose may be, and even should be, considered as at-tractive. The standard value assumed in this paper comprised within the range between 84.96º and 101.94º (according to the range proposed by Hwang et al. [19]). Differences in variabilities of the norm accepted for this angle are caused by several fac-tors affecting its value – maxillary hypoplasia, po-sition of the upper incisors, as well as nasal anom-alies (upturned nose). Its size is also affected by the retrusion of the upper lip causing vermilion re-duction, as well as prominent upper lip vermilion, which gives a nice, youthful appearance [25].
The upper lip-NP angle revealed similar de-pendencies as the ones observed in the case of the NLA angle. The mean value of this parameter im-proved after both types of treatment, although it did not lead to a statistically significant increase in the number of people with a normal value of this parameter after the surgery. Some authors suggest that the change of the nasolabial angle is parallel to changes in the upper lip-NP angle.
The average values of the remaining angles, describing the maxillary part of the face, also
wherein the LL-NP angle and the PMA angle in-creased, and the MLA angle decreased. Chang-es in thChang-ese parameters rChang-esulted in a statistical-ly significant increase in the number of patients who scored within the normal range within six months after surgery, which indicates a favorable outcome. As far as this study is concerned, ap-proximately half of patients obtained the normal values of MLA and PMA angles after the surgery. There were no statistically significant differences in the mean value of the changes in these param-eters in patients after the BSSO and the EVRO. The group of women and group of men did not differ in this aspect either.
Discussing the clinical significance of these angles, it is essential to emphasize that, in the case of these parameters, the morphology of the man-dible had a huge influence on the values measured. Therefore, after surgical correction of mandibular prognathism a noteworthy improvement of the above-mentioned angles is observed and these an-gles often reach population norms [22]. However, despite the invention of objective measurements and cephalometric analysis, the evaluation of the soft tissue profile still mainly depends on the sub-jective opinion of the physician and the patient’s expectations.
Conclusion
Both sagittal split ramus osteotomy and verti-cal ramus osteotomy provide similar improvement in the aesthetics of the facial profile, as assessed by cephalometric measurements.
References
[1] Olszewski R., Villamil M.B., Trevisan D.G., Nedel L.P., Freitas C.M., Reychler H., Macq B.: Towards an integrated system for planning and assisting maxillofacial orthognathic surgery. Comput. Meth. Prog. Bio. 2008, 9, 13–21.
[2] Moate S.J., Geenty J.P., Shen G., Darendeliler M.A.: A new craniofacial diagnostic technique: The Sydney di-agnostic system. Am. J. Orthod. Dentofacial. Orthop. 2007, 131, 334–342.
[3] Marchetti C., Bianchi A., Muyldermans L., Di Martino M., Lancellotti L., Sarti A.: Validation of new soft tissue software in orthognathic surgery planning. Int. J. Oral Maxillofac. Surg. 2011, 40, 26–32.
[4] Nakasima A., Terajima M., Mori N., Hoshino Y., Tokumori K., Aoki Y., Hashimoto S.: Three-dimension-al computer-generated head model reconstructed from cephThree-dimension-alograms, faciThree-dimension-al photographs, and dentThree-dimension-al cast models. Am. J. Orthod. Dentofacial. Orthop. 2005, 127, 282–292.
[5] Swennen G.R., Mommaerts M.Y., Abeloos J., De Clercq C., Lamoral P., Neyt N., Casselman J., Schutyser F.: The use of a wax bite wafer and a double computed tomography scan procedure to obtain a three-dimensional aug-mented virtual skull model. J. Craniofac. Surg. 2007, 18, 533–539.
[6] Girod S., Keeve E., Girod B.: Advances in interactive craniofacial surgery planning by 3D simulation and visual-ization. Int. J. Oral Maxillofac. Surg. 1995, 24, 120–125.
[7] Groeve P.D., Schutyser F., Cleynenbreugel J.V., Suetens P.: Registration of 3D photographs with spiral CT images for soft tissue simulation in maxillofacial surgery. Lect. Notes Comput. Sci. 2001, 2208, 991–996.
[8] Swennen G.R., Mollemans W., De Clercq C., Abeloos J., Lamoral P., Lippens F., Neyt N., Casselman J., Schutyser F.: A cone-beam computed tomography triple scan procedure to obtain a three-dimensional augment-ed virtual skull model appropriate for orthognathic surgery planning. J. Craniofac. Surg. 2009, 20, 297–307. [9] Jayaratne Y.S., McGrath C.P., Zwahlen R.A.: How accurate are the fusion of cone-beam CT and 3D
stereo-photographic images? Plos. One, 2012, 7, e49585.
[10] Kolokitha O.E.: Validity of a manual soft tissue profile prediction method following mandibular setback osteot-omy. Eur. J. Dent. 2007, 1, 202–211.
[11] Ingervall B., Thüer U., Vuillemin T.: Stability and effect on the soft tissue profile of mandibular setback with sagittal split osteotomy and rigid internal fixation. Int. J. Adult Orthodon. Orthognath. Surg. 1995, 10, 15–25. [12] Schatz J.P., Tsimas P.: Cephalometric evaluation of surgical-orthodontic treatment of skeletal class III
malocclu-sion. Int. J. Adult Orthodon. Orthognath. Surg. 1995, 10, 173–180.
[13] Enacar A., Taner T., Toroğlu S.: Analysis of soft tissue profile changes associated with mandibular setback and double-jaw surgeries. Int. J. Adult Orthodon. Orthognath. Surg. 1999, 14, 27–35.
[14] Alves P.V., Mazucheli J., Vogel C.J., Bolognese A.M.: How the lower face soft tissue changes after mandibu-lar advancement or setback. J. Craniofac. Surg. 2008, 19, 593–598.
[15] Gaggl A., Schultes G., Kärcher H.: Changes in soft tissue profile after sagittal split ramus osteotomy and ret-ropositioning of the mandible. J. Oral Maxillofac. Surg. 1999, 57, 542–546.
[16] Mobarak K.A., Krogstad O., Espeland L., Lyberg T.: Factors influencing the predictability of soft tissue pro-file changes following mandibular setback surgery. Angle Orthod. 2001, 71, 216–227.
[17] Chou J.I., Fong H.J., Kuang S.H., Gi L.Y., Hwang F.Y., Lai Y.C., Chang R.C., Kao S.Y.: A retrospective analy-sis of the stability and relapse of soft and hard tissue change after bilateral sagittal split osteotomy for mandibular setback of 64 Taiwanese patients. J. Oral Maxillofac. Surg. 2005, 63, 355–361.
[18] Dal Pont G.: Retromolar osteotomy for correction of prognathism. J. Oral Surg. Anesth. Hosp. Dent. Serv. 1961, 19, 42–47.
[19] Hwang H.S., Kim W.S., McNamara J.A.: A comparative study of two methods of quantifying the soft tissue pro-file. Angle Orthod. 2000, 70, 200–207.
[20] Williams S.: A short guide on cephalometry in orthodontics. Polorto. Częstochowa 1998.
[21] Reyneke J.P, Ferretti C.: Clinical assessment of the face. Seminars in Orthodontics, 2012, 18, 172–186.
[22] Szyper-Szczurowska J.: Effectiveness evaluation of the combined surgical and orthodontic treatment carried out on a group of patients with skeletal class III dentofacial deformities. Doctoral thesis, Kraków 2006.
[23] Formby W.A., Nanda R.S., Currier G.F.: Longitudinal changes in the adult facial profile. Am. J. Orthod. Dento-fac. Orthop. 1994, 105, 464–476.
[24] Nanda R.S., Meng H., Kapila S., Goorhuis J.: Growth changes in the soft tissue facial profile. Angle Orthod. 1990, 60, 177–190.
[25] Gordon P., Wander P.: Techniques for dental photography. Br. Dent. J. 1987, 162, 307–316.
Address for correspondence:
Katarzyna Bogusiak
Department of Craniomaxillofacial and Oncological Surgery Medical University of Lodz
Kopcińskiego 22 90-153 Łódź Poland
Tel.: +48 42 677 67 88
E-mail: [email protected] Conflict of interest: None declared Received: 17.07.2016
Revised: 24.07.2016 Accepted: 18.08.2016