Received 17 Aug 2015
|
Accepted 27 Apr 2016
|
Published 29 Jun 2016
The genetic regulatory signature of type 2 diabetes
in human skeletal muscle
Laura J. Scott
1,
*, Michael R. Erdos
2,
*, Jeroen R. Huyghe
1,
*, Ryan P. Welch
1,
*, Andrew T. Beck
1
, Brooke N. Wolford
2
,
Peter S. Chines
2
, John P. Didion
2
, Narisu Narisu
2
, Heather M. Stringham
1
, D. Leland Taylor
2,3
, Anne U. Jackson
1
,
Swarooparani Vadlamudi
4
, Lori L. Bonnycastle
2
, Leena Kinnunen
5
, Jouko Saramies
6
, Jouko Sundvall
5
,
Ricardo D’Oliveira Albanus
7
, Anna Kiseleva
7
, John Hensley
7
, Gregory E. Crawford
8,9
, Hui Jiang
1
,
Xiaoquan Wen
1
, Richard M. Watanabe
10,11
, Timo A. Lakka
12,13,14
, Karen L. Mohlke
4
, Markku Laakso
15,16
,
Jaakko Tuomilehto
17,18,19,20
, Heikki A. Koistinen
5,21,22
, Michael Boehnke
1,
*, Francis S. Collins
2,
*
& Stephen C.J. Parker
7,23,
*
Type 2 diabetes (T2D) results from the combined effects of genetic and environmental
factors on multiple tissues over time. Of the
4
100 variants associated with T2D and related
traits in genome-wide association studies (GWAS),
4
90% occur in non-coding regions,
suggesting a strong regulatory component to T2D risk. Here to understand how T2D status,
metabolic traits and genetic variation influence gene expression, we analyse skeletal muscle
biopsies from 271 well-phenotyped Finnish participants with glucose tolerance ranging from
normal to newly diagnosed T2D. We perform high-depth strand-specific mRNA-sequencing
and dense genotyping. Computational integration of these data with epigenome data,
including ATAC-seq on skeletal muscle, and transcriptome data across diverse tissues reveals
that the tissue-specific genetic regulatory architecture of skeletal muscle is highly enriched in
muscle stretch/super enhancers, including some that overlap T2D GWAS variants. In one
such example, T2D risk alleles residing in a muscle stretch/super enhancer are linked to
increased expression and alternative splicing of muscle-specific isoforms of
ANK1
.
DOI: 10.1038/ncomms11764
OPEN
1Department of Biostatistics and Center for Statistical Genetics, University of Michigan, Ann Arbor, Michigan 48109, USA.2National Human Genome
Research Institute, National Institutes of Health, Bethesda, Maryland 20892, USA.3European Bioinformatics Institute, European Molecular Biology
Laboratory, Wellcome Trust Genome Campus, Hinxton, Cambridgeshire CB10 1SD, UK.4Department of Genetics, University of North Carolina, Chapel Hill,
North Carolina 27599, USA.5Department of Health, National Institute for Health and Welfare, P.O. Box 30, Helsinki FI-00271, Finland.6South Karelia Central
Hospital, Lappeenranta 53130, Finland.7Department of Computational Medicine & Bioinformatics, University of Michigan, Ann Arbor, Michigan 48109, USA.
8Center for Genomic & Computational Biology, Duke University, Durham, North Carolina 27708, USA.9Department of Pediatrics, Division of Medical
Genetics, Duke University Medical Center, Durham, North Carolina 27708, USA.10Department of Preventive Medicine, Keck School of Medicine of USC, Los
Angeles, California 90089, USA.11Department of Physiology and Biophysics, Keck School of Medicine of USC, Los Angeles, California 90089, USA.
12Institute of Biomedicine/Physiology, University of Eastern Finland, Kuopio FI-00100, Finland.13Kuopio Research Institute of Exercise Medicine, Kuopio
FI-00100, Finland.14Department of Clinical Physiology and Nuclear Medicine, Kuopio University Hospital, University of Eastern Finland, Kuopio FI-00100,
Finland.15Department of Medicine, University of Eastern Finland, Kuopio FI-00100, Finland.16Kuopio University Hospital, Kuopio FI-00100, Finland.
17Chronic Disease Prevention Unit, National Institute for Health and Welfare, P.O. Box 30, Helsinki FI-00271, Finland.18Center for Vascular Prevention,
Danube University Krems, Krems 3500, Austria.19Diabetes Research Group, King Abdulaziz University, Jeddah 21589, Saudi Arabia.20Dasman Diabetes
Institute, Dasman 15461, Kuwait.21Department of Medicine and Abdominal Center: Endocrinology, University of Helsinki and Helsinki University Central
Hospital, P.O. Box 340, Haartmaninkatu 4, Helsinki FI-00029, Finland.22Minerva Foundation Institute for Medical Research, Biomedicum 2U, Tukholmankatu
8, Helsinki FI-00290, Finland.23Department of Human Genetics, University of Michigan, Ann Arbor, Michigan 48109, USA. * These authors contributed
T
he prevalence of diabetes in 2015 reached 415 million
adults worldwide, and is projected to increase to 642
million by 2040 (www.idf.org/diabetesatlas). T2D accounts
for
B
90% of these individuals
1. Pancreatic islet beta-cell
dysfunction, accentuated by insulin resistance in skeletal muscle
and other peripheral tissues, are the hallmarks of T2D
2.
To examine the relationship between T2D and related traits
and muscle metabolism, we obtained blood samples and skeletal
muscle biopsies, and performed clinical phenotyping, including
oral glucose tolerance tests (OGTT), on 271 Finnish individuals.
Study subjects were chosen to span the range of glucose tolerance
from normal to newly diagnosed (not on glucose-lowering
drug therapy) T2D.
Because most (
4
90%) T2D and related trait GWAS
single-nucleotide polymorphisms (SNPs) reside in non-coding
regions, we aim to refine the molecular mechanisms underlying
these associations by identifying the target gene(s) and direction
of effect the risk allele has on target gene expression. To
accomplish this, we further perform dense and diverse molecular
profiling on this collection of skeletal muscle biopsies at the
genome, epigenome and transcriptome level. Integration of these
data types allowed us to nominate multiple T2D GWAS SNP
effector transcripts. These genetic, epigenomic and transcriptomic
results represent the largest study of the regulatory landscape in
human muscle and reveal how it relates to T2D.
Results
T2D insights from mRNA-seq maps and clinical phenotypes
.
We sequenced the mRNA from study participants (Fig. 1a,
Supplementary Table 1) to a mean depth of 91.3M strand-specific
paired-end reads, the most comprehensive human skeletal muscle
transcriptome catalogue to date
3–5. We tested for (1) differential
gene expression between individuals with T2D and normal glucose
tolerance (NGT) and (2) association between gene expression and
three T2D-related traits (fasting glucose, fasting insulin and body
mass index (BMI)) (Fig. 1b), adjusting for covariates (see
Methods). At a false discovery rate (FDR) of 5%, we found three
genes differentially expressed with T2D status; most strongly
differentially expressed was a positive regulator of senescence,
ubinuclein 1 (
UBN1
) (
b
¼
0.83,
q
-value
¼
0.0089). At FDR 5%, we
detected a wide range in the number of gene–trait associations,
from 38 for fasting glucose to 6,080 for fasting insulin.
To probe the underlying biology of differential gene expression,
we performed gene ontology (GO) term analysis for each
trait using the strength and direction of trait–gene association
(
log
10(
P
value) signed for the direction of association) as a
predictor of GO term membership
6. We display a pruned list
of the most strongly associated GO terms, selected separately
for terms enriched for genes with positive and negative trait
association (Fig. 1c, Supplementary Fig. 1).
With T2D status, and with increases in fasting glucose, fasting
insulin and BMI, we observed lower expression of genes involved
in endoplasmic reticulum protein localization and translational
elongation. For T2D, the most significant trends were for
decreased expression of cellular respiration genes (
q
-value
¼
1.4
10
35), consistent with previous observations in skeletal
muscle samples from T2D and NGT individuals following
hyperinsulinemic–euglycemic clamp
7. Mitochondrial regulatory
protein PGC-1alpha (PPARGC1A) was identified by Mootha
et al.
7as a potential master regulator of mitochondrial expression.
We observed lower, non-significantly different expression levels
of
PPARGC1A
(
b
¼
0.24,
q
-value
¼
0.57) in individuals with
T2D. Decreased mitochondrial function is a component of the
mTOR pathway which is dysregulated in metabolic diseases;
downregulation of the pathway shifts cells away from protein
synthesis and cell growth and towards protein catabolism
8.
Consistent with this, for T2D, we observed lower expression of
genes
involved
in
generation
of
precursor
metabolites,
translational elongation and higher expression of genes involved
in protein polyubiquitination (Fig. 1c).
Interestingly, higher expression levels of genes for leucocyte
activation were strongly associated with higher levels of fasting
insulin (
q
-value
¼
1.3
10
14) and less strongly with other
traits. This could suggest that muscle samples from individuals
with insulin resistance have increased inflammatory cell
infiltration. However, this association remained when we
estimated and then adjusted for the fraction of white blood cells
(WBCs) and lymphocytes in the muscle samples (see Methods) in
the
trait–gene
expression
analysis
(
q
-value
¼
2.5
10
14,
Supplementary Fig. 2).
Genetic and epigenomic regulatory architecture of muscle
. To
understand how genetic variation may influence muscle gene
expression and thus T2D and related traits, we successfully
genotyped 267 of the 271 samples using the Illumina Omni2.5
array and imputed 8,406,237 SNPs with minor allele frequency
4
0.01 using the Genetics of Type 2 Diabetes (GoT2D) reference
panel (Methods). We tested for association of variants within
1 Mb of the transcription start site (TSS) with gene expression
(cis-eQTL). At FDR
¼
5%, we detected 2,104,118 cis-eQTLs in
19,697 (92%) of 21,420 tested genes (Supplementary Table 2), of
which 168,633 cis-eQTLs remained when pruned on a per-gene
basis by linkage disequilibrium (LD) at
r
2o0.2. cis-eQTLs cluster
at the TSS (Supplementary Fig. 3), as previously noted
9,10. Within
15,449 tested protein-coding genes, 14,479 (93.6%) had
Z
1
cis-eQTLs. Using a complementary approach, we tested for
allele-specific expression (ASE) in protein-coding genes that had a
heterozygous-transcribed SNP in
Z
10 individuals; we detected
ASE at FDR
¼
5% in 7,404 (80.2%) of 9,228 tested genes (see
Supplementary Fig. 4 for overlap with cis-eQTL). We compared
the total set of our cis-eQTL results to those of 361
genotype-tissue expression (GTEx)
5skeletal muscle samples for 95.5M
SNP–gene pairs tested in both studies (Supplementary Fig. 5). Of
these SNP–gene pairs, in our muscle sample at FDR
¼
5% we
detected 3.5M SNP–gene pairs, of which 83.8% had a concordant
direction in GTEx. Comparing our catalogue to the 1.1M GTEx
SNP–gene pairs (FDR
¼
5%), 813K SNP–gene pairs were
significantly associated in both studies; 99% of these had
concordant effect directions.
Previous studies of blood and lymphoblastoid cell lines have
shown enrichment of cis-eQTLs that overlap enhancer and
promoter regions
9,10. To explore this relationship in muscle, we
created chromatin state maps using ChromHMM
11for skeletal
muscle and 30 diverse cell or tissue types, including adipose, liver
and pancreatic islets (Supplementary Fig. 6; see Methods). To
assess the relationship between our skeletal muscle cis-eQTLs and
chromatin states, we calculated enrichment statistics for how these
different features overlap while controlling for minor allele
frequency, distance to TSS and the number of SNPs in LD
12.
We observed enrichment of skeletal muscle cis-eQTLs in genomic
regions with active (promoter, enhancer or transcribed) chromatin
states and a depletion in those with inactive (low signal) chromatin
states across a broad range of cell types (Fig. 2a). This general
enrichment pattern may reflect the predominance of cis-eQTLs
from widely expressed housekeeping genes and mask a smaller set
of muscle-specific genes.
muscle expression level and specificity relative to the panel of 16
diverse tissues; we refer to this score as the muscle expression
specificity index (mESI; Methods) (Fig. 2b). We divided the genes
into mESI deciles, where the 1st decile represents genes that are
expressed at uniformly low levels across all tissues and the 10th
decile represents genes that are highly and specifically expressed
in muscle (Fig. 2c). cis-eQTL SNPs for genes in the 10 deciles
were collected and partitioned into corresponding bins, which
showed a larger range in skeletal muscle chromatin state
enrichments (Supplementary Fig. 7) compared with the general
non-mESI-based enrichments (Fig. 2a).
We previously defined chromatin ‘stretch enhancers’ as long
(
Z
3 kb) regions of tissue-specific active chromatin, and found
they are highly enriched for GWAS variants in disease-relevant
tissues
15,16. Here we observed increasing cis-eQTL enrichment
with increasing mESI decile in skeletal muscle stretch enhancers,
but neither in muscle ‘typical enhancers’ (r800 bp; median
enhancer size) nor in stretch and typical enhancers from other
Normal glucose tolerance (NGT) 97 Skeletal muscle biopsies (271 Finnish individuals)
Impaired fasting glucose (IFG) 36
Impaired glucose tolerance (IGT) 71
Type 2 diabetes (T2D) 67
Vastus
lateralis •Phenotypes/traits (clinical variables) •Genotypes (DNA) N= 267 •Gene expression (RNA)
b
0 0.1 0.2 0.3 0.4 0.5 0.6 0.7 0.8 0.9 1 T2D status
Fasting glucose
Fasting insulin BMI
0.83 0.33 0.37
.83 0.23 0.36
.33 .23 0.60
.36 .60
Fasting insulin BMI Fasting glucose T2D status
−1.5 −1.0 −0.5 0.0 0.5 1.0 1.5 log2(odds ratio)
FDR
0.00001 − 0.05 1e−9 − 0.00001 1e−19 − 1e−9 < 1e−19
Traits
Gene ontology category
Fasting insulin Fasting glucoseBMI
T2D status
Translational elongation Protein localization to endoplasmic reticulum Generation of precursor metabolites and energy Nucleoside triphosphate metabolic process Cellular respiration Multi−organism metabolic process Ribonucleoprotein complex biogenesis Posttranscriptional regulation of gene expression RNA splicing Peptidyl−lysine modification Chromatin modification DNA−templated transcription, elongation Positive regulation of proteolysis Lymphocyte activation Single organismal cell−cell adhesion Regulation of cellular amino acid metabolic process Protein polyubiquitination Anterograde axon cargo transport
a
c
tissues (Fig. 2d, Supplementary Fig. 8). Enrichment remained at
different length thresholds (longest 10, 5, 1%) for calling stretch
enhancers (Supplementary Fig. 9). Super enhancers
17,18, defined
based on the abundance of acetylated lysine 27 on histone H3
(ref. 19), substantially overlap stretch enhancers (Supplementary
Fig. 10) and show similar muscle cis-eQTL enrichment trends
(Supplementary Fig. 11). These results suggest that the genetic
regulatory architecture of muscle-specific gene expression is
preferentially encoded in muscle stretch/super enhancers relative
to typical enhancers.
Regulatory information encoded in DNA is activated through
the binding of transcription factors (TFs) that can alter
nucleosomal
architecture
and
increase
local
chromatin
accessibility. Because the stretch and super enhancer maps are
based on modified histone data sets, it is difficult to detect these
local
TF-binding
events.
To
construct
higher-resolution
regulatory maps across skeletal muscle and specifically within
the larger stretch enhancer regions, we performed open
chromatin accessibility mapping in frozen skeletal muscle using
ATAC-seq
20. We found that ATAC-seq performed on frozen
skeletal muscle is reproducible using 10 and 2 mg tissue inputs
(Fig. 3a, Supplementary Fig. 12), and therefore we combined
these replicates for further analyses. Comparison of our skeletal
muscle ATAC-seq maps with similar maps from adipose
21, the
lymphoblastoid cell line GM12878 (ref. 20), and with our
chromatin states at the
ANK1
locus revealed striking
muscle-specific chromatin architecture that is consistent with the
chromatin state maps (Fig. 3a, orange-highlighted region). For
example, the skeletal muscle ATAC-seq peak calls occur
preferentially at skeletal muscle promoter and enhancer
chromatin states. Applying this analysis genome wide, we found
a high degree of correspondence between the peak calls
and active chromatin states (Fig. 3b). When considering only
TSS-distal (
4
5 kb away from a TSS) ATAC-seq peaks, the
overlap with skeletal muscle strong enhancer chromatin states is
the highest across all tissues (Fig. 3b, Supplementary Fig. 13).
To obtain an even higher-resolution regulatory map, we
performed TF-binding site (TFBS) footprinting analyses, using
the CENTIPEDE algorithm
22. This analysis predicts TF binding
based on the occurrence of a motif and the pattern of ATAC-seq
transposition events surrounding it. To detect motif occurrences
that could be altered by the presence of alleles not in the reference
genome, we used a SNP-aware motif scanning approach
(see Methods). We detected high-quality footprints for the
ubiquitous transcriptional insulator CCCTC-binding factor
(CTCF) and the tissue-specific regulator MYOD (Fig. 3c), in
addition to many other factors (see Methods). Notably, at
nucleosome-size distances adjacent to the CTCF footprint regions
we observe phased spikes in the ATAC-seq signal (Fig. 3c,
left column middle row), consistent with the known
nucleo-some-phasing properties of CTCF
23.
The collection of ATAC-seq peaks and TFBS footprints define
progressively smaller regions within muscle stretch enhancers
(Fig. 3d), and these regions are progressively more enriched to
overlap cis-eQTL at increasing mESI deciles (Fig. 3e).
Collectively, these results demonstrate the high quality of our
frozen skeletal muscle ATAC-seq data and help to refine the
location of transcriptional regulatory variation, suggesting that
Adipose Anterior caudate CD34−PB Cingulate gyrus Colonic mucosa Duodenum mucosa ES−HUES6 ES−HUES64 GM12878 H1 hASC−t1 hASC−t2 hASC−t3 hASC−t4 HepG2 Hippocampus middle HMEC HSMM Huvec Inferior temporal lobe Islets K562 Liver Mid-frontal lobe NHEK NHLF Rectal mucosa Rectal smooth muscle Stomach smooth muscle Substantia nigra Skeletal muscle
1. Active_promoter 2. Weak_promoter 3. Inactive_poised_promoter 4. Strong_enhancer 5. Strong_enhancer 7. Weak_enhancer 9. Transcription_transition 10. Transcription_elongation 11. Weak_transcribed 12. Polycomb_repressed 13. Heterochromatin_low
Chromatin state
Cell/tissue type
0 1 2
log2(enrichment)
1 2 3 4 5 6 7 8 9 10
Skeletal muscle
Thyroid Heart Testes Breast Prostate Kidney Ovary Adrenal
Lymph node
Brain Colon
Adipose
Lung Liver
0 5 10 15 20
0.00 0.25 0.50 0.75 1.00
0 1 2 3 4 5
Density
Muscle expression specitifity index (mESI)
Stretch enhancers Typical enhancers
All genes 1 2 3 4 5 6 7 8 9 10
Skeletal muscle
Adipose
Liver Islets
Substantia nigra Cingulate gyrus Skeletal muscle
Adipose
Liver Islets
Substantia nigra Cingulate gyrus
Tissue
mESI decile
0.0 0.5 1.0 1.5 Enrichment
Stretch enhancers Typical enhancers
1 2 3 4 5 6 7 8 9 10
Skeletal muscle
Adipose
Liver Islets
Substantia nigra Cingulate gyrus Skeletal muscle
Adipose
Liver Islets
Substantia nigra Cingulate gyrus
mESI decile 25
50 75
Tissue
Significance
b
c
d
e
Tissue
log2
(enrichment) –log10(P) Median
FPKM
White blood cells
a
such maps can be used to identify potentially causal TFBSs that
drive cis-eQTL signals.
Linking GWAS SNPs to effector transcripts in muscle
. We and
others previously demonstrated that stretch/super enhancers in
disease-relevant tissues are highly enriched for
GWAS-disease-associated SNPs
15,19, and a recent study identified autoimmune
GWAS SNPs that reside in a T-cell super enhancer and act as
cis-eQTL
24. However, no T2D GWAS cis-eQTLs in stretch/super
enhancers have been identified in any tissues. To identify genetic
regulatory signatures that may contribute to the diabetes
phenotype, we assessed the overlap of our muscle cis-eQTL
catalogue with 225 GWAS SNPs associated with T2D and 7n
T2D-related traits (see Methods). Of the 220 GWAS SNPs assessed in
our study, 99 SNPs in 218 GWAS SNP–gene pairs (of a total 4,545
GWAS SNP–gene pairs) had
Z
1 significantly associated genes.
We performed iterative conditional analysis to identify GWAS
cis-eQTL SNPs likely to be independent of SNPs with substantially
stronger expression associations in the same gene (see Methods).
53 variants in 78 GWAS SNP–gene pairs (59 unique genes)
remained associated (FDR
o5% for the conditional analysis); of
these 38 of the 53 variants remained after pruning at
r
2o0.2. The
top conditional cis-eQTL signals for GWAS SNPs are shown in
Table 1; the full list is shown in Supplementary Data 1.
We observed a top T2D GWAS SNP cis-eQTL signal for the
muscle-specific (mESI decile
¼
10) gene
ANK1
(Fig. 4a), where
the T2D risk allele at rs516946 resulted in increased gene
expression (Table 1). Although the underlying molecular
mechanisms were unknown at the time, this locus was first
reported as being associated with T2D
25,26, the results we present
here help define the impact on skeletal muscle gene expression.
This cis-eQTL SNP resides in a skeletal muscle stretch/super
enhancer (Fig. 4b,c, Supplementary Fig. 14). Notably, there are no
amino-acid-altering variants in strong LD (
r
2Z
0.8) with
rs516946, but several overlap active chromatin marks in skeletal
muscle tissue and human skeletal muscle myoblast (HSMM) cells
(Supplementary Fig. 15). One such SNP, rs508419, is flanked by
skeletal muscle stretch enhancers, resides in an active promoter
specific to skeletal muscle and HSMM, and overlaps an
ATAC-seq peak in our muscle data (Fig. 4c). This active
promoter ATAC-seq peak SNP is immediately upstream of the
TSS for highly expressed short isoforms of
ANK1
(Fig. 4b, see
inset bar plot) and is predicted by our SNP-aware motif scans to
disrupt a TR4-binding site, consistent with what is reported in the
HaploReg database
27.
TSS distal (>5 kb)
Mid-frontal lobe K562 GM12878 H1 Islets Adipose HepG2 HSMM
0.00 0.25 0.50 0.75 1.000.00 0.25 0.50 0.75 1.00
Tissue/cell types
Frozen skeletal muscle ATAC-seq peaks
b
Skeletal muscle
Liver
TSS proximal (<5kb)
Cumulative fraction of total peak bases covered by chromatin states CTCF MYOD CTCF MYOD 0.00 0.05 0.10 0.15 0.20 0.00 0.05 0.10 0.15 0.20 Unbound Bound −1,000 −500 0 500 1,000−1,000 −500 0 500 1,000 Strand F R 0 10 20 30 40
−150 −100 −50 0
50 100 150−150−100 −50 0 50 100 150
Background normalized ATAC−seq signal 0 1 2 Bits 1 C G T A 2
CTA
G
3
T
C
ATG
45 A
C
6 AC
7 GT CA 8 T C 9C
T
10CTGA
1112 T C
G
13 A C T 14 TG
AT15G
16 A C T 17 G C A 0 1 2 Bits 1 T G A C 2 GT C 3 T A C G 4 G C A 5 T C GA 6 C A G 7C
A
8ATG
910 T A C G 11 G
T
12G
13 T A C G 14 GA T C 15 T C A G 16 T G A 17CTGA
18 A T C G Bound
c
80.34 4.6 3.75 0 20 40 60 80d
e
0 1 2 3 4 5 6 71 2 3 4 5 6 7 8 9 10 mESI decile
1. Stretch enhancers 3. (2) + footprints 2. (1) + ATAC-seq peaks
eQTL fold enrichment
a
Muscle peak calls
Skeletal muscle Adipose GM12878
RP11-360L9.4 AGPAT6
AGPAT6 RP11-930P14.1MIR486 RP11-930P14.1 GM12878 Adipose 50 kb RP11-930P14.1 Frozen skeletal muscle (combined) Frozen skeletal muscle (10mg) Frozen skeletal muscle (2mg) GencodeV19 genes ATAC-seq Chromatin states ANK1 Active promoter Weak promoter Poised promoter Strong enhancer Weak enhancer Weak transcribed Transcribed Polycomb-repressed Low or no signal
RP11-360L9.8 NKX6-3
Mean ATAC−seq signal
Distance (bp) relative to motif centre
Genome coverage (Mb)
1. Stretch enhancers 2. (1) + ATAC-seq peaks
3. (2) + footprints
We tested each allele of rs508419 in an electrophoretic mobility
shift assay (EMSA) using nuclear extract from human skeletal
muscle cells (SkMC). We found that the non-risk allele is
preferentially bound compared with the risk allele (Fig. 4d). This
allelic effect was replicated in both human (HSMM) and mouse
(C2C12) myoblast cells (Supplementary Fig. 16). Our ATAC-seq
footprinting results indicate that TR4 is bound at this position
(CENTIPEDE posterior probability
¼
1), and we observe an
allele-specific supershift in the EMSA using a TR4 antibody
(Fig. 4d). Together, these results suggest that TR4 binding at the
non-risk allele is linked to transcriptional repression, consistent
with previous reports about TR4 activity
28,29, and that TR4
binding and repression is disrupted by the T2D risk allele at
rs508419, which results in increased
ANK1
expression.
Further splicing (sQTL) and exon usage (exonQTL) investigation
(see Methods) of the muscle mRNA-seq data revealed complex
splicing patterns that are not apparent when considering bulk gene
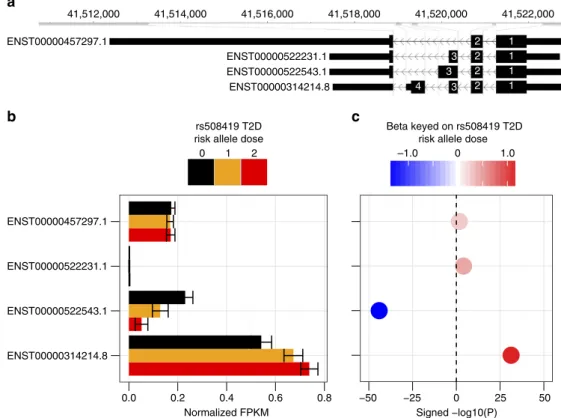
expression. sQTL analysis of the four short
ANK1
isoforms with a
TSS near the active muscle promoter rs508419 SNP (Fig. 5a) showed
that abundance for two of the isoforms (ENST00000522543.1 and
ENST00000314214.8)
is
significantly
affected
by
rs508419
genotype, whereas the other two (ENST00000457297.1 and
ENST00000522231.1) appear to be invariant (Fig. 5b,c).
Interest-ingly, the two variable transcripts change expression by rs508419
T2D risk allele copies in opposite directions: ENST00000522543.1
decreases expression while ENST00000314214.8 increases it
(Fig. 5c). We confirmed this sQTL analysis using an independent
exonQTL analysis, quantitative reverse transcription–PCR and
droplet digital PCR (ddPCR) (Supplementary Figs 17–20).
Discussion
Protein products of the small
ANK1
isoforms we identified as
linked to a T2D GWAS SNP through our skeletal muscle cis-eQTL
map interact with obscurin
30,31, a critical component of, and
required for, proper sarcoplasmic reticulum (SR) assembly
32,33.
The SR is involved in insulin action on glucose uptake through the
regulation of GLUT4 translocation to the plasma membrane
(reviewed in ref. 34). Recently, ANK1 was shown to interact with
IRS1 in skeletal muscle
35. IRS1 is indispensable in insulin action on
glucose uptake in human SkMCs
36. Thus, ANK1 is linked to
glucose uptake in muscle, and alterations to its expression might
perturb this process leading to an insulin-resistant state.
However, how the different small
ANK1
isoforms influence
insulin-stimulated glucose uptake is presently unclear. Functional
studies to better characterize this process are needed.
In summary, we report here on a genome-wide genetic and
mRNA-seq analysis of the largest set of clinically characterized
human muscle samples described to date. We observed lower
expression in T2D individuals for genes involved with cellular
respiration, consistent with a previous smaller study
7. We
demonstrated that the genetic regulatory architecture of
muscle-specific gene expression is highly and specifically
enriched in muscle stretch/super enhancers. We identified T2D
and related trait GWAS SNPs as cis-eQTLs for several genes,
including complex transcriptional and splicing regulation of the
muscle-specific isoforms of
ANK1
that is associated with SNPs
that reside within a muscle stretch enhancer. Together, these
studies define links between GWAS SNPs and their target genes
in skeletal muscle, providing functional insights with potential
precision therapeutic implications for T2D.
Methods
Sample recruitment
.
We attempted to contact still-living FUSION spouses and offspring who participated in FUSION study visits between 1994 and 1998 (ref. 37), individuals who had participated in the population-based Savitaipale Prospective Diabetes Study38, the FINRISK 2007 survey, the Dose Responses to ExerciseTraining (DR’s EXTRA) study39and the Metabolic Syndrome in Men (METSIM)
Table 1 | Detection of independent genic cis-eQTLs associated with T2D and related traits.
GWAS locus gene name*
GWAS trait (s)*
GWAS SNP*
GWAS risk/ higher trait level allele*
GWAS OR/ effect size*,w
eQTL effect sizez
eQTL gene
MESI deciley
eQTL
q-value
eQTL conditional
q-value||
ERAP2 2-h glucose rs1019503 A 0.063 1.16 ERAP2 3 2.11062 7.01084
ERAP2 2-h glucose rs1019503 A 0.063 0.97 LNPEP 7 8.11036 7.81039
ERAP2 2-h glucose rs1019503 A 0.063 0.90 CTD-2260A17.2 7 1.11028 4.41033
AMT Fasting glucose rs11715915 C 0.012 0.61 AMT 1 1.31010 5.81032
ANK1 T2D rs515071 C 1.18 1.01 ANK1 10 1.91019 2.01024
ANK1z T2D rs516946 C 1.09 1.01 ANK1 10 1.91019 2.01024
FADS1, FADS1-2-3 Fasting glucose rs174550 T 0.022 0.77 FADS1 3 4.21018 3.21020
POU5F1/TCF19 T2D rs3132524 G 1.07 0.84 CCHCR1 9 4.21017 1.21019
POU5F1/TCF19 T2D rs3132524 G 1.07 0.79 HCG27 2 4.61015 1.91014
AMT Fasting glucose rs11715915 C 0.012 0.68 NICN1 5 1.61013 1.41013
JAZF1 T2D rs849135 G 1.11 0.38 JAZF1 4 5.3104 5.61011
KCNJ11 T2D rs5215 C 1.07 0.33 ABCC8 NA 1.5102 1.41010
GPSM1 T2D rs11787792 A 1.15 0.38 GPSM1 1 1.9103 6.71010
PROX1 Fasting glucose rs340874 C 0.021 0.49 PROX1-AS1 3 1.3106 7.51010
PROX1 T2D rs340874 C 1.07 0.49 PROX1-AS1 3 1.3106 7.51010
ZFAND3 T2D rs9470794 C 1.12 0.90 ZFAND3 9 5.1108 1.4109
2-h, 2 hour; eQTL, expression quantitative trait locus; GWAS, genome-wide association studies; SNP, single-nucleotide polymorphism; T2D, type 2 diabetes; TSS, transcription start site. T2D and related trait GWAS and candidate gene-associated variants were tested for association with genes whose most distal TSS was within 1 Mb of the variant.
*We use GWAS to denote GWAS or candidate gene studies.
wT2D odds ratio (OR) or trait effect size for GWAS risk or higher trait level allele.
zeQTL effect for GWAS risk or higher trait level allele.
yDecile 10 denotes most muscle-specific expression, NA denotes insufficient expression in the Illumina Body Map tissues to estimate specificity. ||15 most significant conditional cis-eQTL results (for the 4,545 tested GWAS-SNP–gene pairs) that also have an cis-eQTLq-valueo0.05 (genome-wide).
study40. Additional subjects were recruited by newspaper advertisements. We
excluded individuals: (1) with drug treatment for diabetes, (2) with diseases that might be expected to confound the analyses (for example, cancer, skeletal muscle diseases, acute or chronic inflammatory diseases), (3) with diseases that increase haemorrhage risk during biopsy (for example, von Willebrand’s disease, haemophilia, severe liver diseases), (4) taking medications that need to be taken daily and increase haemorrhage risk in the biopsies including warfarin (patients on acetosalicylic acid were instructed to stop for 7 days prior to biopsy), (5) taking medications that could confound the analyses (for example, oral corticosteroids, other anti-inflammatory drugs such as 5-ASA, infliximab or methotrexate), and (6) of ageo18 years. The study was approved by the coordinating ethics committee of the Hospital District of Helsinki and Uusimaa. A written informed consent was obtained from all the subjects.
Clinical visit
.
We performed clinical visits in Helsinki, Savitaipale and Kuopio. 279 individuals participated in both clinical and muscle biopsy visits(see below). The clinical visit included a 2-h, four-point OGTT and other phenotypes measured after a 12-h overnight fast, and health history, medication and lifestyle questionnaires. The clinical visit took place for an average of 14 days
before the biopsy visit (90% of clinical visitsr32 days before biopsy; range 89 days before to 15 days after). We defined glucose tolerance categories of NGT, impaired glucose tolerance (IGT), impaired fasting glucose (IFG) and T2D using World Health Organization (WHO) criteria41.
Phenotype measurements and laboratory analysis
.
We measured height and weight in light clothing. Waist circumference was measured midway between the lower rib margin and the iliac crest. We determined OGTT plasma glucose (fluoride citrate plasma) concentrations by hexokinase assay (Abbott Architect analyzer, Abbott Laboratories, Abbott Park, IL, USA) and serum insulin by chemiluminescent microparticle immunoassay (Architect analyzer). Glucose and insulin analyses were done at a certified core laboratory at the National Institute for Health and Welfare, Helsinki, Finland.Muscle biopsy visit
.
Biopsies were performed using a standardized protocol and one physician (T.A.L.) trained all doctors performing biopsies. We instructed participants to avoid strenuous exercise for at least 24 h prior to biopsy. Following overnight fast, we obtainedB250 mg vastus lateralis skeletal muscle using ad
Position on chr8 (Mb)
b
rs516946
0.2 0.4 0.6 0.8
ANK1 SFRP1
MIR548AO
RPS29P2
CTD–3080F16.3 SNORD65
RP11–15G16.1
GOLGA7
KRT18P37 GINS4
AGPAT6
NKX6–3
MIR486 Y_RNA
RP11–930P14.2
RN7SL149P KAT6A
AC090571.1
SNORD112
RP11–589C21.1 AP3M2
41.2 41.4 41.6 41.8 42
0 5 10 15 20
0 20 40 60 80 100
a
0 1 2
Bits
1 G
C
A
2 T G A
C
3T
C
CT
4 5A
G C
T
6 C
T
CG
A7 8G
C
A
9
A
G
C
10A
T
C
TCG
G
CC
T
C
T
C
A
CC
TACT
Chromatin states
ATAC-seq peak
* * * * * * * *
* * * * * * * * * * * * * * * * * * * * *
Mid-frontal lobe K562 GM12878 H1 Islets Adipose HepG2 Liver HSMM Skeletal Muscle
A(non-risk)/G(risk)
Probe
Competition
Lane SkMC
TR4 ab
hg19 reference genome TR4 motif
– –
A G G A
1
A A A A A G G G G G
+ +
2 3
+
+ + + + + + +
4 5 6 7 8 9 10 Skeletal muscle
HSMM Liver HepG2 Adipose Islets H1 GM12878 K562 Mid-frontal lobe
100 kb
rs516946
AGPAT6
AGPAT6
RP11-360L9.8
ANK1
Y_RNA RP11-930P14.2 R7SL149P
Select T2D GWAS SNPs
ANK1
Gencodev19 genes
Chromatin states
rs508419
ENST00000265709.8
Poised promoter Weak transcribed Low or no signal Weak promoter
Weak enhancer Polycomb-repressed Active promoter
Strong enhancer Transcribed
ENST00000379758.2 ENST00000396942.1 ENST00000396945.1 ENST00000352337.4 ENST00000347528.4 ENST00000289734.7
0.0 0.2 0.4 0.6 ANK1 isoform expression in
muscle
ENST00000314214.8 ENST00000522543.1 ENST00000522231.1 ENST00000457297.1
Recombination rate (cM/Mb)
rs516946rs515071rs508419rs9694034rs6989203rs11354309rs28591316rs28602970rs35273426rs10109812rs750625rs3802315rs3802316rs13266210rs11995075
NKX6-3
Normalized FPKM
–log
10
(
P
value)
c
Figure 4 | T2D GWAS SNPs in a muscle-specific stretch enhancer ofANK1provide mechanistic insights into T2D pathophysiology in skeletal muscle.
(a) Regional association plot showing the significance of SNPs (points) associated with expression ofANK1(highlighted with red rectangle), where the best cis-eQTL rs516946 (purple point) is a T2D GWAS SNP. (b) UCSC genome browser view of chromatin states nearANK1isoforms. The chromatin states between skeletal muscle and other T2D relevant cell types (adipose, liver, islets) are markedly different.ANK1is associated with hereditary spherocytosis, a disease of the red blood cells, which is consistent with the transcribed chromatin states in K562, a myelogeneous leukaemia line of the erythroleukemia type. T2D and related trait GWAS SNPs (dark green) and SNPs in strong LD (r2Z0.8; blue) are found within muscle-specific stretch enhancers.ANK1
conchotome, under local anesthesia with 20 mg ml1lidocaine hydrochloride without epinephrine. Altogether 9 experienced and well-trained physicians collected 331 muscle biopsies in 2009–2013 in 3 different study sites (Helsinki, Kuopio and Savitaipale). Three physicians, one in each site, performed most of the biopsies (237). All physicians were trained to perform the biopsy in an identical manner. The muscle samples were cleaned of blood, fat and other non-muscle tissue by scapel and forceps, rinsed with NaCl 0.9% solution, and frozen in liquid nitrogen. Samples were frozen within 30 s after sampling. Muscle samples were then stored at80°C for a duration of 0–4 years before analysis. Overall, the biopsy procedure was well-tol-erated. Apart from a few expected cases of bruising, numbness at the biopsy site and vasovagal reactions, there were no clinically significant adverse sequelae.
RNA isolation and mRNA sequencing
.
We visually dissected 30–50 mg of each frozen muscle biopsy sample to avoid adipose tissue. Total RNA was extracted and purified with Trizol (Invitrogen, Carlsbad, CA). RNA integrity numbers ranged from 7.2 to 9.4 (median 8.5). To minimize and quantify batch effects, we randomly queued samples for sequencing using a 24-sample barcode-pooling approach and targeted proportional representation of the OGTT states (NGT, IGT, IFG and T2D) in each sequencing batch. External RNA Controls Consortium (ERCC) RNA controls were spiked prior to barcoding to facilitate library quality control (QC). Poly(A)-selected RNA samples were sequenced by the NIH Intramural Sequencing Center (NISC) using the Illumina TruSeq directional mRNA-seq library protocol to a targeted depth of480 million 100 bp paired-end reads per sample. In total, 279 samples and 7 technical replicates were sequenced in 3,386 read groups on 164 lanes using 6 different HiSeq sequencing machines.mRNA-seq processing and QC
.
We retained RNA-seq reads passing the Illumina chastity filter and mapped reads to a reference sequence composed of ERCC control fragments and all chromosomes and contigs from hg19, excluding alternate haplotypes, replacing chromosome M with the Cambridge Reference Sequence and masking the pseudoautosomal region on chromosome Y. We aligned reads using STAR (version 2.3.1y)42with default parameters and a splice junction catalogue based on Gencode v19 (ref. 43). Duplicate read pairs were retained. Non-uniquely mapping reads and read pairs with unpaired alignments were discarded.RNA-seq QC was performed at the level of read groups (that is, a library on a lane) using QoRTs44. We inspected the comprehensive set of QC metrics generated by QoRTs for outlying libraries, lanes and sequencing runs. We additionally used the 92 ERCC RNA spike-in controls and in-house scripts to assess library quality and batch effects, and to check the accuracy of the strand-specific protocol45. This
process revealed one outlying library for insert size and a second library with gene body coverage skewed towards the 30end, possibly indicating RNA degradation.
Both of these libraries were removed from further analyses.
Inspection of read counts revealed systematic batch effects for the proportion of reads mapping to the mitochondrial genome, with up to 52% mitochondrial reads in some sequencing batches. We examined library degradation within affected batches by inspecting gene body coverages for individual highly expressed single-isoform genes and ERCC spike-in transcripts. This did not show any evidence of RNA degradation, but did reveal the presence of systematic batch effects with patterns of read coverage heterogeneity along genes or spike-in transcripts, typically highly similar within batches with noticeable systematic differences between some batches. This result strongly suggests we can correct for these in downstream analyses. Further analysis revealed that batches with high-mitochondrial read fractions had lower estimated RNA fragment lengths.
To address variability in mitochondrial read fraction, we calculated fragments per kilobase transcript per million mapped reads (FPKMs) separately for nuclear genes, mitochondrial genes and ERCC transcripts. PCA on the nuclear genome FPKM matrix and colour labelling by sequencing batch also revealed the presence of systematic batch effects. PCA on the ERCC spike-in FPKM matrix recapitulated these batch effects. In our primary trait-gene expression association analysis, we correct for these observed batch effects. In the cis-eQTL analyses, we correct for these observed batch effects, as well as unknown technical confounders, by using the PEER framework46. PCA after PEER correction effectively removed batch
effects (Supplementary Fig. 21). We further investigated possible technical confounders in mRNA-seq by checking for sample-specific GC-content biases, which have been reported in early RNA-seq studies. We found no evidence for such effects in our data.
We used verifyBamID47to check for sample swaps and contamination. We asked if reads in the RNA-seq BAM files matched the SNP chip genotype data in transcribed regions for each individual, and determined whether BAM files were contaminated and comprised of reads derived from more than one individual. We identified two pairs of sample swaps which we were able to correct; one of these samples had an estimated contamination of 8% and was excluded. As an additional check for sample swaps and to detect outliers, we verified reported sex by examining expression of theXISTgene and mean Y chromosome gene expression. PCA on the FPKM matrix identified four samples as outliers; they were removed from further analyses. One additional sample was an outlier with respect to age (20 years) and was excluded. After all QC exclusions, 271 samples remained and were used for trait-associated expression analyses; of these, 267 had genotype data available and were used for cis-eQTL analyses.
ENST00000314214.8 ENST00000522543.1 ENST00000522231.1 ENST00000457297.1
0.0 0.2 0.4 0.6 0.8 Normalized FPKM
1 0 2
−50 −25 0 25 50 Signed −log10(P)
a
b
1.0 –1.0 0
rs508419 T2D risk allele dose
Beta keyed on rs508419 T2D risk allele dose ENST00000314214.8
c
ENST00000522543.1 ENST00000522231.1 ENST00000457297.1
41,512,000 41,514,000 41,516,000 41,518,000 41,520,000 41,522,000
1 1 1 1 2 2 2 2 3 3 3 4
Expression quantification
.
To study a wide spectrum of regulatory variation, we performed analyses at three levels: gene, exon and transcript. Definitions for all transcriptome features were based on GENCODE v19 (ref. 43). We counted fragments mapping to genes using htseq-count v0.5.4 (ref. 48) (http://www-huber. embl.de/users/anders/HTSeq/doc/count.html) and calculated FPKM values for each gene. For differential expression analysis and cis-eQTL mapping, we filtered for genes with five or more counts inZ25% of samples. We counted reads in exonic parts of genes using dexseq_count v1.0.2 (ref. 49) and calculated exon-level FPKMs for all transcripts in the GENCODE v19 comprehensive annotation. To avoid double-counting of fragments in the quantification of exon abundance, we clipped overlapping read pair mates using the ClipOverlap function of BamUtil (http://genome.sph.umich.edu/wiki/BamUtil:_clipOverlap). We estimated transcript abundance using rSeq (http://www-personal.umich.edu/Bjianghui/rseq/) which is based on a Poisson regression model50. This model uses information from the insertlength distribution inferred using the aligned read fragments which has been shown to help improve estimation. To reduce the number of transcripts per gene to avoid identifiability issues and to restrict analysis to high-confidence transcripts, we estimated transcript expression values for the subset of GENCODE transcripts with the tag ‘basic’ in the GTF file.
Trait–gene expression association
.
We use ‘trait’ to refer to T2D status or a related quantitative trait. First, we describe trait–gene expression analyses with adjustment for known covariates. Second, we describe an analysis that also includes adjustment for unknown factors learned from the gene expression data. Our primary analysis was without adjustment for unknown factors since we were concerned that the unknown factors might include biological signal, as well as expression differences due to technical issues. We compare the results of the two analyses.T2D–gene expression association
.
For individualiand genej, letTidenote T2Dstatus {0¼NGT, 1¼T2D} andZi¼{Z1,Z2,y.,ZC}Tthe vector ofccovariates. Let
Yij, denote the rank-based inverse normalized FPKMijwhere inverse normalization
is performed for each gene, randomly breaking ties. We tested for association betweenYijand T2D status using the linear regression model:
Yij¼ajþbjTiþgTjZiþeij ð1Þ
whereajis the intercept,bjis the regression coefficient for T2D status on genej,gja
vector of coefficients for the covariates andeijis a normally distributed error term
with mean 0 and variances2. We included as covariates age, sex and experimental
batch.
Quantitative trait–gene expression association
.
To define a transformed quantitative traitXi, we (1) inverse normalized the raw quantitative trait, (2)adjusted for age, sex and experimental batch by linear regression, and (3) inverse normalized the resulting residuals. To define the gene expression value,Yij, for each
gene we (1) inverse normalized FPKMij, (2) performed linear regression of age, sex
and experimental batch on the inverse normalized FPKMijand (3) inverse
nor-malized the resulting residuals. We then tested for association between transformed gene expressionYijand each transformed quantitative traitXiusing linear
regression model:
Yij¼ajþbjXiþeij ð2Þ
wherebjis the regression coefficient forXion genej.
We used FDR51to account for multiple testing and considered as significant
associations with FDRr5%.
Association analysis adjusting for unobserved confounders
.
To examine the effect of potential unobserved technical confounders on gene expression–trait association, we modified our definition of transformed gene expressionYijby (1)inverse normalizing FPKMij(2) performing factor analysis via PEER46,52on the
inverse normalized FPKMs specifying from 1 to 15 factors, together with covariates age, sex and experimental batch, and (3) inverse normalizing the residuals. We used the transformedYijto perform differential expression analysis for each trait as
above for T2D (equation (1)) and quantitative traits (equation (2)). For each trait, we selected the number of factors that maximized the number of differentially expressed genes. We ran GO term analysis and compared the results to those obtained without adjustment (see below)
Association analysis adjusting for tissue heterogeneity
.
The presence of non-muscle cells/tissue within the non-muscle biopsies may influence the trait and quan-titative trait-expression analysis. To investigate this, we estimated tissue hetero-geneity, via tissue deconvolution analysis, using the DeconRNASeq R package (v1.8.0)53. As a reference transcriptome panel, we used skeletal muscle, adipose, WBC and lymph node transcriptomes from Illumina Body Map 2.0, randomly subsampling reads to an equal amount and calculating FPKMs. For each reference tissue, we calculated the expression specificity index (see below) of each gene and selected the top 500 tissue-specific genes per tissue to use as the reference set. Using the combined tissue-specific gene set, we estimated the tissue heterogeneity of each skeletal muscle biopsy sample. In our samples, we estimatedo0.1% adiposecontamination, 9–27% WBC, 0–18% lymphocyte and 64–86% skeletal muscle across samples.
To adjust for the effects of non-muscle tissue, we included the estimated percentages of WBCs and lymph as additional covariates in our trait and quantitative trait-expression analysis. We ran GO term analysis and compared the results with those obtained without adjustment (Supplementary Fig. 2).
GO term enrichment analysis
.
For each trait, we performed GO term enrichment analysis using RNA-Enrich6. For each trait, we definePas the signed-log10 (trait–gene expressionPvalue), signed as ‘þ’ for trait–gene expression association in which higher values of gene expression are associated with T2D, and ‘’ for lower gene expression associated with T2D. We used the logistic regression modellogitðpjÞ ¼aþbPjþgLj ð3Þ
wherepjis the probability of GO term membership for genej,ais the intercept,b
is the regression coefficient for association of GO term membership withP, the signed –log10(Pvalue), andgis the regression coefficient for the GO term membership withL, the log10(gene length). We includeLin the model to account for the potential confounding effect of gene length on the enrichment test; longer genes tend to have higher power for expression–trait association, and many GO terms contain set of genes that are substantially longer or shorter than average.
To present the GO term results, for each of the 4 traits tested we retained the 20 most statistically significant GO terms in which genes showed positive association with the trait and the 20 most significant GO terms in which genes showed negative association with the trait. Within each trait and direction of association, we ranked the GO terms from 1 (most significant) to 20. We combined the 404¼160 GO terms and assigned the lowest rank when GO terms appeared more than once on the list. We pruned redundant GO terms from the combined lists of GO terms, preferentially retaining GO terms with lower ranks54. We
hierarchically clustered the pruned GO terms based on the regression coefficients (b’s) from equation (2) from the four traits using complete linkage and the Euclidean distance measure in four-dimensional space.
To assess the robustness of our findings, we repeated RNA-Enrich6analysis
using the PEER factor adjusted trait–gene expression association results (see above). Results were very similar.
Sample and genotype QC
.
We extracted DNA from blood. DNA samples were genotyped at the Genetic Resources Core Facility (GRCF) of the Johns Hopkins Institute of Genetic Medicine on the HumanOmni2.5-4v1_H BeadChip array (Illumina, San Diego, CA, USA). We mapped the Illumina array probe sequences to the hg19 genome assembly using the Burrows-Wheeler Aligner (BWA)55. We excluded SNPs with probe alignment problems, known variants in the 30end ofprobes, call rateso95%, minor allele count (MAC)o1 or Hardy–Weinberg equilibriumPvalueo106, leaving 1,642,012 SNPs for subsequent analysis. All alleles were oriented relative to the reference.
Of the 271 individuals that passed RNA-seq QC, we genotyped 267 samples, of which all were successful, with minimum call rate498.7%. Based on 10 duplicate samples (from a larger set of genotyped samples), overall genotype concordance was 99.993%. We identified two unexpected pairs of first-degree relatives using KING (http://people.virginia.edu/Bwc9c/KING/). Each was an NGT-IGT pair; from each pair we excluded the NGT participant. We performed principal components analysis using SMARTPCA56on 156,416 SNPs with MAF45% and in near linkage equilibrium (r2o0.2), after excluding SNPs from regions of high LD57.
No population outliers were identified.
Imputation
.
We performed SNP imputation using a two-step strategy58. As reference panel we used the haplotypes from 2,737 European individuals sequenced in the GoT2D project. To improve phasing quality given the small target sample set, we pre-phased our 267 individuals together with the GoT2D reference panel samples using ShapeIT version 2 (https://mathgen.stats.ox.ac.uk/genetics_software/ shapeit/shapeit.html). We then imputed genotypes with Minimac2 (ref. 59). For chromosome X, we performed pre-phasing and imputation separately for the pseudo-autosomal and non-pseudo-autosomal regions. For cis-eQTL analysis, we included 8,406,237 variants with imputation qualityr240.3 and MAC45.cis-eQTL analysis
.
We performed cis expression quantitative trait (eQTL) analysis of SNPs within 1 Mb of the most upstream TSS of each gene using Matrix eQTL60,separately at the levels of gene, exon and transcript isoforms. To generate the gene expression valueYij, we (1) inverse normalized FPKMji(2) performed factor
analysis via PEER on the inverse normalized FPKM (separately for genes, exons and transcript isoforms; specifying from 1 to 100 factors; and including age, sex, OGTT status, the top 2 genotype-based principal components and experimental batch as covariates in the model, and (3) inverse normalized the resulting residuals. We used the linear regression model with an additive genetic effect
Yij¼aþbjsGisþeij ð4Þ
regression coefficient of the imputed allele count for SNPson transformed gene expressionYij.
We used FDR51to account for multiple testing and considered as significant
associations with FDRr5%.
We present results based on 60 PEER factors since we expect that removing technical and biological variation will increase power to detect cis-eQTLs and we observed very little increase in the number of cis-eQTLs (FDRr5%) for460 factors17(Supplementary Fig. 22).
Comparison to GTEx skeletal musclegenic cis-eQTL results
.
We downloaded the entire set of skeletal muscle SNP–gene association tests (V6) for 361 GTEx skeletal muscle samples5from the GTEx portal (www.gtexportal.org). We called GTEx SNP–gene association tests with FDRr5% as significant. About 95,528,846 SNP–gene pairs (19,038 genes and 6,694,033 SNPs) were tested in common in the 2 studies and had concordant alleles. We oriented the association results in each study to the same effect allele.Genic cis-eQTL for GWAS variants for T2D and related traits
.
We compiled a list of 225 GWAS variants for T2D, fasting glucose, fasting insulin and 2-h glucose, each with and without adjustment for BMI, and for fasting proinsulin, from the NHGRI GWAS catalogue61and carried out manual curation of the literature tocreate a comprehensive list that was up-to-date as of May 2014. We crossed this list of 225 GWAS variants with our list of gene-based cis-eQTL results, resulting in a total of 220 SNPs and 4,545 tested GWAS SNP–gene pairs. To identify GWAS variant cis-eQTLs that are likely independent of other stronger cis-cis-eQTLs for the same gene, and to calculate a conditional-analysis-based FDR, we performed iterative conditional analysis on each of the 4,545 SNP–gene pairs. For each such pair, we predictedYij
(as defined for cis-eQTL analysis) starting with the GWAS SNP genotype in the model, and then performed step-wise forward selection of SNPs within 1 Mb of the most upstream TSS, with a stopping threshold of aPvalue of 0.0019 (corresponding to thePvalue threshold for gene-based cis-eQTLs with FDRo5%).
ASE measurements
.
Our goal was to quantify ASE at each protein-coding SNP. Based on the calls from our DNA genotyping and imputation, for each individual we identified all sites at which a SNP in a gencode V19 annotated protein-coding exonic region was called as a heterozygote. At these sites, we quantified the strand-specific read coverage using samtools mpileup (version 0.1.18) to process the aligned RNA-seq read BAM files. We required a minimum mapping quality of 255, minimum base quality of 20 and reads mapped in a proper pair. We excluded reads that failed vendor quality checks or that were not the primary alignment. ASE was defined as the reference allele read count divided by referenceþalternate read count, termed fracRef.ASE filtering to adjust for read mapping bias
.
We implemented multiple fil-tering steps to identify and exclude SNPs susceptible to mapping errors that could bias ASE quantification. To identify SNPs with mapping biases, we simulated reads as previously described9, except we used 101 bp reads, and after mapping the simulated reads excluded SNPs with a total simulated coverage ofo193 and4202. We excluded SNPs based on additional filters. Although mono-allelic expression occurs at some sites, we required representation of both alleles in each SNP per individual by requiring 0.01ofracRefo0.99. In addition, we excluded SNPs in regions blacklisted by the ENCODE Project Consortium62because of poor
mappability or the presence of collapsed repeat regions10. We excluded any SNP within 101 bp of an indel greater than 4 bp or overlapping an indel of any length.
ASE statistical analysis
.
fracRef varies systematically by the reference and alternate allele of the SNP. As previously described9, starting with the filtered SNP list, for each sample, for each SNP reference and alternate allele pair (for example, AG and GA are separate allele pairs), we estimated the expected fracRef. The sample-specific and allele-pair-specific expected fracRef was calculated as the sum of the reference allele counts divided by the sum of the total allele counts across all SNP of a given reference and alternative pair for an individual. To prevent SNPs with high coverage from biasing the estimated fracRef, SNPs with read count coverage in the top 25th percentile were down-sampled to 30coverage and the down-sampled reference allele and total count were used. For each individual and for each SNP, we performed a two-sided binomial test, using the observed sample-specific or allele pair-sample-specific fracRef as the true fracRef under the null hypothesis of no ASE. Of the set of SNPs for each individual, we call ASE significant if the Storey’s FDRq-valuer0.05. The forward and reverse stranded ASE quantifications were combined after filters and before statistical analysis for accurate sample-specific adjusted expectation calculation. To increase power to detect ASE, at each SNP that meets the above thresholds and occured inZ10 samples, we combined the binomial testPvalues using Fisher’s combined probability test.Analysis of muscle-specific expression
.
We used an information theory approach13,14to score genes based on muscle expression level and specificityrelative to the panel of 16 diverse Illumina Human Body Map 2.0 tissues. We first
calculated expression (x) in FPKM values for all Gencode v19 genes across each of the 16 tissues in the Body Map 2.0 data. We calculated the relative expression of each gene (g) in skeletal muscle compared with all 16 tissues (t) asp:
pg;muscle¼xg;muscle=
X16
t¼1
xg;t ð5Þ
We next calculated the entropy for expression of each gene across all 16 tissues asH:
Hg¼
X16
t¼1
pg;tlog2ðpg;tÞ ð6Þ
Following previous studies13,14, we defined muscle tissue expression specificity (Q)
for each gene as:
Qg;muscle¼Hglog2ðpg;muscleÞ ð7Þ To aid in interpretability, we dividedQfor each gene by the maximum observedQ
and subtracted this value from 1 and refer to this new score as the mESI:
mESIg¼1
Qg
Qmax
ð8Þ
mESI scores near zero represent low and/or ubiquitously expressed genes, and scores near 1 represent genes that are highly and specifically expressed in skeletal muscle. We note that although these calculations were performed using expression measured by FPKM, we obtained similar results when using transcripts per million.
Chromatin state analyses
.
We performed read mapping and integrative chro-matin state analyses as in our previous report15. Chromatin states were learned jointly by applying the ChromHMM (version 1.10) hidden Markov model (HMM) algorithm at 200 bp resolution to six data tracks (Input, K27ac, K27me3, K36me3, K4me1, K4me3) from each of the cell or tissue types11. We collected cell or tissue ChIP-seq reads from a diverse set of publically available data11,15,63,64representing 31 cells/tissues. We ran ChromHMM with a range of possible states, and settled on an 11-state model as it accurately captured information from higher state models and provided sufficient resolution to identify biologically meaningful patterns in a reproducible way. This process was similar to our previous analysis15. Todetermine how our learned states relate to previously published states from nine cell types11, we performed enrichment analyses comparing our states with the published states in each cell type (Supplementary Fig. 6). We also performed gene body feature overlaps, and TSS proximity analyses11. This process led to a clear
state assignment (Supplementary Fig. 6), which we used for all subsequent analyses. We measured enrichment of cis-eQTLs at various levels of significance (FDR thresholds of 5, 1 and 0.1%) to overlap chromatin states by retaining the single best (lowestPvalue) cis-eQTL per gene, and using the GREGOR tool12to calculate
enrichment relative to MAF, TSS-distance and number of LD neighbours-matched null SNP sets. The enrichment trends were consistent across the different FDR thresholds, with more stringent sets having slightly more pronounced trends. We report here the results for the FDR¼0.1% set. We used the following GREGOR parameters, which are what was reported in the original publication:r2
threshold¼0.8, LD window size¼1 Mb and minimum neighbour number¼500.
ATAC-seq sample processing
.
ATAC-seq libraries were prepared using a modified protocol based on previous studies20. Frozen human skeletal muscle tissue (Zen-bio, Durham, NC USA) was cut into a 100-mg piece and disrupted using liquid nitrogen and a CellCrusher (Cellcrusher, Cork Ireland). Nuclei were isolated by placing disrupted tissue into ice cold nuclei isolation buffer (NIB) (20 mM Tris-HCl, 50 mM EDTA, 5 mM Spermidine, 0.15 mM Spermine, 0.1% mercaptoethanol, 40% Glycerol, pH 7.5). The solution was then filtered through a Miracloth (Calbiochem, San Diego, CA USA) and centrifuged at 1,100gfor 10 min at 4°C. The resultant nuclei pellet was washed with NIB containing 0.5% Triton-X and RSB buffer (10 mM Tris-HCl, 10 mM NaCl, 3 mM MgCl2, pH 7.4). The nuclei pellet was resuspended in 50ml RSB buffer, and 1:10 (10 mg total tissue) and 1:50 (2 mg total tissue) dilutions were made. The transposition reactions were performed using a homemade Tn5 preparation (courtesy of the Jacob Kitzman laboratory)20. The DNA was then purified using the Qiagen MinElute PCR Purification kit (cat. No. 28004). Next, the libraries were PCR amplified to 9 cycles for the 1:10 dilution and 11 cycles for the 1:50 dilution. A final clean-up was performed with the Qiagen MinElute PCR Purification kit and samples were sent to bioanalyzer for QC.ATAC-seq analyses