Sri Krishna International Research & Educational Consortium http://www.skirec.com
- 27 -
The Journal of Sri Krishna Research & Educational Consortium
ASIA PACIFIC JOURNAL OF RESEARCH
IN BUSINESS MANAGEMENT
Internationally Indexed & Listed Referred e -Journal
A STUDY ON QUALITY OF WORK LIFE IN
THE IT SECTOR
MRS.B.R.CELIA*; MR. M. KARTHICK**
*Assistant Professor, Department of Management Studies, Vel Rangarajan Sakunthala College of Management & Science,
Avadi, Chennai – 62.
**Lecturer, Department of Management Studies, Vel Rangarajan Sakunthala College of Management & Science,
Avadi, Chennai – 62.
ABSTRACT
Human resource is a term with which many organizations describe the combination of traditionally administrative personnel functions with performance, Employee Relations and Resource Planning. The field draws upon concepts developed in Industrial/Organizational.
Modern analysis emphasizes that human beings are not “commodities” or “resources”, but are creative and social beings that make class contributions beyond “labor” to a society and to civilization.
This project is carried out with a view “A study on quality of work life in the IT Sector”. It gives a brief description of the employee’s opinion and satisfaction towards the Quality of Work Life prevailing in the organization. The major idea with which the study is intended is to find the prevailing level of Quality of Work Life in the organization. A sample of 200 employees was selected from various IT companies using stratified random sampling. The data are analyzed & interpreted using following statistical tools, Percentage analysis method, Chi square test, Weighted average method.
The study on the whole reveals the fact that, QWL has a major role to play in the satisfaction, production & retention of employees in their respective organization.
KEYWORDS: opinion, performance, retention, satisfaction.
Sri Krishna International Research & Educational Consortium http://www.skirec.com
- 28 - 1. INTRODUCTION
Human resource is a term with which many organizations describe the combination of traditionally administrative personnel functions with performance, Employee Relations and Resource Planning. The field draws upon concepts developed in Industrial/Organizational. Modern analysis emphasizes that human beings are not “commodities” or “resources”, but are creative and social beings that make class contributions beyond “labor” to a society and to civilization.
2. QUALITY OF WORK LIFE
Quality of Work Life refers to the “Quality of relationship between employees and the total working environment”. Quality of Work Life promotes individual learning and development. It provides individuals with influence and control over what they do it. The primary goal of the quality of work life module was to measure how work experience has changed. Secondary goals include measuring the relationship between job/organization characteristics and worker health and safety and identifying targets and safety preventive interventions.
The essence of employee motivation and effectiveness is the manner in which they managed. A direct relationship exists between effective management (i.e. providing a work environment that simultaneously achieves company goals and employee’s goals) and modern human resource management. Getting high quality job performance from your employees depends on giving employees opportunities for their personal growth, achievement, responsibility, recognition, and reward.
2.1 MEANING
Quality of work Life is “the favorableness or unfavorable of a job environment for people”. The another meaning of Quality of work life is adequate and fair compensation, safe and healthy working conditions, immediate opportunities to use and develop human capacities future opportunities for continued growth and security, constitutionalism in the work organization and the social relevance of work life.
QWL, it seems to focus on 3 district are as under
Good wages and services conditions
Good physical environment
Good motivational factors
2.2 DEFINITION
Sri Krishna International Research & Educational Consortium http://www.skirec.com
- 29 - 2.3 PRINCIPLES OF QWL
Employees must take responsibility for their own work/ life balance needs.
Work/life balance should have a positive impact on all activity.
Quality of output is more important than the amount of activity.
Teams are flexible when balancing working & personal needs.
Employees are treated as individuals.
Ongoing performance and contribute are a perquisite.
Achieving work/life balance is hard work & ongoing.
2.4 ELEMENTS OF QUALITY OF WORK LIFE
Ask the heads of operating & staff to develop strategies for continuously communicating with their employees.
Accurate and timely information about vision, mission, strategic goals and objectives and proposed changes.
Essential information repeatedly through multiple channels.
Opportunities for two way communication with employees.
Minimize the risk of involuntary separations.
Strength at work & family programs.
Increase our investment work place learning as a first step in creation of a learning organization.
Better program and management.
2.5 BENEFITS OF QWL
More positive feeling toward one’s self
More positive feeling towards the organization
Improved physical and psychological health
Decreased absenteeism and turnover and fewer accidents
Sri Krishna International Research & Educational Consortium http://www.skirec.com
- 30 - 3. NEED FOR THE STUDY
Extracting High performance from the employees of an organization solely deals with their satisfaction of the employees on the work and work related environment. This in a nutshell could be termed as The Quality of Work Life. A study on the quality of work life mainly in the IT sector would throw light on the basic amenities available and required by the software professionals, who are the major contributors to the nation’s income. A betterment of the factor would at large benefit not only the IT Sector but also the nation at large. Hence a study on the quality of work life of the IT professionals was initialized due to it’s prime importance and the need of the hour.
4. RESEARCH METHODOLOGY
This descriptive study on the Quality of Work Life of IT Professionals was carried out with the objective of analyzing the determinants of the Quality of Work Life and trace out their level of satisfaction on these factors. The study also enables us to know if there is any difference gender wise, age wise and experience wise on their satisfaction on the various factors related to Quality of Work Life. The Study was conducted with a structured questionnaire. 200 IT professionals were selected on a random basis from various IT companies in Chennai. The data collected were analysed using simple percentage, Weighted Average and one way Anova.
5. DATA ANALYSIS AND INTERPRETATION
5.1 PERCENTAGE ANALYSIS
Percentage analysis has been done with the aim of analyzing the demographic factors of the respondents such as Gender, Age and Experience of the employees.
TABLE NO 1 DEMOGRAPHIC FACTORS OF THE RESPONDENTS
GENDER OF RESPONDENTS
Decription Percentage (%)
Male 56
Female 44
AGE OF RESPONDENTS
Decription Percentage (%)
21 - 30 47
31 - 40 42
Sri Krishna International Research & Educational Consortium http://www.skirec.com
- 31 -
Above 50 0
EXPERIENCE OF RESPONDENTS
Decription Percentage (%)
0 to 5 37
5 to 10 45
10 to 15 18
15 to 20 0
Source: Survey Data
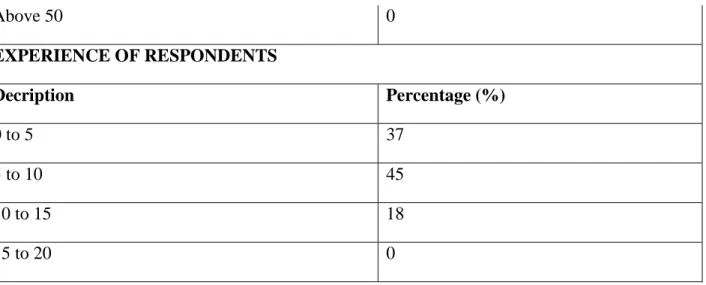
The above table denotes that 56 per cent of the respondents surveyed were males and 44 per cent of the respondents were Females. Further the survey has also thrown light on the fact that most of the respondents belong to the age group of 21 – 30 and 31 – 40. Regarding the experience of the IT Professionals 37 percent of them belong to the group of 0 to 5, 45 per cent of them have an experience of 5 to 10 years, for 18 per cent of the respondents their experience ranges from 10 to 15 years.
5.2 WEIGHTED AVERAGE
This tool has been used to find out the factors of quality of work life in which the employees have high satisfaction and identify those factors where their satisfaction level is low.
TABLE NO. 2 WEIGHTED AVERAGE OF THE FACTORS DETERMINING THE QUALITY OF WORK LIFE
Description SA A N D SD Wt Avg
Worker Participation 85 92 6 86 15 18.93
Working Conditions 130 236 6 14 6 26.13
Hours Of work 15 24 6 146 16 13.80
Welfare Measures 110 124 3 72 10 21.27
Job Security 65 68 9 116 9 17.80
Salary and rewards 95 104 9 88 8 20.27
Sri Krishna International Research & Educational Consortium http://www.skirec.com
- 32 -
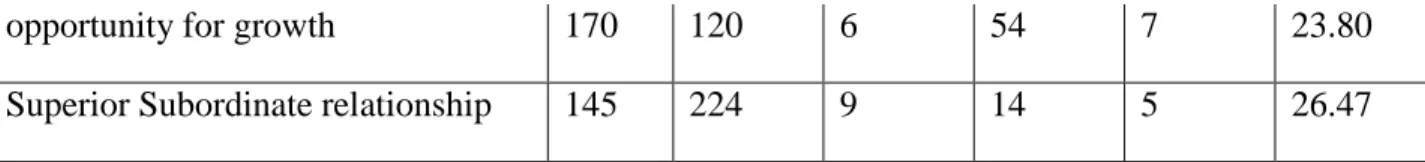
opportunity for growth 170 120 6 54 7 23.80
Superior Subordinate relationship 145 224 9 14 5 26.47
Source: Survey Data
The weighted average of the factors that determine the quality of work life faced by the employees reveal the fact that the employees are least satisfied with the hours of work followed by job security and worker participation. The IT professionals also have a lower level of satisfaction on the salary and rewards given and the welfare measures provided by the IT companies. Their level of satisfaction is the highest in their superior subordinate relationship and working conditions. This analysis has proved that the hours of work, job security and worker participation need to be given due consideration to improve the employees level of satisfaction on these factors.
5.3 ONE WAY ANALYSIS OF VARIANCE.
The Analysis of variance has been made to discover if there is any difference among the various demographic factors on their level of satisfaction on the factors determining the Quality of Work life.
TABLE NO 3 GENDER WISE DIFFERENCES ON THEIR LEVEL OF SATISFACTION ON THE FACTORS DETERMINING QUALITY OF WORK LIFE
Factors CV TV Implication
Worker Participation 0.31 7.71 Ho accepted
Working Conditions 2.46 7.71 Ho accepted
Hours Of work 1.94 7.71 Ho accepted
Welfare Measures 0.53 7.71 Ho accepted
job Security 5.11 7.71 Ho accepted
salary and rewards 8.93 7.71 Ho rejected
skill development 8.55 7.71 Ho rejected
opportunity for growth 8.02 7.71 Ho rejected
supperior Subordinate relationship 3.94 7.71 Ho accepted
Source: Survey data
Sri Krishna International Research & Educational Consortium http://www.skirec.com
- 33 - the various factors determining the Quality of Work Life. The one way ANOVA on gender wise difference, on the level satisfaction of employees on the various factors determining the quality of work life has denoted that there is a difference of opinion gender wise on the factors of salary and rewards, skill development and opportunity for growth. The level of satisfaction of the employees, on the other factors, gender wise, are the same.
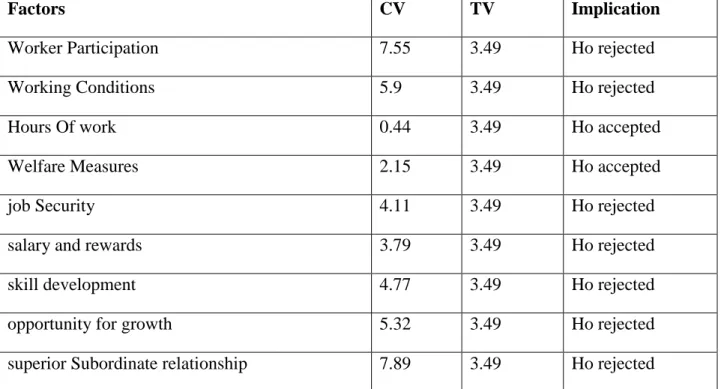
TABLE NO 4 EXPERIENCE WISE DIFFERENCES ON THEIR LEVEL OF SATISFACTION ON THE FACTORS DETERMINING QUALITY OF WORK LIFE
Factors CV TV Implication
Worker Participation 7.55 3.49 Ho rejected
Working Conditions 5.9 3.49 Ho rejected
Hours Of work 0.44 3.49 Ho accepted
Welfare Measures 2.15 3.49 Ho accepted
job Security 4.11 3.49 Ho rejected
salary and rewards 3.79 3.49 Ho rejected
skill development 4.77 3.49 Ho rejected
opportunity for growth 5.32 3.49 Ho rejected
superior Subordinate relationship 7.89 3.49 Ho rejected
Source: Survey data
Sri Krishna International Research & Educational Consortium http://www.skirec.com
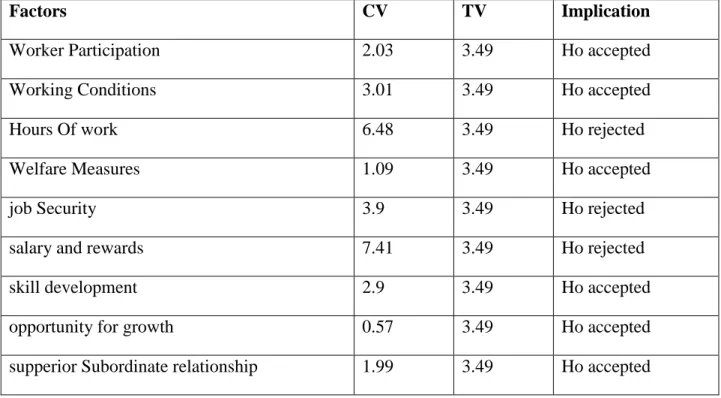
- 34 - TABLE NO 5 AGE WISE DIFFERENCES ON THEIR LEVEL OF SATISFACTION ON
THE FACTORS DETERMINING QUALITY OF WORK LIFE
Factors CV TV Implication
Worker Participation 2.03 3.49 Ho accepted
Working Conditions 3.01 3.49 Ho accepted
Hours Of work 6.48 3.49 Ho rejected
Welfare Measures 1.09 3.49 Ho accepted
job Security 3.9 3.49 Ho rejected
salary and rewards 7.41 3.49 Ho rejected
skill development 2.9 3.49 Ho accepted
opportunity for growth 0.57 3.49 Ho accepted
supperior Subordinate relationship 1.99 3.49 Ho accepted
Source: Survey data
Table no 5 is an analysis to find out if there are any age wise differences in their level of satisfaction on the factors determining the Quality of Work Life. The analysis has revealed that the employees of different age group have a difference of opinion on the hours of work, Job security and salary and rewards. The employees of different age have the same level of satisfaction on the other factors mentioned in the table above.
6. FINDINGS AND SUGGESTIONS
The study reveals that 56 per cent of the respondents surveyed were males and 44 per cent of the respondents were Females. Further the survey has also thrown light on the fact that most of the respondents belong to the age group of 21 – 30 and 31 – 40. Regarding the experience of the IT Professionals 37 percent of them belong to the group of 0 to 5, 45 per cent of them have an experience of 5 to 10 years, for 18 per cent of the respondents their experience ranges from 10 to 15 years. It throws light on the fact that the employees are least satisfied with the hours of work followed by Job security and worker satisfaction.
Sri Krishna International Research & Educational Consortium http://www.skirec.com
- 35 - different age group have a difference of opinion on the hours of work, Job security and salary and rewards.
As the IT Professionals are not happy with hours of work extracted from them. This factor could be given due consideration by the IT companies thus relaxing the hours of work and making them feel at ease and would benefit the organization by enhanced productivity. This could also help in reducing health problems and absenteeism. The employees would work with commitment when they feel secure in their job. This would benefit the organization and economy at large. The company should also indulge in the practice of making workers participate in all important issues and decision making done in the organization.
7. CONCLUSION
The IT sector which is the prime source of revenue to the economy is to be nurtured with utmost care. This could generate even more revenue in the coming future only if the employees in these organizations work together with commitment. This sense of dedication and loyalty would be possible only if the quality of work life in these organizations is satisfactory. The IT companies should provide a conducive environment for the IT professionals to work in. The quality of work life in the organizations helps the employees to contribute their best to the company benefiting the nation at large.
8. REFERENCES
Mamoria, C.B. and Gankar, S.V. (2001) “Personnel Management text and cases” 21st
ed… .Himalaya Publishing House Mumbai
Kothari, C.R. (2001) “ Research methodology” Vishwa Prakashan publishing,
Cook. Hunker Coffey (1997) “Organisation Behaviour” 2nd
ed… Sulthan Chand and sons, New Delhi, , pg 132 – 141.
K. Aswathappa (1997) “Human resources and personnel Management” Tata Mc Graw Hill publishing company limited, New Delhi.
Tripathi, P.C. “ Human Resource Development” Sulthan Chand and sons, 2010 edition New Delhi, , pg 417 – 419.
Subba Rao, P. “ Essentials of Human Resource Management and Industrial Relations Text cases and Games” 2006 edition Himalaya Publishing House, pg 657 – 660
Pillai, R.S.N. and Bhagavathi, V. (1998) “Statistics” 2nd