R E S E A R C H A R T I C L E
Open Access
Development the Care Evaluation Scale
Version 2.0: a modified version of a
measure for bereaved family members to
evaluate the structure and process of
palliative care for cancer patient
Mitsunori Miyashita
1*, Maho Aoyama
1, Misato Nakahata
1, Yuji Yamada
2, Mutsumi Abe
3, Kazuhiro Yanagihara
4,
Akemi Shirado
5, Mariko Shutoh
6,7, Yoshiaki Okamoto
8, Jun Hamano
9, Aoi Miyamoto
1, Saki Yoshida
1, Kazuki Sato
1,
Kei Hirai
10and Tatsuya Morita
11Abstract
Background:The Care Evaluation Scale (CES1.0) was designed to allow bereaved family members to evaluate the
structure and process of care, but has been associated with a high frequency of misresponses. The objective of this study was to develop a modified version of CES1.0 (CES2.0) that would eliminate misresponses while maintaining good reliability and validity.
Methods:We conducted a cross-sectional questionnaire survey by mail in October 2013. The participants were bereaved family members of patients who died from cancer in seven institutions in Japan. All family members were asked to complete CES2.0, the short form CES1.0, items on overall care satisfaction, the Family Satisfaction with Advanced Cancer Care (FAMCARE) Scale, the Patient Health Questionnaire-9 (PHQ-9) and the Brief Grief Questionnaire (BGQ). To examine test-retest reliability, all participants were asked to complete a second CES2.0.
Results:Of 596 questionnaires sent, 461 (77%) were returned and 393 (66%) were analyzed. In the short form CES1.0, 17.1% of the responses were identified as misresponses. No misresponses were found in CES2.0. We identified 10 CES2.0 subscales similar to those in CES1.0 using exploratory factor analysis. Cronbach’s alpha was 0.96, and the intraclass correlation coefficient was 0.83. Correlations were found between CES2.0 and overall satisfaction (r= 0.83) and FAMCARE (r= 0.58). In addition, total CES2.0 scores were negatively correlated with the PHQ-9 (r=−0.22) and BGQ (r=−0.10).
Conclusion:These results suggest that CES2.0 eliminated misresponses associated with CES1.0 while maintaining
good reliability and validity and greatly improving test-retest reliability.
Keywords:Palliative care, Quality of care, Neoplasms, Questionnaires, Bereavement
* Correspondence:[email protected]
1Department of Palliative Nursing, Health Sciences, Tohoku University
Graduate School of Medicine, 2-1 Seiryo-machi, Aoba-ku 980-8575, Sendai, Japan
Full list of author information is available at the end of the article
© The Author(s). 2017Open AccessThis article is distributed under the terms of the Creative Commons Attribution 4.0
Background
The way in which the quality of medical care is mea-sured is an essential part of accurate quality assurance. In palliative care, in addition to the difficulties associated with prognostication, patients are frequently too ill to complete questionnaire surveys or take part in inter-views. Therefore, it is common to have bereaved family
members evaluate the provision of care at the patients’
end-of life [1].
Donabedian [2] stated that quality of care consists of the following three components: 1) structure of care; 2) process of care; and 3) outcome of care. Although numerous measures have been developed to evaluate the outcomes of palliative care, such as quality of the dying
process [3–7], few measures have been developed to
evaluate the structure and process of care [3]. One of these measures is the Care Evaluation Scale (CES), which was developed in 2004 to evaluate the palliative care structure and process [8]. The CES has been used in a number of nationwide surveys and clinical audits by
institutions in Japan [9–11].
To measure the structure and process of care as expe-rienced by bereaved family members, the original CES (CES1.0) consists of 28 items with the following 10 sub-scales: physical care by physicians; physical care by nurses; psycho-existential care; help with decision-making for patients; help with decision-decision-making for the family; environment; family burden; cost; availability; and coordination/consistency. In CES1.0, bereaved family members are asked whether improvements are needed in regard to the care provider. This is because when CES1.0 was developed, the provision of care was typically rated using agreement or satisfaction level, but this makes it dif-ficult to interpret whether the respondents actually desire further improvement in this area [8].
However, during data entry, we noticed that the care assessment method used in CES1.0 appeared to result in misresponses by a substantial proportion of the respon-dents. In this article, we define misresponse operationally
that “misresponse occurs when a respondent selects an
option that is inconsistent or incongruent with his or her
corresponding beliefs”. For example, respondents who
described themselves as being “very satisfied” with the
provision of care also responded that “improvement is
highly necessary”. We assume that such respondents
mis-understood “highly necessary” as “the item, for example
physical care by the physician, is very good”. Although this
may be somewhat confusing to English readers, the wording of the item in Japanese was thought to lead to reverse-score errors in the responses if not read care-fully. In Japanese, although the question regarding satis-faction was quite straightforward, the question regarding the necessity of improvement was in the form of a double negative, and therefore somewhat confusing. In fact, we
found that question regarding satisfaction was consistent with the other questions, while the question regarding the necessity of improvement was consistent with those asso-ciated with suspected misresponses. Consequently, we
found a misresponse rate of 5–10% (unpublished data).
Therefore, we referred to the overall satisfaction question in previous studies and manually corrected the inverse
responses to reflect the inverse score [9–11]. However,
this was not only time consuming, but also insufficient,
because categorizing respondents who answer“somewhat
satisfied” for the overall satisfaction question as satisfied
or unsatisfied, which would be necessary to correct such CES1.0 responses, was not feasible. Alternatively, we hypothesized that we could eliminate misresponses by improving the language of the response options on the questionnaire. Therefore, the objective of this study was to develop a modified version of CES1.0 (CES2.0) that would allow the quality, structure, and process of palliative care to be evaluated more accurately while maintaining good reliability and validity.
Methods
Participants and procedures
We conducted a cross-sectional questionnaire survey by mail in October 2013. The potential participants were bereaved family members of 100 consecutive patients who died in four inpatient palliative care units, two home hospices, and a general hospital ward before May 31, 2013. Patients who died before 2012 were not included because a similar bereavement study in a pallia-tive care unit was conducted in 2013. The inclusion cri-teria were as follows: 1) the patient died from cancer; and 2) the patient and bereaved were at least 20 years of age. The exclusion criteria were as follows: 1) the responsible family member or guarantor could not be identified; 2) treatment-related death or death in the intensive care unit; 3) the bereaved had psychological distress at level that kept them from participating in the study as determined by the primary physician; and 4) the bereaved was incapable of completing the question-naire due to cognitive dysfunction or the inability to read Japanese. We estimated that a sample size of 200 would be required based on exploratory factor analysis, convergent validity, and test-retest reliability [12].
not sent to such responders. To examine the test-retest reliability of CES2.0, a retest questionnaire was sent to all respondents 2 weeks after they returned the first question-naire. In Japan, written informed consent is not required for anonymous questionnaire surveys. Potential partici-pants were informed about the details of the survey, and completing and returning a questionnaire was regarded as voluntary consent to participate.
This study was approved by the institutional review boards of Tohoku University and all participating insti-tutions and conducted in accordance with the ethical guidelines for epidemiological research issued by the Ministry of Education, Culture, Sports, Science, and Technology and the Ministry of Health, Labour, and Welfare of Japan.
Measurements
Care Evaluation Scale version 2.0 (CES2.0)
We developed CES2.0 based on modifications from the original CES1.0 for bereaved family members [8]. In CES1.0, participants were asked whether improvements were necessary in relation to the care provider. Because this appeared to be confusing for the participants, we changed the response option to a 6-point Likert scale (6: highly agree; 5: agree; 4: somewhat agree; 3: somewhat disagree; 2: disagree; 1: highly disagree). We also asked
participants to select“7: N/A”if none of the other scores
were applicable to the patient.
CES1.0 consisted of 28 items with 10 subscales. We modified the expression of each item to match the new response options without changing the underlying
con-cept of each subscale. For example, the statement “The
same doctors and nurses provided care” in CES1.0 was
changed to “Important information was shared even
when the attending physician or nurse was changed” in
CES2.0. To allow easy interpretation, all scores were proportionally adjusted to range from 0 to 100, similar to CES1.0; higher scores indicated good structure or process of care. We designed this scale to be used not only in inpatient settings, but also in the home.
Short version of the original Care Evaluation Scale (CES1.0)
We used the short version of the original CES1.0 [8], which consists of 10 items and 10 subscales. In the original CES1.0, participants were asked to indicate if improve-ments were necessary using the following 6-point Likert
scale (“1: improvement is not necessary”;“2: improvement
is little necessary”; “3: improvement is somewhat
neces-sary”; “4: improvement is necessary”; “5: improvement is
quite necessary”; and“6: improvement is highly necessary”).
Overall care satisfaction
Participants were asked about their overall satisfaction
with care using the following question: “Overall, in the
past month, were you satisfied with the medical care the
patient received in the last place of care?” Participants
were asked to respond on a 6-point Likert scale (“1:
highly dissatisfied”to “6: highly satisfied”). This measure
was used in the development of CES1.0 [8] and in a nationwide bereavement study [11].
FAMCARE (Family Satisfaction with Advanced Cancer Care)
We used the FAMCARE Scale to measure family satisfac-tion with advanced cancer care. The original FAMCARE Scale is composed of 20 items that can be rated on a
7-point Likert scale (“7: highly satisfied” to “1: highly
dissatisfied”) [14]. The Japanese version of the FAMCARE
Scale was translated by the forward and backward translation procedure [15].
Expectation of care
Expectation of care before receiving the last place of care was also investigated using a method similar to that for CES2.0. Participants were asked to rate their level of expectation for seven items (physical care by physician; physical care by nurse; psycho-existential care; help with decision-making; environment; family burden; and cost)
on a 3-point Likert scale (“1: not very expected” to “3:
highly expected”) [8].
Patient Health Questionnaire-9 (PHQ-9)
We used the Patient Health Questionnaire-9 (PHQ-9) to measure depression among the participants. The PHQ-9 is a self-administered questionnaire which scores each of the nine Diagnostic and Statistical Manual of Mental
Disorders version IV criteria for depression from “0”
(not at all) to “3” (nearly every day) [16]. We used the
Japanese version of the PHQ-9, which has confirmed validity [17].
Brief Grief Questionnaire
We used the Brief Grief Questionnaire (BGQ) to measure the grief of the participants. The original BGQ was
developed for a study on the 9–11 terrorist attacks in
New York City. It is composed of five items that can be rated on a 3-point Likert scale, and can be easily administered [18]. The validity of the Japanese version of the BGQ was also confirmed in the general Japanese population [19].
Participants’characteristics
Information on the patients’ age, sex, primary cancer
education, medical expenditures during the last month, annual household income during the caregiving period, and feelings regarding the household budget during the caregiving period were collected by questionnaire.
Although CES2.0, overall care satisfaction, and the PHQ-9 were administered to all participants, in con-sideration of the volume of the questionnaire, CES1.0, the FAMCARE Scale, the BGQ and expectation of care were only administered to half of the participants, and the retest questionnaire only consisted of CES2.0.
Analysis
Before analysis, we identified the likely misresponses on CES2.0 and the short version of the CES1.0 by referring to the question on overall satisfaction. We then counted and manually corrected the misresponses. We calculated descriptive statistics and conducted item analysis. We
treated the response “7: N/A” on CES2.0 as a missing
value. To calculate the subscale scores, we imputed mean responses from within each subscale for all missing values. We tested the reliability of the factor structure using the split-half method; we randomly split the data in half and performed exploratory factor analysis on one half, and confirmatory factor analysis on the other half. For internal consistency and test-retest reliability, we
calcu-lated Cronbach’s alpha coefficients and intraclass
cor-relation coefficients (ICC). To examine concurrent and
discriminant validity, we calculated Pearson’s correlation
coefficients between the total score and each subscale score for CES2.0, overall satisfaction, the FAMCARE Scale, expectation of care, the PHQ-9 and the BGQ. In addition, we calculated Pearson's correlation coeffi-cients between CES2.0 and the short version of CES1.0. Finally, we developed a short version of CES2.0 by selecting one item from all subscales. The selection cri-teria were as follows: 1) high correlation with subscale
total score (r> 0.90); and 2) high reliability as a single
item (ICC > 0.60) and low missing rate (<10%). All ana-lyses were performed using the SAS statistical package (version 9.4; SAS Institute, Cary, NC).
Results
Participant characteristics
We identified 692 potential participants in six facilities. Among these, 92 bereaved were excluded for the following reasons: 1) could not identify the responsible family
mem-ber or guarantor (n= 41, 45%); 2) treatment-related death
or death in intensive care unit (n= 8, 9%); 3) serious
psychological distress (n= 23, 25%); 4) incapable of
completing the questionnaire (n= 2, 2%); and 5) other
(n= 14, 15%). A total of 600 questionnaires were mailed,
four of which were returned due to a wrong address. Of 596 questionnaires successfully sent, 461 (77%) responses were received; among these, 68 were refusals to participate
in the study. The reasons for refusal were as follows:“It is
too emotionally burdensome to recall the patient's death”
(n= 33, 49%); “Please leave me in peace” (n= 26, 37%);
“The hospitalized period was too short to evaluate care”
(n= 21, 31%);“I am not good at answering questionnaires”
(n= 13, 19%); and others (multiple answers). Finally, 393
(66%) valid questionnaires were analyzed. To examine test-retest reliability, we sent 393 questionnaires, from which 219 (56%) were returned.
The participants’characteristics are shown in Table 1. The
mean patient age ± standard deviation (SD) was 73 ± 12 years, and males made up 60% of the total. The place of death was as follows: inpatient palliative care units (53%); home (32%); and general hospital ward (15%). The mean duration of stay in the last place of care (hospital or home) was 52 ± 90 days, and time after death was 14 ± 8 months. The mean family age was 61 ± 12 years, and females made up 69% of the total. Spouses comprised 50% and children 35% of the family members. A total of 84 family members attended to the patient 4 days or more per week. No significant differences of characteristics collected for lists were observed between responders and non-responders.
Item analysis and factor validity
In the short version of CES1.0, we found a misresponse rate of 17.1%; in contrast, no misresponses were found on CES2.0. The results of the item analysis with all data, and the factor analysis with one half of the split data are shown in Table 2. We succeeded in re-creating the factor structure of CES1.0, with confirma-tory factor analysis on the other half of the split data
[chi-square = 736.7 (df = 338), P= 0.000; CFI = 0.91,
TLI = 0.90, RMSEA = 0.092, SRMR = 0.067].
Missing values ranged from 1.3% to 10.4%. The ICCs of all but one item were over 0.60 and we retained this item because it was considered indispensable and the ICC was 0.59.
We identified 10 subscales similar to CES1.0 using exploratory factor analysis. The mean ± SD total score on CES2.0 was 81.0 ± 12.4. The CES1.0 short version items are indicated with asterisks in Table 2.
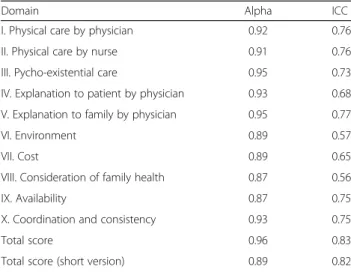
Internal consistency and reliability
Internal consistency (Cronbach’s alpha) and test-retest
reliability (ICC) are shown in Table 3. Cronbach’s alpha
ranged from 0.87 to 0.95 (total score: 0.96; short version: 0.89), and ICC ranged from 0.56 to 0.77 (total score: 0.83; short version 0.82).
Concurrent and discriminant validity
Concurrent and discriminant validity as demonstrated
by Pearson’s correlation coefficient are shown in Table 4.
The CES2.0 total score was correlated with overall
expectation of care (r= 0.02). In addition, the CES2.0 total
score was negatively correlated with the PHQ-9 (r=−0.22)
and the BGQ (r=−0.10). Although these results were
Table 1Participants’characteristics
Number Percent Patient
Age, y, mean ± SD (median, range) 73.2 ± 12.1 (75, 32–101) Sex
Male 235 60
Female 156 40
Primary site
Lung 93 24
Stomach/Esophagus 57 15
Colon/Rectum 51 13
Liver/Gallbladder/Bile duct 36 9
Urinary 33 8
Pancreas 31 8
Uterus/Ovarian 20 5
Leukemia/Malignant lymphoma 15 4
Head and neck 12 3
Breast 8 2
Other 37 9
Place of death
Palliative care unit 208 53
Home 127 32
Hospital general ward 58 15
Hospital or home days, mean ± SD (median, range)
52.2 ± 90.0 (27, 0–1040)
Months after death, mean ± SD (median, range)
14.2 ± 7.6 (12.0, 5.0–45.4)
Family
Family age, y, mean ± SD (median, range)
61.4 ± 12.1 (62, 27–94)
Family sex
Male 118 30
Female 273 69
Relationship to decedent
Spouse 198 50
Child 138 35
Child-in-law 30 8
Parent 16 4
Sibling 6 2
Other 4 1
Physical health status during the caregiving period
Good 113 29
Moderate 197 50
Fair 58 15
Bad 15 4
Table 1Participants’characteristics(Continued)
Mental health status during the caregiving period
Good 61 16
Moderate 179 46
Fair 115 29
Bad 28 7
Frequency of attending to the patient
Every day 285 73
4–6 days/week 45 11
1–3 days/week 37 9
less than 1 day/week 21 5
Presence of other caregivers
Present 282 72
Absent 105 27
Education
Junior high school or less 33 8
High school 183 47
College 103 26
University/Graduate school 63 16
Other 5 1
Medical expenditure during the last month (thousand yen)a
≤99 104 26
100–199 121 31
200–399 100 25
400–599 33 8
≥600 16 4
Household annual income during the caregiving period (thousand yen)
≤999 27 7
1000–1999 74 19
2000–3999 136 35
4000–5999 68 17
6000–7999 40 10
≥8000 31 8
Feelings regarding the household budget during the caregiving period
Difficult 26 7
Somewhat difficult 58 15
No problem 206 52
Somewhat affluent 60 15
Affluent 38 10
Some totals are not 100% due to missing values a
similar to those found using the short version of CES1.0, CES2.0 was more strongly correlated with overall
satisfac-tion (r= 0.71) and FAMCARE (r= 0.53).
Correlation between CES2.0 and CES1.0
We added correlation between CES2.0 and CES1.0 in Table 4. The correlation coefficient between CES2.0 and CES1.0 total scores was 0.78 and that between the corre-sponding subscales ranged from 0.56 to 0.71. In addition, as more comparable case, the correlation coef-ficient of CES2.0 total score of short version and CES1.0 was 0.79 and that between the corresponding items ranged from 0.53 to 0.67.
Discussion
CES2.0 was shown to have good reliability and validity. The most important result was that the misresponse rate was 0% in CES2.0, in contrast to 17% in CES1.0. In Table 3Internal consistency and reliability
Domain Alpha ICC
I. Physical care by physician 0.92 0.76 II. Physical care by nurse 0.91 0.76 III. Pycho-existential care 0.95 0.73 IV. Explanation to patient by physician 0.93 0.68 V. Explanation to family by physician 0.95 0.77
VI. Environment 0.89 0.57
VII. Cost 0.89 0.65
VIII. Consideration of family health 0.87 0.56
IX. Availability 0.87 0.75
X. Coordination and consistency 0.93 0.75
Total score 0.96 0.83
Total score (short version) 0.89 0.82
alpha: Cronbach’s alpha coefficient ICC: Intraclass correlation coefficient
Table 4Concurrent/discriminant validity of CES2.0 and the short version of CES1.0
CES2.0
Domain Overall satisfaction FAMCARE Expectation PHQ-9 BGQ CES1.0
(domain)a CES1.0(item)b
I. Physical care by physician 0.70 0.50 0.05 −0.21 −0.06 0.59 0.53
II. Physical care by nurse 0.69 0.44 0.09 −0.18 −0.08 0.68 0.62
III. Pycho-existential care 0.70 0.44 0.01 −0.15 −0.06 0.71 0.67
IV. Physician’s explanation to the patient 0.64 0.50 −0.07 −0.18 0.01 0.66 0.63 V. Physician’s explanation to the family 0.67 0.53 0.04 −0.22 −0.02 0.68 0.65
VI. Environment 0.46 0.29 0.02 −0.15 −0.10 0.63 0.66
VII. Cost 0.62 0.47 −0.01 −0.15 −0.21 0.55 0.57
VIII. Consideration of family health 0.46 0.30 0.17 −0.15 −0.09 0.56 0.55
IX. Availability 0.54 0.45 −0.01 −0.13 −0.04 0.62 0.68
X. Coordination and consistency 0.79 0.51 −0.05 −0.16 −0.20 0.68 0.64
Total score 0.83 0.58 0.02 −0.22 −0.10 0.78
-Total score(short version) 0.82 0.59 0.02 −0.20 −0.12 0.79
-Short version of the CES1.0
I. Physical care by physician 0.63 0.50 0.02 −0.17 - -
-II. Physical care by nurse 0.63 0.41 0.00 −0.21 - -
-III. Pycho-existential care 0.59 0.44 0.00 −0.16 - -
-IV. Physician’s explanation to the patient 0.55 0.47 −0.07 −0.20 - - -V. Physician’s explanation to the family 0.54 0.51 −0.09 −0.20 - -
-VI. Environment 0.54 0.30 −0.11 −0.25 - -
-VII. Cost 0.49 0.33 −0.01 −0.22 - -
-VIII. Consideration of family health 0.57 0.37 0.03 −0.18 - -
-IX. Availability 0.47 0.42 −0.03 −0.08 - -
-X. Coordination and consistency 0.61 0.45 −0.02 −0.21 - -
-Total score 0.71 0.53 −0.04 −0.24 - -
-Values indicate Pearson correlation coefficients. We could not analyze correlation of BGQ and CES1.0 because of combination of questionnaire PHQ-9: Patient Health Questionnaire. BGQ: Brief Grief Questionnaire
a
Correlation coefficient between domain of CES2.0 and corresponding item of short version of the CES1.0 b
addition, no decrease in validity was seen in CES2.0 compared with CES1.0, and test-retest reliability was greatly improved.
Regarding the misresponse rate, in this study, 17% of the respondents incorrectly responded to items on the short version of CES1.0. This rate was higher than that
found in our past experiences (from 5–10%). The
respondents might have been less careful in answering items on CES1.0 in this study than in previous studies because they were asked to complete similar question-naires (CES2.0 and CES1.0), and CES1.0 was adminis-tered after the other measures.
The test-retest reliability of CES2.0 was high (total
score: ρ= 0.83). In another study involving CES1.0, the
test-retest reliability was reported as 0.57 [8]. We believe that this improved reliability can be explained as follows. First, CES2.0 was easier to understand that CES1.0 and no misresponses were identified. Second, the test-retest interval of the previous study was 6 months [8], which was much longer than that used in this study. In developing CES2.0, several expressions for questionnaire items were modified to be easier to answer without altering the con-cept of the subscale. Therefore, respondents could respond to items more accurately.
No other psychometrics of CES2.0 decreased after the modifications from CES1.0. Factor validity, internal consistency, and concurrent/discriminant validity were all good. The correlations between CES2.0 and overall care satisfaction and the FAMCARE Scale were slightly higher than those with CES1.0. This could also be the result of the elimination of misresponses from CES2.0.
In developing CES2.0, we did not adopt satisfaction as a measurement concept because this was often criticized as being insufficiently theorized and having no widely accepted definition [20]. One of the criticisms of the satis-faction measure is the effect of expectation of care in
studies in Australia and the US [21–23]. In this study,
CES2.0 was not correlated with expectation of care, and slightly correlated with depression among the bereaved. This slight correlation is consistent with that observed with CES1.0 in this study, the original CES1.0 study, and other previous studies [8, 24]. It is therefore diffi-cult to make a causal inference between depression and satisfaction because lower satisfaction of care might lead to depression in bereaved family members [25]. In this study, because only a slight correlation was observed between CES2.0 and depression or grief, this was not thought to have had a large effect on the per-ception of quality of care among the bereaved.
This study did have several limitations. First, as described in the Analysis section, misresponses were checked manually, which is an imperfect procedure. It is possible that some misresponses may have gone undetected in CES2.0. Second, 85% of the patients
died in inpatient palliative care units or home hos-pices. However, in Japan, the actual proportion of pa-tients who die in these places of care is less than 20%. Therefore, our study sample may not be repre-sentative of the general population. It may be better to use descriptive statistics based on place of care be-cause the quality of care in inpatient palliative care units and home hospices is more highly rated than general hospital wards in Japan [11]. Because of the possibility of a ceiling effect, an additional survey using a more representative sample might be necessary to confirm the factor structure and achieve high conver-gent validity.
Third, the ceiling effect of responses might have resulted in an underestimation of validation data. Fourth, we com-pared CES2.0 to the short version of CES1.0 instead of the long version due to space limitations. A comparison between the CES2.0 and the CES1.0 long forms might provide more accurate results. This is because the space of questionnaire was limited because this survey had sev-eral objectives simultaneously and contained more ques-tions other than development of the CES2.0. Fifth, in this study, we did not conduct cognitive interviews with the participants. Performing cognitive interviews could help provide important respondent feedback on the language, comprehensibility, ambiguity, and relevance of the items. Sixth, due to ethical considerations, bereaved family mem-bers considered to have severe psychological distress as determined by the primary physician were excluded. This might have resulted in a selection bias. Finally, the possi-bility of additional biases, including a recall bias, a cultural bias (this survey was only conducted in a Japanese popula-tion), and a bias in that this scale was only evaluated in relation to cancer patients, cannot be excluded.
Conclusions
The modified CES2.0 demonstrated good reliability and validity. The most important result was that the misresponse rate in CES2.0 was 0%, in contrast to the 17% in CES1.0 found in this study. Second, no other CES2.0 psychometrics decreased after the modifica-tions from CES1.0. Furthermore, test-retest reliability was greatly improved.
Abbreviations
BGQ:Brief Grief Questionnaire; CES: Care Evaluation Scale; FAMCARE: Family Satisfaction with Advanced Cancer Care; ICC: Intraclass correlation coefficient; PHQ-9: Patient Health Questionnaire-9; SD: Standard deviation
Acknowledgements Not Applicable.
Funding
Availability of data and materials
The datasets used and/or analyzed during the current study available from the corresponding author on reasonable request.
Authors’contributions
MM: Principal Investigator, concept and design, analysis and interpretation, drafting manuscript, final approval. MA: Concept and design, survey management, analysis and interpretation, critical revision of the article, final approval. MN: Survey management, analysis and interpretation, final approval. YY: Data collection in a participating institution, final approval. MA: Data collection in a participating institution, final approval. KY: Data collection in a participating institution, final approval. AS: Data collection in a participating institution, final approval. MS: Data collection in a participating institution, final approval. YO: Data collection in a participating institution, final approval. JH: Data collection in a participating institution, final approval. AM: Survey management, final approval. SY: Survey management, final approval. KS: Concept and design, critical revision of the article, final approval. KH: Concept and design, critical revision of the article, final approval. TM: Concept and design, critical revision of the article, final approval.
Competing interests
This study was supported by a grant from the Japan Society for the Promotion of Science (KAKENHI Grant Number: 25293165). The authors declare that they have no competing interests.
Consent for publication Not Applicable.
Ethics approval and consent to participate
This study was approved by the institutional review boards of Tohoku University and all participating institutions and conducted in accordance with the ethical guidelines for epidemiological research issued by the Ministry of Education, Culture, Sports, Science, and Technology and the Ministry of Health, Labour, and Welfare of Japan. We considered returning questionnaire as consent to participate in the research.
Author details
1Department of Palliative Nursing, Health Sciences, Tohoku University
Graduate School of Medicine, 2-1 Seiryo-machi, Aoba-ku 980-8575, Sendai, Japan.2Aiwa Hospital, Nagano, Japan.3Department of Palliative Care and
Pain Clinic, Matsue City Hospital, Matsue, Japan.4Department of Medical Oncology, Kansai Electric Power Hospital, Osaka, Japan.5Department of
Palliative and Supportive Care, Palliative Care Team and Seirei Hospice, Seirei Mikatahara Hospital, Hamamatsu, Japan.6Department of Palliative Medicine,
Oita City Medical Association’s Almeida Memorial Hospital, Oita, Japan.7Wata Clinic, Tokyo, Japan.8Department of Pharmacy, Ashiya Municipal Hospital,
Ashiya, Japan.9Division of Clinical Medicine, Faculty of Medicine, University of Tsukuba, Tsukuba, Japan.10Institute of Academic Initiatives, & Graduate
School of Human Sciences, Osaka University, Osaka, Japan.11Department of Palliative and Supportive Care, Palliative Care Team and Seirei Hospice, Seirei Mikatahara Hospital, Shizuoka, Japan.
Received: 8 February 2016 Accepted: 3 January 2017
References
1. Teno JM. Measuring end-of-life care outcomes retrospectively. Journal of Palliative Medicine. 2005;8 Suppl 1:S42–49.
2. Donabedian A. The quality of care. How can it be assessed? JAMA. 1988;260(12):1743–8.
3. Addington-Hall J, Walker L, Jones C, Karlsen S, McCarthy M. A randomised controlled trial of postal versus interviewer administration of a questionnaire measuring satisfaction with, and use of, services received in the year before death. J Epidemiol Community Health. 1998;52(12):802–7.
4. Teno JM, Clarridge B, Casey V, Edgman-Levitan S, Fowler J. Validation of Toolkit After-Death Bereaved Family Member Interview. J Pain Symptom Manage Sep. 2001;22(3):752–8.
5. Curtis JR, Patrick DL, Engelberg RA, Norris K, Asp C, Byock I. A measure of the quality of dying and death. Initial validation using after-death interviews with family members. J Pain Symptom Manage. 2002;24(1):17–31.
6. Morita T, Chihara S, Kashiwagi T. Quality Audit Committee of the Japanese Association of Hospice and Palliative Care U. A scale to measure satisfaction of bereaved family receiving inpatient palliative care. Palliat Med Mar. 2002;16(2):141–50.
7. Miyashita M, Morita T, Sato K, et al. Good death inventory: a measure for evaluating good death from the bereaved family member’s perspective. J Pain Symptom Manage May. 2008;35(5):486–98.
8. Morita T, Hirai K, Sakaguchi Y, et al. Measuring the quality of structure and process in end-of-life care from the bereaved family perspective. J Pain Symptom Manage Jun. 2004;27(6):492–501.
9. Miyashita M, Morita T, Hirai K, Miyashita M, Morita T, Hirai K. Evaluation of end-of-life cancer care from the perspective of bereaved family members: the Japanese experience. J Clin Oncol. 2008;26(23):3845–52.
10. Morita T, Miyashita M, Yamagishi A, et al. Effects of a programme of interventions on regional comprehensive palliative care for patients with cancer: a mixed-methods study. Lancet Oncol. 2013;14(7):638–46. 11. Miyashita M, Morita T, Sato K, Tsuneto S, Shima Y. A Nationwide Survey of
Quality of End-of-Life Cancer Care in Designated Cancer Centers, Inpatient Palliative Care Units, and Home Hospices in Japan: The J-HOPE Study. J Pain Symptom Manage. 2015;50(1):38–47. e33.
12. MacCallum R, Widaman K, Zhang S, Hong S. Sample size in factor analysis. Psychological Methods. 1999;4:84–99.
13. Miyashita M, Wada M, Morita T, et al. Care evaluation scale-patient version: measuring the quality of the structure and process of palliative care from the patient’s perspective. J Pain Symptom Manage Jul. 2014;48(1):110–8. 14. Kristjanson LJ. Validity and reliability testing of the FAMCARE Scale: measuring
family satisfaction with advanced cancer care. Soc Sci Med. 1993;36(5):693–701. 15. Saito S, Shimizuma K. Development of an effective home palliative care
system adopting a multidisciplinaryteam approach - satisfaction of the patients’family for the domicilliary palliative care“Okayama”model. Value in Health. 2008;10(6):A488.
16. Kroenke K, Spitzer RL, Williams JB. The PHQ-9: validity of a brief depression severity measure. J Gen Intern Med. 2001;16(9):606–13.
17. Muramatsu K, Miyaoka H, Kamijima K, et al. The patient health
questionnaire, Japanese version: validity according to the mini-international neuropsychiatric interview-plus. Psychol Rep. 2007;101(3 Pt 1):952–60. 18. Shear KM, Jackson CT, Essock SM, Donahue SA, Felton CJ. Screening for
complicated grief among Project Liberty service recipients 18 months after September 11, 2001. Psychiatr Serv. 2006;57(9):1291–7.
19. Ito M, Nakajima S, Fujisawa D, et al. Brief measure for screening complicated grief: reliability and discriminant validity. PLoS ONE. 2012;7(2):e31209. 20. Aspinal F, Addington-Hall J, Hughes R, Higginson IJ. Using satisfaction to
measure the quality of palliative care: a review of the literature. J Adv Nurs. 2003;42(4):324–39.
21. Linder-Pelz S. Social psychological determinants of patient satisfaction: a test of five hypothesis. Soc Sci Med. 1982;16(5):583–9.
22. Medigovich K, Porock D, Kristjanson LJ, Smith M. Predictors of family satisfaction with an Australian palliative home care service: a test of discrepancy theory. J Palliat Care. 1999;15(4):48–56.
23. Jackson JL, Chamberlin J, Kroenke K. Predictors of patient satisfaction. Soc Sci Med. 2001;52(4):609–20.
24. Fakhoury W, McCarthy M, Addington-Hall J. Determinants of informal caregivers’satisfaction with services for dying cancer patients. Soc Sci Med. 1996;42(5):721–31.