www.jyoungpharm.org | www.phcog.net
A Simple HPLC-MS/MS Method for Quantification of Naltrexone
and 6-beta Naltrexol: An Application to Effect of Uremic Toxins
on Metabolic Reduction
Osama Yousef Alshogran1,*, Aref Louai Zayed2
1Department of Clinical Pharmacy, Faculty of Pharmacy, Jordan University of Science and Technology, Irbid, JORDAN.
2Department of Medicinal Chemistry and Pharmacognosy, Faculty of Pharmacy, Jordan University of Science and Technology, Irbid, JORDAN.
ABSTRACT
Objective: This study aimed to 1) develop and validate a simple, accurate and reproducible high-performance liquid chromatography–tandem mass spectrometry method for determination and quantification of naltrexone and its reduced metabolite (6-beta naltrexol); 2) assess the effect of uremic toxins on metabolic reduction. Methods: Sample preparation was conduct-ed through liquid-liquid extraction of analytes spikconduct-ed in 10 mM Tris-HCl in-cubation buffer (pH 7.4) using methyl tert-butyl ether. The chromatographic separation of analytes was achieved using Inert Sustain C18 (2.1 x 50 mm, 5
µm) analytical column under isocratic elution of solvent A (water containing 0.1% formic acid) and solvent B (methanol containing 0.1% formic acid) over a run time of 5 min. The analytes were detected by multiple reaction monitoring with electrospray ionization in the positive mode. Results: Ex-cellent linearity was observed for all analytes over the concentration ranges of 100-8,000 ng/mL for naltrexone and 10-800 ng/mL for 6-beta naltrexol. The intra- and inter-day accuracy and precision for analytes were within ±15.0%. The method is accurate and precise and novel in its application
to in vitro experiments assessing the effect of uremic toxins on metabolic reduction of naltrexone, which showed that indoxyl sulfate (100 µM) is a significant inhibitor of naltrexone reduction. Conclusion: The developed method is reproducible and accurate and well suited for conducting en-zyme kinetic studies assessing metabolic reduction.
Key words: Naltrexone, 6-beta naltrexol, Reduction, LC-MS, Enzyme kinetics, Uremic toxins.
Correspondence
Dr. Osama Yousef Alshogran,
Assistant Professor, Department of Clinical Pharmacy, Faculty of Pharmacy, Jor-dan University of Science and Technology, Irbid- 22110, JORDAN.
Phone: +96227201000
Email: [email protected]
DOI: 10.5530/jyp.2019.11.53
This is an open access article distributed under the terms of the Creative Commons Attribution-NonCommercial-ShareAlike 4.0 License, which allows others to remix, tweak, and build upon the work non-commercially, as long as the author is credited and the new creations are licensed under the identical terms.
INTRODUCTION
Naltrexone is an opioid antagonist used in the treatment of opiate depen-dence and alcoholism.1 It works by binding and inhibiting of beta opioid
receptors located in brain. Naltrexone is a highly metabolized drug that undergoes hepatic reduction at the carbonyl moiety to produce primar-ily 6-beta naltrexol metabolite.2,3 Naltrexone reduction is principally
mediated by hepatic Aldo-keto Reductase (AKR) isoforms located in cytosol.3-5 While the 6-alpha metabolite has not been recognized in hu
mans, the beta isoform is pharmacologically active and inhibits opioid receptors to levels lower than that of the parent drug. Additionally, the plasma half-life of 6-beta naltrexol is longer than that of naltrexone and it is detected in plasma at higher levels, which may contribute to the clinical effects observed with naltrexone treatment.6
As naltrexone is chiefly metabolized by reduction, the drug may act as a candidate of reductase enzyme probe substrates. Therefore, naltrexone reduction may be utilized to study the effect of disease state and thera-peutic treatments on metabolic reduction to gain a better understanding of this metabolic pathway. For instance, kidney disease has been recently shown to alter drug reduction in vitro.7 However, the mechanisms
be-hind this alteration are unclear. In order to assess factors contributing to alter metabolic reduction, it is necessary to have a robust and validated analytical method suitable for the quantitative determination of 6-beta naltrexol metabolite generated from in vitro experiments.
Because of inherent selectivity and specificity of Mass Spectrometry (MS), multiple analytical methods have been developed utilizing High
Performance Liquid Chromatography (HPLC) coupled with MS detec-tion for the determinadetec-tion of naltrexone, with only few assays have quan-tified naltrexone and 6-beta naltrexol simultaneously.8-13 Additionally,
these methods were validated in biological fluids such as serum, plasma and blood of animals or human. Up to our knowledge, there were no re-ports specifically designed to quantify 6-beta naltrexol following in vitro enzyme kinetic studies.4,5 Thus, we developed and partially validated a
simple and rapid HPLC-MS/MS assay for the simultaneous determina-tion of naltrexone and 6-beta naltrexol metabolite following in vitro in-cubations. The method was used to examine, for the first time, the effect of uremic toxins on cytosolic reduction of naltrexone.
MATERIALS AND METHODS
Chemicals and Reagents
or BBC Chemicals (USA). All chemicals were with the highest purity and analytical grade available. Nitrogen gas (ultra-pure, >99.9%) was produced by a Parker nitrogen generator (USA). Pooled human liver cytosol (20 mg/mL) was obtained from Gibco/ThermoFisher Scientific (USA).
Equipment and HPLC-MS/MS Conditions
Liquid chromatography was performed with an Agilent 1200 Series HPLC system (Agilent Technologies, CA, USA) including an autosam-pler and high-performance binary pump. Chromatographic separation of the samples was achieved with Inert Sustain C18 (2.1 × 50 mm, 5 µm, GL Sciences, Japan) analytical column. Analytes were separated under isocratic mobile phase over flow rate of 200 µL/min and composed of 20% solvent A (water containing 0.1% formic acid) and 80% solvent B (methanol containing 0.1% formic acid). The total run time was 5 min. The autosampler was maintained at 10°C and the column temperature was held at 40°C.
MS/MS detection was performed on API- 3200 triple quadruple mass spectrometer (Applied Biosystems/ MDS Sciex) equipped with a heated electrospray ionization source. Analytes were detected in positive ioniza-tion mode using multiple reacioniza-tion monitoring with a dwell time of 150 ms. The spray voltage was set to 5500V and the ion source temperature was set to 450°C. The sheath gas and auxiliary gas were set to 45 and 50 (arbitrary units), respectively. Collision gas pressure was set at 5 mTorr. The ion transitions were m/z 342.2 → 322.8 for naltrexone (collision en-ergy = 27V), m/z 344.2 → 324.8 for 6-beta naltrexol (collision energy = 25V) and m/z 400.2 → 152.1 for the internal standard colchicine (colli-sion energy =115V). Data were processed with Analyst Software (ver(colli-sion 1.6.2, Applied Biosystems/ SCIEX).
Preparation of Calibration Standards and Quality
Controls
Naltrexone was dissolved in methanol and 6-beta naltrexol was dissolved in DMSO to prepare 1.0 and 5.0 mg/mL stock solutions, respectively. These solutions were spiked into 10 mM Tris-HCl incubation buffer (pH 7.4) to create working solutions that were used to prepare calibration standards at concentrations of 100, 150, 300, 600, 1500, 3000, 6000 and 8000 ng/mL for naltrexone and 10, 15, 30, 60, 150, 300, 600 and 800 ng/ mL for 6-beta naltrexol. Three quality control (QC) samples (LQC, MQC and HQC) containing both analytes were made by spiking analyte stock and working solutions into Tris-HCl buffer to prepare three concentra-tion levels of 400, 2000 and 7000 ng/mL for naltrexone and 40, 200 and 700 ng/mL for 6-beta naltrexol metabolite. Stock solutions were stored at -40ºC, whereas calibration standards and QC samples were stored at 4ºC.
Sample Preparation
The internal standard colchicine was initially prepared in methanol at stock concentration of 1.0 mg/L that was further diluted in Tris-HCl buf-fer to prepare a working solution containing 100 µg/mL. A 200 µL ali-quot of sample (calibration standards, QCs, blanks, application samples) was spiked with 20 µL internal standard solution and vortexed. Liquid-liquid extraction was carried out by adding 2 mL Methyl Tert-butyl Ether (MTBE) to samples followed by vigorous vortex-mixing at room tem-perature. Samples were then centrifuged at 3000 rpm for 15 min and the upper organic layer was then removed using a pipette and evaporated to dryness under vacuum at 45°C using CentriVap Console Mobile System (Labconco, USA). The dried residue was then reconstituted with 100 µL of mobile phase and a 20 µL aliquot was injected onto the LC-MS/MS system.
Assay Validation
Calibration and LinearityCalibration curves were constructed using eight concentrations of nal-trexone and its reduced metabolite (6-beta naltrexol). Each calibration level (Including blank sample with or without internal standard) was run in duplicate for three days, except for the Lower Limit of Quantification (LLOQ), which was run in 3-5 replicates. For each curve, the peak area ratios of the analyte to the internal standard were calculated and plot-ted against the nominal analyte concentration. Calibration curves were generated by 1/x weighted linear regression model that provided the best fit to data.
Accuracy and Precision
The accuracy and precision were assessed by analysis of six replicates of QC samples run on three days, with a total of n=18 samples at each QC level. Intra-day accuracy and precision were determined by analysing six replicates run at one day, whereas inter-day accuracy and precision were estimated using all 18 QC samples. Accuracy was expressed as (% bias) which reflects the measured concentration relative to the nominal con-centration. The precision was expressed as relative standard deviation (% RSD). For the accuracy and precision, the acceptance criteria should be within 15% for the QC samples and within 20% for the LLOQ.
Extraction Efficiency and Matrix Effect
The extraction efficiency was assessed by comparing the peak areas of analytes spiked in the buffer before extraction with that of neat solutions spiked in the mobile phase, which was defined as 100% recovery. Matrix effect was evaluated by comparing the response of the analytes spiked in the buffer after sample processing with that of neat solutions spiked di-rectly in mobile phase, representing 100% (no matrix effect). All experi-ments were conducted in four replicates at the three QC levels.
Application of the Method
The current method was applied by evaluating the impact of uremic toxins on metabolic reduction using naltrexone as probe substrate. The formation of 6-beta naltrexol metabolite in vitro was quantified after na-ltrexone reduction. Human hepatic cytosolic protein (0.5 mg/mL) was incubated with naltrexone (50 µM) and 5 mM MgCl2 in 10 mM Tris-HCl buffer (pH 7.4). Incubations were conducted in the presence of uremic toxins such as hippuric acid, p-cresol, 3-indoxyl sulfate, indole-3-acetic acid, CMPF and creatinine at previously reported concentrations of 10 and 100 µM.14,15 Substrate concentration was selected based on Km value
determined on preliminary experiments. Control incubations were per-formed with vehicles (DMSO or water) at a final concentration of 1% v/v. Testosterone (100 µM) that was previously shown to inhibit naltrexone reduction and was used as a positive control.5 The reaction mixture was
pre-incubated for 5 min in a shaking water bath at 37°C prior to the start of the reaction by addition of 1 mM NADPH. Reactions lasted for 30 min and terminated by the addition of ice-cold acetonitrile. Samples were then mixed briefly and placed on ice for 10 min. The mixture was then centrifuged at 10,000 rpm for 15 min to pellet cytosolic protein. The supernatant was collected and the analytes were quantified as described above. Incubations were conducted in triplicates.
RESULTS
Optimization of LC-MS/MS Conditions, Chromatography
and Extraction Method
MS parameters (tube lens and collision energy) were optimized automat-ically to achieve optimum detection of the analytes with best sensitivity. Individual standard solutions (10 μg/mL) of the analytes and internal standard were directly infused into the instrument equipped with ESI source operating in positive ionization mode. Optimum mass transitions were selected for each analyte and were used later for their quantifica-tion.
Chromatographic conditions were optimized with the aim of achieving the shortest run time and best peak shape. Various mobile phases’ com-position and ratios, different formic acid concentrations and variable flow rates were employed. Best peak shapes and high sensitivity were obtained when 0.1% formic acid was added to the mobile phase. The en-hanced sensitivity is attributed to the better protonation of the analytes in the positive ion mode.
The sample preparation step of liquid–liquid extraction was employed to isolate the analytes from the buffer and reduce potential matrix ef-fect associated with it. It also provides a step for preconcentration the sample if lower limit of detection is required. Multiple organic solvents (MTBE, diethyl ether, methylene chloride) were evaluated and MTBE was selected as it showed the highest extraction recovery compared to other solvents.
Chromatographic Separation
Representative chromatograms of LLOQ and study sample depicting the internal standard are displayed in Figure 1. The retention times were ap-proximately 0.66, 0.65 and 0.88 min for naltrexone, 6-beta naltrexol and colchicine, respectively.
Assay Validation
The assay was found to be linear over concentration ranges of 100-8,000 ng/mL for naltrexone and 10-800 ng/mL for 6-beta naltrexol, with a cor-relation coefficient (r2) ranged of (0.990-0.998) for all curves. The LLOQ
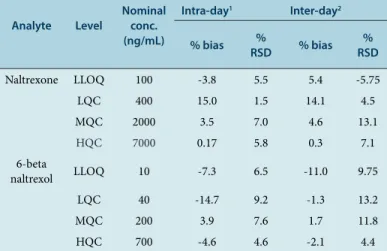
for each calibration curve demonstrated acceptable accuracy and preci-sion with intra- and inter-day values of RSD and bias were within ±7.3% and ±11% respectively, for both analytes (Table 1). The signal-to-noise was greater than 10:1 for both analytes.
The intra-day and inter-day accuracy (% bias) and precision (% RSD) were determined at naltrexone QC concentrations of 400, 2000 and 7000 ng/mL and 6-beta naltrexol concentrations of 40, 200 and 700 ng/mL. Assay bias ranged from -14.7 to 15%, while the RSD ranged from 1.5 to 13.2% for all QC levels at intand inter-day assessments (Table 1). In all cases, bias and RSD values were within ±15% for all analytes.
The mean extraction efficiency of both analytes at all QC levels ranged from 73.2% to 114.8%. The matrix effect was minor as the measured con-centrations of both analytes were deviated by 23.8% to 37.1% from neat samples at all QC levels (Table 2). The RSD values were within ±15% for all samples.
Assay Application
The current assay was successfully applied by evaluating the effect of multiple uremic toxins at 10 and 100 µM on naltrexone reduction. The results revealed that indoxyl sulfate at 100 µM inhibits significantly nal-trexone reduction by 27% as compared to the vehicle control. Similarly, the formation rate of 6-beta naltrexol was decreased by 26% in the pres-ence of the positive control testosterone (100 µM), Figure 2. The other investigated uremic toxins including hippuric acid, p-cresol,
indole-3-acetic acid, CMPF and creatinine did not have an effect on naltrexone reduction.
DISCUSSION
In here, we aimed at developing and validating a simple and robust LC-MS/MS method for quantification of naltrexone and 6-beta naltrexol metabolite to support in vitro studies assessing phase I metabolic reduc-tion. This assay was partially validated according to the U.S. Food and Drug Administration (FDA) guidelines for bioanalytical method valida-tion.16 The method is simple, accurate and precise and was applied to
inhibition enzyme kinetic studies of naltrexone reduction and found for the first time that indoxyl sulfate may inhibit metabolic reduction. Carbonyl reduction is the primary Phase I metabolic pathway for xeno-biotics bearing a carbonyl group. Naltrexone reduction to its primary alcohol metabolite (6-beta naltrexol) represents an example of such type of metabolism.3 A previous study characterized the reductase isoforms
contributing to naltrexone reduction found that AKR1C1, AKR1C2 and AKR1C4 were able to metabolize naltrexone, with the highest efficacy was for AKR1C4.4 This suggests that the formation of 6-beta naltrexol
may act as an indicative of reductase activity, which motivated the devel-opment of the current LC-MS/MS assay.
Table 2: Extraction efficiency and matrix effect of analytes in the incubation buffer.
Analyte Level concentration Nominal
(ng/mL)
Extraction efficiency (%,
mean± RSD)
Matrix effect (%, mean±
RSD)
Naltrexone LQC 400 101 ± 3.7 76.2 ± 2.7 MQC 2000 111.9 ± 2.6 72.3 ± 2.7 HQC 7000 114.8 ± 3.5 68.9 ± 2.9 6-beta
naltrexol LQC 400 74.4 ± 11.8 62.9 ± 15.0 MQC 2000 80.3 ± 3.9 71.9 ± 5.4
HQC 7000 73.2 ± 3.9 71.0 ± 1.5
RSD: relative standard deviation.
Table 1: Intra-and inter-day accuracy (% bias) and precision (% RSD) for LLOQ and quality control samples of analytes.
Analyte
Level
Nominal conc. (ng/mL)
Intra-day1 Inter-day2
% bias RSD% % bias RSD%
Naltrexone LLOQ 100 -3.8 5.5 5.4 -5.75 LQC 400 15.0 1.5 14.1 4.5 MQC 2000 3.5 7.0 4.6 13.1
HQC 7000 0.17 5.8 0.3 7.1
6-beta
naltrexol LLOQ 10 -7.3 6.5 -11.0 9.75 LQC 40 -14.7 9.2 -1.3 13.2 MQC 200 3.9 7.6 1.7 11.8 HQC 700 -4.6 4.6 -2.1 4.4 1Five replicates for LLOQ; six replicates for LQC, MQC, HQC
a dose dependent manner.18 All other toxins tested in our study showed
negligible effect on naltrexone metabolic reduction indicating that the effect on drug metabolism might be linked to specific uremic toxins. The latter observation is consistent in part to the results of previous studies that revealed that indole-3-acetic acid,14 creatinine,19 CMPF and
hippu-ric acid15 did not have an effect on CYP450 activity. Overall, the results
indicate that the current assay is suitable for enzyme kinetics studies per-tain to metabolic reduction.
The study has limitations. The sensitivity of the method was lower than previous assays. However, the range of the metabolite concentration se-lected was relevant to the purpose of metabolite formation in the pres-ence of inhibitors. Also, the study did not assess the kinetic parameters of inhibitors such as IC50 or Ki, which might be explored in future inves-tigations.
CONCLUSION
A simple, rapid, accurate and reproducible LC-MS/MS method for the determination of naltrexone and 6-beta naltrexol metabolite has been developed and validated. These characteristics along with the short run time and the selectivity associated with LC-MS/MS analysis renders this assay well suited for conducting enzyme kinetic studies assessing meta-bolic reduction (i.e., naltrexone).
ACKNOWLEDGEMENT
This work was supported by the Deanship of Scientific Research at Jordan University of Science and Technology/JUST (grant number 97/2016). We gratefully acknowledge the team members of Pharmaceutical Re-search Center at JUST.
CONFLICT OF INTEREST
The authors declear no conflict of interest.
ABBREVIATIONS
AKR: Aldo-Keto Reductase; CMPF: 3-carboxy-4-methyl-5-propyl-2-furanpropanoic acid; FDA: Food and Drug Administration; HPLC: High Performance Liquid Chromatography; HQC: High Quality Con-trol; LLOQ: Lower Limit of Quantification; LQC: Low Quality Control; MS: Mass Spectrometry; MTBE: Methyl Tert-Butyl Ether; MQC: Middle Quality Control; QCs: Quality Control samples; RSD: Relative Standard Deviation; r2: Correlation Coefficient.
While there are different analytical sensitive assays have been developed for quantification of naltrexone and its metabolites, the presence of an online sample cleaning step with column switching9 or the long run
time10 may act as limitations. The current method, while it is less
sensi-tive, it utilized a simple extraction procedure and has a short run time of 5 mins. Additionally, this assay was specifically developed to quantify 6-beta naltrexol after in vitro incubations. The previous reported meth-ods11,13 employed a relatively large sample volume (1 mL) compared to
our method which used 200 µL sample volume. This is important,
espe-cially in enzyme kinetic studies since incubation volumes are relatively
small. The linear range selected for this study is relatively wide and
ap-plicable for enzyme kinetic investigations. For instance, the concentra-tions of the metabolite obtained from the in vitro studies were within the calibration curve. The results of accuracy and precision experiments demonstrate that the current developed method is satisfactory valid and reproducible. Furthermore, the process efficiency was consistent and re-producible for individual analyte at the three QC levels.
Several studies have shown that kidney disease alters selectively the functional expression of drug metabolizing enzymes.17 For example, the
activity of hepatic reductase enzymes that mediate metabolic reduction is found to be decreased in the setting of impaired kidney function.7
However, the mechanisms behind this alteration are not well established. In here, we hypothesized that uremic toxins accumulated in the serum of kidney disease patients are implicated in this alteration. Therefore, the present method was applied by assessing the effect of various uremic tox-ins at 10 and 100 µM on naltrexone reduction. The finding that indoxyl sulfate is an inhibitor of drug metabolism has also been reported earlier by Tsujimoto et al. who showed that metabolism of losartan in human liver microsomes mediated by CYP450 is inhibited by indoxyl sulfate in Figure. 1: Representative chromatograms of incubation buffer at LLOQ (left panel, A-C), and a cytosolic sample incubated with indoxyl sulfate (right panel, D-F). (A) naltrexone: 100 ng/mL; (C, F) internal standard colchicine; (B) 6-beta naltrexol: 10 ng/mL; (D) naltrexone: 7,920 ng/mL; (E) 6-beta naltrexol: 360 ng/ mL.
Article History: Submission Date : 27-11-2018; Revised Date : 20-03-2019; Acceptance Date : 29-03-2019.
Cite this article: Alshogran OY, Zayed AL. A Simple HPLC-MS/MS Method for Quantification of Naltrexone and 6-beta Naltrexol: An Application to Effect of Uremic Toxins on Metabolic Reduction. J Young Pharm. 2019;11(3):261-5.
REFERENCES
1. Hartung DM, McCarty D, Fu R, Wiest K, Chalk M, Gastfriend DR. Extended-re-lease naltrexone for alcohol and opioid dependence:A meta-analysis of health-care utilization studies. J Subst Abuse Treat. 2014;47(2):113-21.
2. Gonzalez JP, DenBrog RN. Naltrexone. A review of its pharmacodynamic and pharmacokinetic properties and therapeutic efficacy in the management of opi-oid dependence. Drugs. 1988;35(3):192-213.
3. Ohara H, Miyabe Y, Deyashiki Y, Matsuura K, Hara A. Reduction of drug ketones by dihydrodiol dehydrogenases, carbonyl reductase and aldehyde reductase of human liver. Biochem Pharmacol. 1995;50(2):221-7.
4. Breyer-Pfaff U, Nill K. Carbonyl reduction of naltrexone and dolasetron by oxidoreductases isolated from human liver cytosol. J Pharm Pharmacol. 2004;56(12):1601-6.
5. Porter SJ, Somogyi AA, White JM. Kinetics and inhibition of the formation of 6beta-naltrexol from naltrexone in human liver cytosol. Br J Clin Pharmacol. 2000;50(5):465-71.
6. Wall ME, Brine DR, Perez-Reyes M. Metabolism and disposition of naltrex-one in man after oral and intravenous administration. Drug Metab Dispos. 1981;9(4):369-75.
7. Alshogran OY, Nolin TD. Implications of Kidney Disease on Metabolic Reduc-tion. Curr Drug Metab. 2016;17(7):663-72.
8. Brunen S, Kruger R, Finger S, Korf F, Kiefer F, Wiedemann K, et al. Determina-tion of naltrexone and 6beta-naltrexol in human blood: Comparison of high-per-formance liquid chromatography with spectrophotometric and tandem-mass-spectrometric detection. Anal Bioanal Chem. 2010;396(3):1249-57.
9. Clavijo C, Bendrick-Peart J, Zhang YL, Johnson G, Gasparic A, Christians U. An automated, highly sensitive LC-MS/MS assay for the quantification of the opi-ate antagonist naltrexone and its major metabolite 6beta-naltrexol in dog and human plasma. J Chromatogr B Analyt Technol Biomed Life Sci. 2008;874(1-2):33-41.
10. Eckart K, Rohrich J, Breitmeier D, Ferner M, Laufenberg-Feldmann R, Urban R. Development of a new multi-analyte assay for the simultaneous detec-tion of opioids in serum and other body fluids using liquid
chromatography-tandem mass spectrometry. J Chromatogr B Analyt Technol Biomed Life Sci. 2015;1001:1-8.
11. Slawson MH, Chen M, Moody D, Comer SD, Nuwayser ES, Fang WB, et al.
Quantitative analysis of naltrexone and 6beta-naltrexol in human, rat and rabbit plasma by liquid chromatography-electrospray ionization tandem mass spec-trometry with application to the pharmacokinetics of Depotrex in rabbits. J Anal Toxicol. 2007;31(8):453-61.
12. Valiveti S, Nalluri BN, Hammell DC, Paudel KS, Stinchcomb AL. Development and validation of a liquid chromatography-mass spectrometry method for the quantitation of naltrexone and 6beta-naltrexol in guinea pig plasma. J Chro-matogr B Analyt Technol Biomed Life Sci. 2004;810(2):259-67.
13. Yun HY, Bang SC, Lee KC, Baek IH, Lee SP, Kang W, et al. Simultaneous analysis of naltrexone and its major metabolite, 6-beta-naltrexol, in human plasma us-ing liquid chromatography-tandem mass spectrometry: Application to a parent-metabolite kinetic model in humans. Talanta. 2007;71(4):1553-9.
14. Liu H, Narayanan R, Hoffmann M, Surapaneni S. The Uremic Toxin Indoxyl-3-Sulfate Induces CYP1A2 In Primary Human Hepatocytes. Drug Metab Lett. 2016;10(3):195-9.
15. Tsujimoto M, Nagano Y, Hosoda S, Shiraishi A, Miyoshi A, Hiraoka S, et al. Ef-fects of decreased vitamin D and accumulated uremic toxin on human CYP3A4 activity in patients with end-stage renal disease. Toxins. 2013;5(8):1475-85. 16. Dhhs US. CDER F: Guidance for Industry–Bioanalytical Method Validation. U.
S. Department of Health and Human Services, Food and Drug Administration, Center for Drug Evaluation and Research, Center for Veterinary Medicine. 2018. Available: https://www.fda.gov/downloads/drugs/guidances/ucm070107.Pdf. 17. Liu B, Luo F, Luo X, Duan S, Gong Z, Peng J. Metabolic Enzyme System
and Transport Pathways in Chronic Kidney Diseases. Curr Drug Metab. 2018;19(7):568-76.
18. Tsujimoto M, Higuchi K, Shima D, Yokota H, Furukubo T, Izumi S, et al. Inhibitory effects of uraemic toxins 3-indoxyl sulfate and p-cresol on losartan metabolism
in vitro. J Pharm Pharmacol. 2010;62(1):133-8.