This is an open access journal, and articles are distributed under the terms of the Creative Commons Attribution-Non Commercial-ShareAlike 4.0 License, which allows others to remix, tweak, and build upon the work non-commercially, as long as appropriate credit is given and the new creations are licensed under the identical terms.
© 2019 Journal of Advanced Pharmacy Education & Research | Published by SPER Publication 83
Utilization and cost minimization study of antihypertensive
drugs in primary healthcare center
Yusransyah
1,2, Eli Halimah
1,3*, Auliya A. Suwantika
1,31 Department of Clinical Pharmacy, Faculty of Pharmacy, Universitas Padjadjaran, Indonesia. 2 Department of Clinical Pharmacy study Program of Pharmacy, Salsabila
Institute of Health Science, Serang, Banten, Indonesia. 3 Center of Excellence in Higher Education for Pharmaceutical Care Innovation, Universitas Padjadjaran, Indonesia
Correspondence: Eli Halimah, Pharmacy Faculty of Padjadjaran University, Jl. Raya Bandung Sumedang KM 21, Jatinangor, West Java Indonesia. Email: eli.halimah @ unpad.ac.id.
ABSTRACT
Objective: Hypertension is the biggest cause of death in Indonesia, including in the district of Pandeglang, for the category of non-communicable diseases. Since the implementation of National Health Insurance (NHI) in 2014, prevention strategies are expected to be able to improve the control of the patient's systolic blood pressure in the district of Pandeglang through interventions that are more focused on blood pressure changes and treatment cost. However, it is necessary to conduct a cost-minimization analysis of antihypertension drug use since drug cost is responsible with approximately 40% of the total healthcare costs in Indonesia. In the context of management on the use of antihypertension drugs at primary healthcare centers, this study was aimed to analyze the cost minimization of hypertension treatment in the district of Pandeglang in a period of 2014-2016 by taking into account the drug utilization and its cost consequences. Material and method: Data related to drug utilization was collected retrospectively from the Department of Health. The economic evaluation was conducted by applying Drug Utilization 90% (DU90%) and Cost Minimization Analysis (CMA) methods. Result: The results showed that captopril 25mg was obviously included in both 75% and 90% segments each year. Other drugs with the highest frequency included amlodipine 5mg and 10mg, captopril 12.5mg, furosemide 40mg, HCT, reserpine 0.25mg, and amlodipine besylate 5mg. Cost per Defined Daily Dose (DDD) was estimated to be Rp 58 (18%), Rp 195 (80%), and Rp 68 (25%) per DDD in 2014, 2015, and 2016, respectively, when a threshold of 90% in the drug utilization was applied. When a threshold of 75% was applied, cost/DDD would be Rp 62 (18%), Rp 208 (79%), and Rp 68 (23%) per DDD in 2014, 2015, and 2016, respectively. Conclusion: It can be concluded that the first year of NHI implementation yielded the lowest cost/DDD.
Keywords: DU90%, economic evaluation, DDD, cost/DDD
Introduction
Hypertension is a cardiovascular disease that is commonly known as the "silent killer". It also has been highlighted as a risk factor for various diseases (e.g., coronary artery, heart failure, stroke, and kidney failure) when the blood pressure increases
significantly as the consequence of people’s lifestyle. In the
context of management therapy, the use of antihypertension drugs plays an important role in successful treatment. Several previous studies confirmed that patients who discontinue antihypertension drugs have a five times greater likelihood of having a stroke[1].
In Indonesia, hypertension has been acknowledged as the biggest cause of death in the category of non-communicable diseases, according to the reports from Basic Health Research that was conducted every five years by the Ministry of Health. In the province of Banten, the prevalence of hypertension was reported to significantly increase from 8.0% in 2007 to 8.6% in 2013[2].
This situation occurred in all districts in this province including in the district of Pandeglang.
Since the implementation of National Health Insurance (NHI) in 2014, prevention strategies are expected to be able to improve
Access this article online
Website: www.japer.in E-ISSN: 2249-3379
How to cite this article: Yusransyah, Eli Halimah, Auliya A. Suwantika.
Utilization and cost minimization study of antihypertensive drugs in primary healthcare center. J Adv Pharm Edu Res 2019;9(4):83-88.
Journal of Advanced Pharmacy Education & Research | Oct-Dec 2019 | Vol 9 | Issue
the control of the patient's systolic blood pressure in Indonesia, specifically in the district of Pandeglang through interventions that are more focused on changes of blood pressure and treatment cost[3]. However, it is necessary to conduct a
cost-minimization analysis of antihypertension drug use since drug cost covers approximately 40% of the total cost of healthcare in Indonesia. This study was aimed to analyze the cost minimization of hypertension treatment in the district of Pandeglang since the implementation of NHI in 2014 until 2016 in the context of management on the use of the antihypertension drug at primary healthcare centers, taking into account the drug utilization and its cost consequences[4].
Subjects and Methods
A longitudinal time series of data collection was applied in this study by considering more than one stage of data collection at different times. The study was conducted by analyzing the use of antihypertensive drugs in all primary healthcare centers (PHCs) in the district of Pandeglang and taking into account initial-final amount of usage, price, Defined Daily Dose (DDD) value, cost related to Drug Utilization (DU), and cost per DDD in two selected thresholds (90% and 75%) in a period of 2014-2016. To calculate DDD, it was based on the Anatomical Therapeutic Chemical (ATC) Classification, according to the guideline set by the WHO Collaborating Center for Drug Statistics Methodology in 2011 [5-9]. As DDD represents the average maintenance dose
per day, value DDD of each type of antihypertensive use was obtained by dividing the total usage of the drug (in grams or milligrams) with the value of DDD set by WHO. The use of antihypertensive per day in terms of DDD/1,000 inhabitants was calculated, thereafter. To present data in the percentage of antihypertensive use, the percentage of cumulative DDD was taken into account by considering applied thresholds. In the context of cost per DDD, cost-minimization analysis (CMA) was conducted by comparing the total cost of antihypertensive use in 2014, 2015, and 2016 to investigate the lowest cost in these years. More detailed description of the calculation can be seen in Table 1.
Table 1. Calculation
DDD (one year) = 𝐓𝐨𝐭𝐚𝐥 𝐮𝐬𝐞 𝐨𝐟 𝐚𝐧𝐭𝐢𝐡𝐲𝐩𝐞𝐫𝐭𝐞𝐧𝐬𝐢𝐨𝐧 𝐝𝐫𝐮𝐠𝐬 𝐢𝐧 𝐨𝐧𝐞 𝐲𝐞𝐚𝐫 (𝐠𝐫)𝐠𝐫 𝐢𝐬 𝐞𝐪𝐮𝐢𝐯𝐚𝐥𝐞𝐧𝐭 𝐭𝐨 𝟏 𝐃𝐃𝐃
DDD/1,000 inhabitants/day = 𝐃𝐃𝐃 𝐨𝐧𝐞 𝐲𝐞𝐚𝐫 × 𝟏,𝟎𝟎𝟎
𝐓𝐨𝐭𝐚𝐥 𝐢𝐧𝐡𝐚𝐛𝐢𝐭𝐚𝐧𝐭𝐬 × 𝟑𝟔𝟓
% Drug Use = 𝐃𝐃𝐃/𝟏,𝟎𝟎𝟎 𝐢𝐧𝐡𝐚𝐛𝐢𝐭𝐚𝐧𝐭𝐬/𝐝𝐚𝐲
𝐓𝐨𝐭𝐚𝐥 𝐃𝐃𝐃/𝟏,𝟎𝟎𝟎 𝐢𝐧𝐡𝐚𝐛𝐢𝐭𝐚𝐧𝐭𝐬/𝐝𝐚𝐲 𝐢𝐧 𝐚𝐥𝐥 𝐝𝐫𝐮𝐠𝐬× 100%
Cost of DU90% = 𝐓𝐨𝐭𝐚𝐥 𝐩𝐫𝐢𝐜𝐞 𝐨𝐟 𝐝𝐫𝐮𝐠𝐬 𝐢𝐧𝐜𝐥𝐮𝐝𝐞𝐝 𝐢𝐧 𝐭𝐡𝐞 𝐃𝐔𝟗𝟎%𝐓𝐨𝐭𝐚𝐥 𝐩𝐫𝐢𝐜𝐞 𝐨𝐟 𝐝𝐫𝐮𝐠𝐬 𝐢𝐧 𝐚𝐥𝐥 𝐬𝐞𝐠𝐦𝐞𝐧𝐭𝐬
Cost/DDD (90%) = 𝐓𝐨𝐭𝐚𝐥 𝐩𝐫𝐢𝐜𝐞 𝐨𝐟 𝐝𝐫𝐮𝐠𝐬 𝐢𝐧𝐜𝐥𝐮𝐝𝐞𝐝 𝐢𝐧 𝟗𝟎% 𝐬𝐞𝐠𝐦𝐞𝐧𝐭
𝐓𝐨𝐭𝐚𝐥 𝐃𝐃𝐃 𝐨𝐟 𝐝𝐫𝐮𝐠𝐬 𝐢𝐧𝐜𝐥𝐮𝐝𝐞𝐝 𝐢𝐧 𝟗𝟎% 𝐬𝐞𝐠𝐦𝐞𝐧𝐭
Cost/DDD (10%) = 𝐓𝐨𝐭𝐚𝐥 𝐩𝐫𝐢𝐜𝐞 𝐨𝐟 𝐝𝐫𝐮𝐠𝐬 𝐢𝐧𝐜𝐥𝐮𝐝𝐞𝐝 𝐢𝐧 𝟏𝟎% 𝐬𝐞𝐠𝐦𝐞𝐧𝐭𝐓𝐨𝐭𝐚𝐥 𝐃𝐃𝐃 𝐨𝐟 𝐝𝐫𝐮𝐠𝐬 𝐢𝐧𝐜𝐥𝐮𝐝𝐞𝐝 𝐢𝐧 𝟏𝟎% 𝐬𝐞𝐠𝐦𝐞𝐧𝐭
Cost Minimization Analysis (CMA) = Cost per DDD
Method
Materials
The research material was data of antihypertensive use in 2014, 2015, and 2016, and the DDD value of any type of antihypertensive.
Instrument
Excel Calculation System, computer, pencil, ballpoint, ruler, book reference, calculator, and paper.
Procedure
Analyzing the use of antihypertensive drugs in all primary healthcare centers (PHCs) in the district of Pandeglang and taking into account initial-final amount of usage, price, Defined Daily Dose (DDD) value, cost related to Drug Utilization (DU), and cost per DDD in two selected thresholds (90% and 75%) in a period of 2014-2016.
Statistical Analysis
The study results were statistically analyzed using the Excel program and diagrams to decide the value of Defined Daily Dose (DDD), cost related to Drug Utilization (DU), and cost per DDD in two selected thresholds (90% and 75%) in a period of 2014-2016.
Results
Utilization of all antihypertensive drugs used in 36 PHCs in the district of Pandeglang was analyzed by considering 90% and 75% thresholds, which are in accordance with the National Essential Medication List in the Health Center issued by the Ministry of Health of the Republic of Indonesia [3].
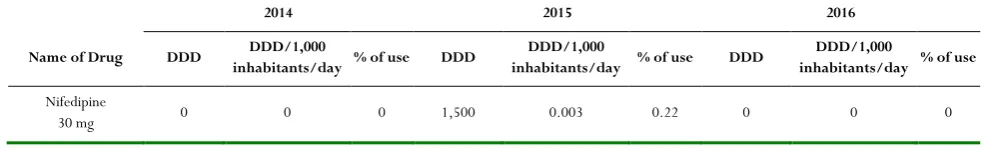
Table 2. Defined Daily Dose
2014 2015 2016
Name of Drug DDD DDD/1,000
inhabitants/day % of use DDD
DDD/1,000
inhabitants/day % of use DDD
DDD/1,000
inhabitants/day % of use
Nifedipine
Amlodipine
10 mg 600 0.0014 0.19 189,540 0.43 27.5 432,200 0.99 47.11
Amlodipine
5 mg 0 0 0 205,080 0.47 29.8 0 0 0
Amlodipine besylate 5
mg 12,530 0.03 4 85,090 0.196 12.34 209,640 0.48 22.9
Bisoprolol
2.5 mg 0 0 0 0 0 0 0 0 0
Bisoprolol
5 mg 0 0 0 2,655 0.006 0.39 3,195 0.007 0.35
Captopril
12.5 mg 12,275 0.03 4 48,150 0.11 7 69,050 0.16 7.53
Captopril
25 mg 116,720 0.27 37.2 102,200 0.23 14.9 164,700 0.38 18
Diltiazem
30 mg 0 0 0 800 0.0019 0.12 825 0.002 0.09
Furosemide
40 mg 43,200 0.1 13.8 50,500 0.12 7.32 32,500 0.07 3.54
Furosemide injection 0 0 0 162 0.0004 0.024 675 0.002 0.08
Hydrochlorothiazide
25 mg 19,000 0.044 6.06 0 0 0 0 0 0
Lisinopril
10 mg 0 0 0 0 0 0 0 0 0
Lisinopril
5 mg 0 0 0 0 0 0 0 0 0
Nifedipine
10 mg 3,600 0.0083 1.148 400 0.0009 0.06 3,733 0.009 0.41
Propranolol
10 mg 238 0.00055 0.076 575 0.0013 0.08 0 0 0
Propranolol
40 mg 0 0 0 975 0.002 0.14 0 0 0
Reserpine
0.1 mg 0 0 0 0 0 0 0 0 0
Reserpine
0.25 mg 105,500 0.243 33.63 0 0 0 0 0 0
Spironolactone 25 mg 0 0 0 1,867 0.00428 0.27 933,333 0.0022 0.102
Total 313,663 0.723 100 689,494 1.59 100 917,452 2.094 100
From Table 2, it can be seen that the highest DDD value was presented in 2016 (917,452 DDD) and the smallest DDD value was presented in 2014 (313,663 DDD). The results also showed that captopril 25 mg, amlodipine 5 mg, and amlodipine 10 mg were considered as the drugs with the highest DDD in 2014, 2015, and 2016, respectively.
In particular, the highest value of DDD/1,000 population/day in 2014 was calculated to be 0.269 of captopril 25 mg, meaning that 0.0269% of the population in the district of Pandeglang consumed 1 DDD from captopril 25 mg daily. In 2015, the highest value of DDD/1,000 population/day was calculated to be 0.470 of amlodipine 5 mg, meaning 0.047% of the population
Journal of Advanced Pharmacy Education & Research | Oct-Dec 2019 | Vol 9 | Issue
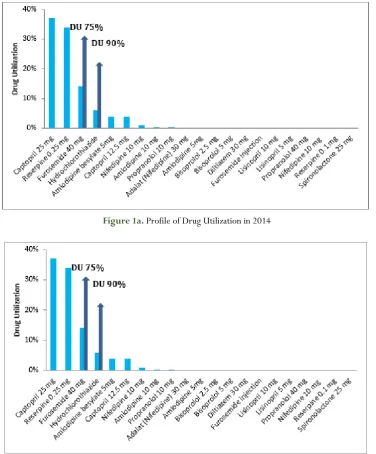
Figure 1a. Profile of Drug Utilization in 2014
Figure 1b. Profile of Drug Utilization in 2015
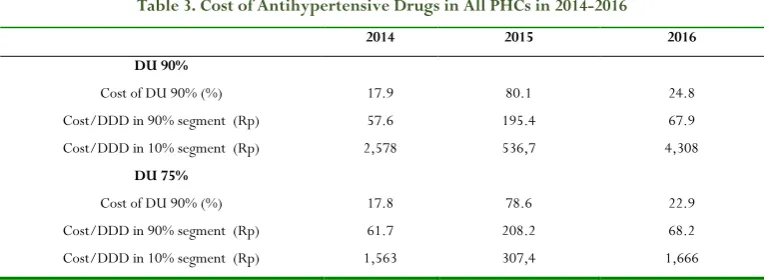
Table 3. Cost of Antihypertensive Drugs in All PHCs in 2014-2016
2014 2015 2016
DU 90%
Cost of DU 90% (%) 17.9 80.1 24.8
Cost/DDD in 90% segment (Rp) 57.6 195.4 67.9
Cost/DDD in 10% segment (Rp) 2,578 536,7 4,308
DU 75%
Cost of DU 90% (%) 17.8 78.6 22.9
Cost/DDD in 90% segment (Rp) 61.7 208.2 68.2
Cost/DDD in 10% segment (Rp) 1,563 307,4 1,666
Furthermore, Table 3 showed that the highest cost of DU 90% and 75% can be found in 2015, which was estimated to be 80.1% and 78.6% in the segment of 90% and 75%, respectively. In particular, the lowest cost of DU 90% and 75% can be found in 2014, which was estimated to be 17.8-17.9% in both segments. Applying a 90% threshold, cost/DDD in 90% segment was calculated to be constantly lower than cost/DDD in a 10% segment in 2014-2016. Applying a 75% threshold, cost/DDD in 75% segment was also calculated to be lower than in cost/DDD in 25% segment in the same period.
From the calculation, it can be seen that captopril 25 mg was obviously included in both 90% and 75% segments every year. Other drugs with the highest frequency were amlodipine 5 mg and 10 mg, captopril 12.5 mg, furosemide 40 mg, hydrochlorothiazide, reserpine 0.25 mg, and amlodipine besylate 5 mg. With respect to DDD, which is the average daily adult dose used for medical indication, its value has been acknowledged to analyze drug utilization in the selected period. The value of DDD is internationally standardized so that drug use can be compared with other countries. However, its extensive use also needs to monitor the side effects of the drug and the patient's compliance with it. Considering the total population of 1,188,405, the results confirmed that 320 residents consumed 1 DDD of captopril 25 mg daily in 2014; 562 residents consumed 1 DDD of amlodipine 5 mg daily in 2015, and 1,184 residents consumed 1 DDD of amlodipine 10 mg daily in 2016. The results confirmed that the highest DDD value of antihypertensive drugs was changing over three years. It can be highlighted that there was a difference in the highest antihypertensive drug items used each year. Despite the fact that amlodipine and captopril were considered to be the most common used antihypertensive drugs, amlodipine was reported to be more effective in lowering blood pressure in Indonesia, compared to captopril [10].
Comparing cost/DDD in the period of 2014-2016, the lowest cost of DU 90% and 75% can be found in 2014, which was estimated to be 17.8-17.9% in both thresholds. This result confirmed that the lowest cost related to DU can be found in 2014, which was the initial year of NHI implementation. It also can be highlighted that the cost of DU fluctuated over three years. In terms of cost minimization, the cost of DU in 2014 would obviously give the lowest cost. However, this current situation contradicts the ideal situation that the cost of DU should continuously decrease from year to year. This situation might be
due to the increasing number of residents in the district from year to year and the number of patients with hypertension [11-14].
Moreover, cost/DDD in the most majority segment (90% or 75%) was calculated to constantly lower than cost/DDD in the less majority segment (10% or 25%) in these three years. It can be concluded that antihypertensive drugs in the most majority segment would give less impact in terms of cost/DDD compared to antihypertensive drugs in the less majority segment. This situation might be caused by a relatively low price of antihypertensive drugs in the most majority segment, such as captopril 25 mg, amlodipine 5 mg, and 10 mg. Besides the price of drugs, the effectiveness of those antihypertensive drugs in all segments should be taken into account by expanding the study into the cost-effectiveness or cost-utility analysis. However, one limitation of this study was assuming the same effectiveness for all analyzed drugs.
Despite the fact that this study had several limitations, the results of this study can assist the stakeholder in Indonesia, specifically in the district of Pandeglang in deciding to gain optimal cost efficiency in treating hypertension in PHCs. In the recent few years, several critical factors such as the increasing number of residents and patients with hypertension from year to year should be taken into account by the central and local government in Indonesia to deal with a limited budget in the treatment of non-communicable diseases.
Conclusion
The results showed that captopril 25mg was obviously included in both 75% and 90% segments every year. Other drugs with the highest frequency were amlodipine 5mg and 10mg, captopril 12.5mg, furosemide 40mg, HCT, reserpine 0.25mg, and amlodipine besylate 5mg. when a threshold of 90% in the drug utilization was applied, Cost per Defined Daily Dose (DDD) was estimated to be Rp 58 (18%), Rp 195 (80%), and Rp 68 (25%) per DDD in 2014, 2015, and 2016, respectively. When a threshold of 75% was applied, cost/DDD was Rp 62 (18%), Rp 208 (79%), and Rp 68 (23%) per DDD in 2014, 2015, and 2016, respectively. It can be concluded that the first year of NHI implementation yielded the lowest cost/DDD.
Journal of Advanced Pharmacy Education & Research | Oct-Dec 2019 | Vol 9 | Issue
Acknowledgments
This research was supported by the minister of the ministry of research, technology, and higher education. We would like to thank the minister of the ministry of research, technology, and higher education for supporting the funding of this research through the doctoral grant program in 2018.
References
1. Aguiar PM, Balisa-Rocha BJ, Brito GD, da Silva WB, Machado M, Lyra Jr DP. Pharmaceutical care in hypertensive patients: a systematic literature review. Research in Social and Administrative Pharmacy. 2012 Sep 1;8(5):383-96.
2. Ministry of Health. 2013. Basic Health Research. Available at:
http://www.depkes.go.id/resources/download/general /Hasil%20Riskesdas%202013.pdf
3. Ministry of Health. 2017. National Essential Medication
List. Available at:
http://hukor.kemkes.go.id/uploads/produk_hukum/K
MK_No._HK_.01_.07-MENKES-395-2017_ttg_Daftar_Obat_Esensial_Nasional_.pdf
4. Ministry of Health. 2016. Technical Guidelines of Pharmacoeconomics Studies in Healthcare Facilities.
Available at:
http://farmalkes.kemkes.go.id/?wpdmact=process&did =MzQuaG90bGluaw==
5. Bergman U, Popa C, Tomson Y, Wettermark B, Einarson TR, Åberg H, Sjöqvist F. Drug utilization 90%–a simple method for assessing the quality of drug prescribing. European journal of clinical pharmacology. 1998 Apr 1;54(2):113-8.
6. WHO. Introduction to Drug Utilization Research Introduction to Drug Utilization Research. 2003.
Available at:
https://apps.who.int/medicinedocs/pdf/s4876e/s4876 e.pdf
7. Akalin S, Kutlu SS, Cirak B, Eskiçorapcı SY, Bagdatli D,
Akkaya S. Application of ATC/DDD methodology to evaluate perioperative antimicrobial prophylaxis. International journal of clinical pharmacy. 2012 Feb 1;34(1):120-6.
8. Bozkurt F, Kaya S, Tekin R, Gulsun S, Deveci O, Dayan S, Hoşoglu S. Analysis of antimicrobial consumption and cost in a teaching hospital. Journal of infection and public health. 2014 Mar 1;7(2):161-9.
9. WHO. Guidelines for ATC classification and DDD
assignment. 2019. Available at:
https://www.whocc.no/filearchive/publications/2019_ guidelines_web.pdf
10. Untari EK, Agilina AR, Susanti R. Evaluasi Rasionalitas Penggunaan Obat Antihipertensi di Puskesmas Siantan Hilir Kota Pontianak Tahun 2015. Pharmaceutical Sciences and Research (PSR). 2018 May 7;5(1):32-9. 11. Elliott WJ. Improving outcomes in hypertensive patients:
focus on adherence and persistence with antihypertensive therapy. The Journal of Clinical Hypertension. 2009 Jul;11(7):376-82.
12. Bisognano J, McLaughlin T, Roberts CS, Battleman D, Schwartz B, Garza D, Tang S. Incremental effectiveness of amlodipine besylate in the treatment of hypertension with single and multiple medication regimens. American journal of hypertension. 2004 Aug 1;17(8):676-83. 13. Fares, H., DiNicolantonio, J. J., O'Keefe, J. H., & Lavie,
C. J. (2016). Amlodipine in hypertension: a first-line agent with efficacy for improving blood pressure and patient outcomes. Open Heart, 3(2), e000473.