M E T H O D O L O G Y
Open Access
A convenient method for simultaneous
quantification of multiple phytohormones and
metabolites: application in study of
rice-bacterium interaction
Hongbo Liu, Xianghua Li, Jinghua Xiao and Shiping Wang
*Abstract
Background:Simultaneous analysis of multiple functional-related phytohormones and their metabolites will improve our understanding of interactions among different hormones in the same biologic process.
Results:A method was developed for simultaneous quantification of multiple phytohormones, abscisic acid, indole-3-acetic acid (IAA), jasmonic acid (JA), and salicylic acid, hormone conjugates, IAA-aspartic acid, JA-isoleucine, and methyl JA, and phytoalexins, momilactone A, naringenin, and sakuranetin. This method combines a convenient procedure for preparing filtrated crude extracted samples and a sensitive quantification assay using ultra fast liquid chromatography-electrospray ionization tandem mass spectrometry (UFLC-ESI-MS). With this method, we
determined the dynamic profiles of defense-related phytohormones, hormone metabolites, and phytoalexins in the interaction of rice withXanthomonas oryzaepv.oryzae(Xoo), which causes bacterial blight, one of the most devastating diseases of rice worldwide.
Conclusion:This UFLC-ESI-MS method is convenient, sensitive, reliable, and inexpensive for quantification of multiple phytohormones and metabolites compared to current methods. The results obtained by application of this method in studying rice-bacterial interaction provide a basis for understanding the molecular mechanisms of rice defense responses.
Keywords:Abscisic acid, defense, LC-ESI-MS, indole-3-acetic acid, jasmonic acid, phytoalexin, salicylic acid
Background
Phytohormones are essential for the regulation of diverse physiologic processes of plants, including devel-opment, growth, reproduction, and responses to biotic and abiotic stresses. Plant-produced hormones include nonpeptide hormones, abscisic acid (ABA), auxin or indole-3-acetic acid (IAA, the major form of auxin in most plants), brassinosteroids, cytokinins, ethylene, gib-berellins, jasmonic acid (JA), nitric oxide, salicylic acid (SA), and strigolactones, and peptide hormones [1,2]. The nonpeptide phytohormones are structurally unre-lated small molecules. Phytohormones act as signal
molecules in biological activities and frequently occur in low concentration. The homeostasis of these hormones is tightly controlled between the biosynthetic and meta-bolic pathways. The metabolism of nonpeptide phyto-hormones is generally categorized into three types of reactions: hydroxylation, oxidation, and conjugation [3,4]. For example, hydroxylation of JA results in partial biologically active 12-OH-JA and hydroxylation of ABA generates biologically active 7’-OH ABA, 8’-OH ABA, and 9’-OH ABA [3,5]. Cytokinin can be inactivated by oxidation [6]. The formation of hormone conjugates may generate different forms of active hormones, inac-tive storage hormones, or intermediates for catabolism, such as the active JA-isoleucine (Ile) and methyl JA (MeJA), the inactive storage IAA-alanine, and the inter-mediate IAA-aspartic acid (Asp) [7-9]. A tiny or small * Correspondence: [email protected]
National Key Laboratory of Crop Genetic Improvement, National Center of Plant Gene Research (Wuhan), Huazhong Agricultural University, Wuhan 430070, China
amount of variation in the concentration of a phytohor-mone may change physiologic activity, although the roles of these hormones in different biologic processes still remain to be elucidated [10]. Thus, quantification of the concentrations of hormones and hormone metabo-lites is frequently applied in the study of the molecular regulations of different biologic processes.
Accumulating evidence suggests that multiple phyto-hormones often mediate the same biologic process by additive, synergistic, or antagonistic actions, whereas each type of hormone has a characteristic biologic effect [2,11,12]. For example, plant-pathogen interactions result in changes in the level of various phytohormones [10,13]. SA, JA, and ethylene are well-known signal molecules in plant immunity. Although auxin has a pivotal function in plant development and growth, this hormone also has a position in plant-pathogen interac-tions [14]. Auxin makes plants susceptible to some bio-trophic and hemibiobio-trophic pathogens [15-17] but resistant to necrotrophic pathogens [18,19]. The auxin-dependent pathway antagonistically interacts with the SA-dependent pathway in the Arabidopsis-pathogen interaction [20] but shares many commonalities with the JA-dependent pathway [2,14]. ABA signaling in abiotic stress responses has been intensively studied [21]. In addition, this hormone is also a player in host-pathogen interactions [22]. ABA can promote disease in some cases and promote defense response in other cases by antagonistic interaction with SA and JA/ethylene or synergistic interaction with JA [22,23].
Because of the complex crosstalk among different hor-mone signaling pathways and the multifaceted roles of these signaling molecules in a biologic process, simulta-neous quantification of multiple hormones and their metabolites in the same sample will facilitate the under-standing of the interactions of different hormones. The interactions of different phytohormones frequently occur in a localized tissue in certain biologic processes [2,11,12], which may limit the quantity of tissue samples. Thus, a highly sensitive analytical method is essential for determining the quantitative variation of hormones in the samples that have low concentrations of hormones. Several reports have been published outlining the simul-taneous quantification of multiple hormones. Müller et al. [24] reported a multiplex gas chromatography (GC)-tandem mass spectrometry (MS/MS) approach for simultaneous quantification of acidic phytohormones and related compounds, ABA, IAA, JA, SA, and 12-oxo-phytodienoic acid. However, GC-MS/MS analysis requires a complicated sample preparation procedure including separation, purification, and derivatization. Two groups used high-performance liquid chromatogra-phy (HPLC)-electrospray ionization (ESI)-MS/MS sys-tem to simultaneously quantify acidic hormones ABA,
IAA, JA, and SA [25,26]. Further study reported that using HPLC-ESI-MS/MS allows simultaneous quantifi-cation of both acidic and basic hormones, IAA, JA, SA, and zeatin, and related metabolites [27]. Kojima et al. [28] reported simultaneous quantification of different molecular species of ABA, cytokinins, gibberellins, and IAA using an ultra-performance liquid chromatography-ESI-MS/MS technique after purifying the samples by solid-phase extraction and chemical derivatization. Although more small molecules were quantified in this LC-MS method [28], the sample preparation procedure is complicated compared to the one used by Durgbanshi et al. [25], Forcat et al. [26], and Pan et al. [27].
Plants also produce secondary metabolites, known as phytoalexins that serve as antibiotics in response to bio-tic and abiobio-tic stresses. Phytoalexins contribute to plant basal immunity and accumulate around the infection sites soon after the infection of pathogens [29]. How-ever, the relationship between the pathogen infection-responsive crosstalk of different hormone signaling pathways and the accumulation of phytoalexins is poorly understood.
In this study, we established an ultra fast liquid chro-matography (UFLC)-ESI-MS/MS-based technique for quantitative analysis of small molecules including phyto-hormones, hormone metabolites, and phytoalexins. This technique incorporating a convenient sample prepara-tion procedure is sensitive and reliable for simultaneous quantification of multiple analytes in a small amount of tissue. Using this technique, we analyzed the putative interactions of several phytohormones, hormone meta-bolites, and phytoalexins in rice-bacterium interactions.
Results and Discussion
Optimizing quantification conditions
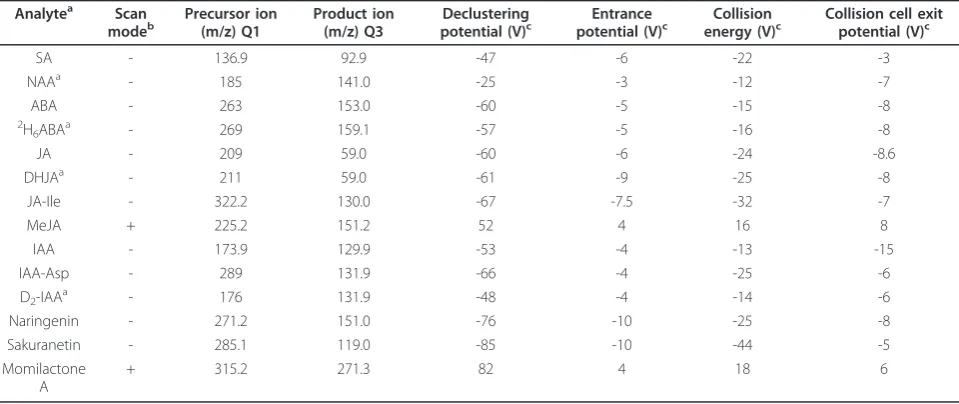
The mass spectrometer was operated in a Q1 scan mode to obtain the mass spectra (MS1) and in a product ion scan mode to obtain the product ion spectra (MS2) of the [M-H] or [M+H] ions. The most abundant precur-sor and product ion fragmentation for each analyte were selected to carry out the multiple reaction monitoring (MRM) scans. To produce maximal signal for each pre-cursor-product ion transition, different parameters of collision energy, declustering potential, entrance poten-tial, collision cell exit potenpoten-tial, and nitrogen flow rate were tested. Table 1 summarizes the optimized analyz-ing conditions for the precursor and characteristic pro-duct ion of each analyte.
Quantification using UFLC-ESI-MS/MS
similar time. Because of their different precursor-to-pro-duct ion transitions, we specifically detect analyte and its internal standard by extracted ion current from total ion current that combines positive or negative scans. To ensure that the elute peak was the analyte or internal standard, we quantified the elute peak by MRM-trig-gered information-dependent acquisition-enhanced pro-duct ion analysis. The representative LC chromatograms and MS fragmentation patterns of analytes are presented in Additional file 1, Figures S1 and S2. The retention times of analytes were in a range of 8.28 to 19.40 min (Additonal file, Table S1).
To verify the reproducibility of analytes under opti-mum UFLC-ESI-MS/MS condition, the retention time and peak areas was investigated by repeated injection (n = 5) of a mixture of the standards at a concentration of 10 ng/ml for each standard. The relative standard devia-tions (RSDs) of the retention times for all the analytes
were in a range of 0.0-0.29% (Table 2). The RSDs of peak areas obtained for all the analytes were in a range of 0.73-4.06% (Table 2).
We used the detection limit (signal/noise) >10 as a threshold for quantification of each analyte. The limit of quantification was 0.01 to 0.1 ng/ml for different analyte (Table 2). A calibration curve generated by a series of fixed amounts of standard was used to determine the amount of each analyte in the sample. The concentra-tion ranges of standards used for generating the calibra-tion curves were 1-100 ng/ml (Table 2). The quantities of the analytes in the samples ranged from 1 ng/g to 2000 ng/g fresh weight tissue. The calibration curves were linear in the concentration ranges of the analytes.
Comparison of different sample preparation procedures To determine the efficiency of analyte extraction from tissues, we quantified each analyte by UFLC-ESI-MS/MS Table 1 Optimized MS/MS conditions for quantifying phytohormones and metabolites
Analytea Scan modeb
Precursor ion (m/z) Q1
Product ion (m/z) Q3
Declustering potential (V)c
Entrance potential (V)c
Collision energy (V)c
Collision cell exit potential (V)c
SA - 136.9 92.9 -47 -6 -22 -3
NAAa - 185 141.0 -25 -3 -12 -7
ABA - 263 153.0 -60 -5 -15 -8
2
H6ABAa - 269 159.1 -57 -5 -16 -8
JA - 209 59.0 -60 -6 -24 -8.6
DHJAa - 211 59.0 -61 -9 -25 -8
JA-Ile - 322.2 130.0 -67 -7.5 -32 -7
MeJA + 225.2 151.2 52 4 16 8
IAA - 173.9 129.9 -53 -4 -13 -15
IAA-Asp - 289 131.9 -66 -4 -25 -6
D2-IAAa - 176 131.9 -48 -4 -14 -6
Naringenin - 271.2 151.0 -76 -10 -25 -8
Sakuranetin - 285.1 119.0 -85 -10 -44 -5
Momilactone A
+ 315.2 271.3 82 4 18 6
a
Internal standards.b
-, negative; +, positive.c V, voltage.
Table 2 Calibration curve and other related data for quantifying phytohormones and metabolites
Analyte Calibration curve limit of quantification (ng/ml)
Reproducibility (RSD) Standard concentration range (ng/ml) Correlation coefficient Retention time (%) Peak area (%)
IAA 1-40 0.9998 0.05 0 0.73
JA 1-100 0.9992 0.01 0 2.42
JA-Ile 1-100 0.9997 0.01 0.26 2.75
ABA 1-100 0.9983 0.01 0 2.29
SA 1-50 0.9995 0.10 0 3.11
IAA-Asp 1-50 0.9902 0.10 0.29 1.77
MeJA 1-50 0.9932 0.10 0.25 2.56
Momilactone A 5-100 0.9987 0.10 0 3.00
Sakuranetin 5-100 0.9993 0.10 0 2.51
after each round of analyte extraction in preliminary experiments. After two rounds of analyte extraction, no target analyte could be detected in the purified samples. This result suggests that two rounds of analyte extrac-tion are enough for extracting all the target analytes from tissues. Thus samples were prepared by two rounds of analyte extraction in the following experiments.
Filtration of crude sample extracts before quantifica-tion will prolong the lifetime of column in the LC-SEI-MS/MS system, although phytohormones in crude plant extracts can be quantified [26,27]. To ascertain whether different types of filters used for filtration of crude extracted samples would influence analyte recovery, the sample extraction buffer containing standard phytohor-mones and metabolites was filtrated with either nylon filter or cellulose filter before quantification. The recov-ery rates of standard phytohormones and metabolites from nylon filter-filtrated samples were ranged from 90% to 95%, and the recovery rates of these standards from cellulose filter-filtrated samples were ranged from 86% to 94% (Additional file 1, Table S1). Although the two types of filters had no significantly different influ-ence (P > 0.05) on analyte recovery, the cellulose filter broke frequently during filtration. Thus nylon filter is more suitable for sample preparation in the present experimental condition and was used in the following sample preparation. Durgbanshi et al. [25] reported simultaneous quantification of ABA, IAA, and JA from filtrated plant samples. However, our sample preparation method allows simultaneous quantification multiple phytohormones (ABA, IAA, JA, and SA), hormone metabolites (IAA-Asp, JA-Ile, and MeJA), and phytoa-lexins (momilactone A, naringenin, and sakuranetin).
The recovery rates of analytes in rice samples were determined by calculating the recovery of internal stan-dards. The recovery of each internal standard was calcu-lated based on the ratio of peak area that was obtained from the extraction of internal standard added to plant samples and the peak area of the same amounts of
internal standards measured directly. The recovery rates of internal standards for ABA, IAA, IAA-Asp, JA, JA-Ile, MeJA, and SA after two rounds of extraction ranged from 90% to 95% in rice samples (Additional file 1, Table S1). Because no commercial internal standards are available for phytoalexins, we can not calculate the recovery rates of phytoalexins in rice samples. However, the recovery rates of phytohormones and their metabo-lites in rice samples showed no significant difference (P > 0.05) from the recovery rates of corresponding stan-dards (Additional file 1, Table S1), we argue that the recovery rates of phytoalexins in rice sample might be approximately larger than 90%. These results suggest that the procedure for sample preparation has a good sample recovery and it can be used for quantification of analytes with different polarity.
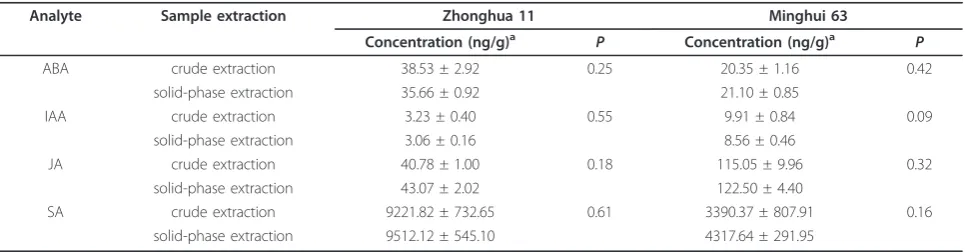
The samples for quantifying phytohormones are fre-quently prepared by solid-phase extraction, which puri-fies sample using a C-bound 18 silica column on the basis of reversed-phase interaction [16,28,30,31]. To ascertain the reliability and sensitivity of our crude extraction procedure for quantifying analytes, grinded powdery samples collected from the leaves of indica rice variety Minghui 63 (Oryza sativa ssp.indica) and japo-nica rice variety Zhonghua 11 (O. sativassp.japonica) were divided into two sets. One set of samples was extracted by crude extraction and the other set by solid-phase extraction. Different phytohormones, ABA, IAA, JA, and SA, in these samples were quantified (Table 3). The quantities of the four hormones in the two sets of samples showed no significant difference from each other (P > 0.05). These results suggest that the filtrated-crude extract prepared by our sample preparation pro-cedure can be used for UFLC-ESI-MS/MS analysis.
Differential hormone and metabolite profiling between resistant and susceptible reactions
Plants protect themselves from pathogen invasion via a complicated signal transduction network. Some phytohor-mones and metabolites function either as a positive or a
Table 3 Comparison of two sample extraction methods for phytohormone quantification
Analyte Sample extraction Zhonghua 11 Minghui 63
Concentration (ng/g)a P Concentration (ng/g)a P
ABA crude extraction 38.53 ± 2.92 0.25 20.35 ± 1.16 0.42
solid-phase extraction 35.66 ± 0.92 21.10 ± 0.85
IAA crude extraction 3.23 ± 0.40 0.55 9.91 ± 0.84 0.09
solid-phase extraction 3.06 ± 0.16 8.56 ± 0.46
JA crude extraction 40.78 ± 1.00 0.18 115.05 ± 9.96 0.32
solid-phase extraction 43.07 ± 2.02 122.50 ± 4.40
SA crude extraction 9221.82 ± 732.65 0.61 3390.37 ± 807.91 0.16
solid-phase extraction 9512.12 ± 545.10 4317.64 ± 291.95
a
negative regulator or factor in this network. ABA, IAA, JA, and SA are reportedly involved in the interactions of rice and different pathogens, although the details of their inter-actions remains to be elucidated [16,32-34]. The IAA-Asp, which lacks IAA bioactivity, is an intermediate in an irre-versible IAA deactivation pathway [35]. Enhanced rice dis-ease resistance to both bacterial and fungal pathogens is accompanied by increased accumulation of IAA-Asp and a reduced level of IAA [16,17]. JA-Ile and MeJA are bioac-tive jasmonates involved in biotic challenges [36-38], although their roles in rice disease resistance remain to be determined. Phytoalexins are antimicrobial secondary metabolites [29]. Rice momilactone A (a terpenoid phytoa-lexin) and sakuranetin (a flavonoid phytoaphytoa-lexin) can enhance rice resistance to fungal pathogen [39,40]. Narin-genin is also a flavonoid phytoalexin and it can inhibit the growth of both bacterial and fungal pathogens [41]. Bac-terial blight caused byXanthomonas oryzaepv.oryzae (Xoo) is one of the most devastating diseases of rice world-wide. To study the crosstalk of different phytohormones and the relationship and interactions of phytoalexins and hormone-dependent pathways, the dynamic contents of defense-related hormones, ABA, IAA, JA, and SA, their metabolites, IAA-Asp, JA-Ile, and MeJA, and phytoalexins, momilactone A, naringenin, and sakuranetin, in resistant and susceptible reactions were simultaneously quantified and compared using the established UFLC-ESI-MS/MS technique.
Rice variety Minghui 63 carrying major disease resis-tance genesXa3/Xa26 andxa25 againstXoois moder-ately resistant to Xoo strain PXO61, whereas variety Zhenshan 97 is susceptible to Xoo [42-45]. The lesion area caused by PXO61 infection was more than 2-fold larger in Zhenshan 97 than in Minghui 63 (Figure 1).
The infected leaf tissues were collected for simulta-neously quantifying target analytes by UFLC-ESI-MS/ MS. The expression patterns of genes known to be involved in hormone and phytoalexin biosynthesis were also analyzed using the same samples and compared to the analyte profiles to examine the reliability of this quantification technique.
ABA
The ABA concentration was 1.6-fold higher in resistant Minghui 63 than in susceptible Zhenshan 97 when with-out pathogen infection. After inoculation ofXoostrain PXO61, the ABA levels in the two rice varieties showed a similar variation pattern in that ABA was significantly increased (P< 0.05) at early infection, returned to basal level, and markedly increased again at 7 d after infection (Figure 2). However, the ABA level in Minghui 63 was 27% lower than that in Zhenshan 97 at 7 d after infec-tion.ZEP(Rice Genome Annotation Project [http://rice. plantbiology.msu.edu/] locus name: Os04g37619), encoding a zeaxanthin epoxidase, andNCED, encoding a 9-cis-epoxycarotenoid dioxygenase, are the key genes controlling ABA biosynthesis [46,47]. The three genes, ZEP,NCED1 (GenBank accession no. AY838897), and NCED3 (AY838899), were markedly induced at 7 d after infection with the expression level significantly higher (P < 0.05) in Zhenshan 97 than in Minghui 63, which was consistent with the differential accumulation of ABA at 7 d after infection in the two rice varieties (Figure 2). Thus, the expression patterns of these genes further confirmed the reliability of the quantification results.
ABA is involved in plant-pathogen interactions, but its role in these interactions is complex. In plant immunity, ABA functions as a negative signal molecule in some cases but a positive signal molecule in other cases [22,23]. Exogenous application of ABA compromises rice resistance to the fungal pathogen Magnaporthe ory-zae[34,48]. However, the role of ABA in the interaction of rice and bacterial pathogenXoois not clear, although protein interaction study around key regulators of biotic response suggests that ABA has an important function in rice resistance to Xoo[49]. The present results show that Xoo-induced susceptible rice plants accumulated more ABA than the resistant plants. Thus, further study may target the putative negative role of ABA in rice-Xoo interaction.
IAA
The variation in endogenous IAA levels showed a simi-lar pattern as ABA in the two rice varieties before and after infection withXoo. The concentration of IAA was 2.5-fold higher in resistant Minghui 63 than in suscepti-ble Zhenshan 97 when without pathogen infection. AfterXoo infection, the IAA levels in the two rice vari-eties showed a similar variation pattern in that they were significantly increased (P < 0.01) at 12 h after 0
20 40 60 80 100
Minghui 63 Zhenshan 97
Les
ion area
(%)
*
infection, returned to basal levels at 24 to 72 h after infection, and markedly increased again at 7 d after infection (Figure 2). However, the IAA level in Minghui 63 was 38% lower than that in Zhenshan 97 at 7 d after infection. Consistent with the IAA level, the IAA-Asp level, the inactive form of IAA, was significantly higher (P < 0.01) in Minghui 63 than in Zhenshan 97 before infection and immediately (30 min) after infection (Fig-ure 2). However, the IAA-Asp level was significantly higher (P< 0.01) in Zhenshan 97 than in Minghui 63 at 12 h after infection. Indole-3-acetaldehyde oxidase (AAO) and nitrilase (NIT) are two protein families involved in the two tryptophan-dependent pathways for IAA biosynthesis in plants, respectively [7]. The
increased expression of rice AAO3 (AK065990) and NIT1 (AK104033) is associated with increased accumu-lation of IAA in rice, suggesting that the two genes are most likely involved in IAA synthesis [16,17]. The expression pattern of AAO3 was similar to the level of IAA in both varieties before and after Xoo infection, suggesting that AAO3may be more closely associated with the local accumulation of IAA after infection than the NIT1 gene in the present experimental condition (Figure 2).
Exogenous treatment of rice plants with IAA promotes disease symptoms caused by both bacterial and fungal pathogens [16,17]. Consistent with previous results, the present results also indicate that accumulation of more Time after Xoo infection (hour)
0 2 4 6 8
AAO3
0.0 0.5 1.0 1.5 2.0 2.5
NIT1
ck 0.5 1 2 12 24 72 168 Zhenshan 97 (susceptible)
0 5 10 15 20 25 30 35
Minghui 63 (resistant) IAA
IAA-Asp
0 3 6 9 12
IAA, metabolite IAA-Asp and IAA biosynthesis-related genes
0 1 2 3 4 ZEP
ck 0.5 1 2 12 24 72 168
Co
nc
en
trat
ion
(n
g/g
FW
)
ABA
Minghui 63 (resistant) Zhenshan 97 (susceptible)
0 20 40 60 80 100
0 2 4 6 8 10 12
NCED3
Relat
ive
ex
pr
ession
lev
el
0 1 2 3 4 5 6 7
NCED1
ABA and its biosynthesis-related genes
Relat
ive
ex
pression
lev
el
Relat
ive
ex
pression
lev
el
Co
ncen
tration
(n
g/g
FW
)
Co
nc
en
tra
tion
(n
g/g
FW
)
Relative
ex
pression
lev
el
Relative
ex
pression
lev
el
IAA in susceptible plants is associated with disease. Interestingly, the variation of IAA level in response to Xooinfection presented a similar pattern as the variation of ABA level (Figure 2). Although many phytohormones, either as positive or negative players, are involved in plant defense signaling networks [10], no interaction between IAA signaling and ABA signaling has been reported to our knowledge. Thus, it is worth analyzing whether the two hormones function synergistically in the rice-Xoointeraction.
JA, JA-related compound, and SA
The JA and SA levels showed opposite patterns in the two rice varieties at some time points examined. JA con-centration was 4.2-fold higher in resistant Minghui 63 than in susceptible Zhenshan 97, whereas the SA con-centration was approximately 58% lower in Minghui 63 than in Zhenshan 97 when without pathogen infection (Figure 3). At early infection (30 min to 1 h), the JA levels were significantly reduced (P < 0.01) in Minghui 63 and increased (P < 0.01) in Zhenshan 97, but SA levels were significantly increased (P < 0.01) in Minghui 63 and reduced in Zhenshan 97 (P< 0.05). At 12 h after infection, the JA level was markedly increased, but the SA level returned to the basal level as compared to non-infected plants in Minghui 63, although both JA and SA levels were significantly increased (P < 0.05) in Zhen-shan 97. At 7 d after infection, the JA level in Minghui 63 was significantly higher (P< 0.01) than that in Zhen-shan 97, whereas the SA level in Minghui 63 was signifi-cantly lower (P< 0.05) than that in Zhenshan 97.
JA-Ile, the active form of JA, is a major regulator that controls jasmonate-responsive gene expression and pro-duction of secondary metabolites after biotic stress [37]. The variation patterns of JA-Ile levels in response to Xoo infection were similar to the JA patterns in the two rice varieties (Figure 3). The exception is that the JA-Ile levels were approximately 2- and 16-fold higher in sus-ceptible Zhenshan 97 than in resistant Minghui 63 at 12 and 24 h after infection, respectively. MeJA is the vola-tile methylester of JA. It activates JA-dependent defense pathway in plant response to necrotrophic pathogens and insects [36,38]. Minghui 63 had a significantly higher (P < 0.01) level of MeJA than Zhenshan 97 at 30 min after infection, but Zhenshan 97 had a significantly higher (P< 0.05) level of MeJA than Minghui 63 at 2 to 24 h after infection (Figure 3).
Lipoxygenase (LOX; D14000) and allene oxide synthase 2 (AOS2; AY062258) regulate JA biosynthesis. Phenylalanine ammonia-lyase 1 (PAL1; X16099) is involved in SA biosynthesis by the phenylpropanoid pathway. Isochorismate synthase 1 (ICS1; AK120689) is putatively involved in SA biosynthesis in rice by the iso-chorismate pathway [32]. The expression of LOX and AOS2 was influenced after infection, which showed
similar variation patterns as the variation of JA levels in both Minghui 63 and Zhenshan 97 (Figure 3).PAL1and ICS1also showed expression patterns similar to the var-iation of SA levels in the two rice varieties (Figure 3). The gene expression results further confirmed the relia-bility of the quantification data.
Previous reports suggest that multiple JA- and SA-associated pathways may be involved in rice resistance againstXoo. For example, overexpressingMPK6or sup-pressing WRKY45-1 or EDR1 enhances rice resistance accompanied by activation of both JA and SA signaling [33,50,51]. However, overexpressing WRKY13 or sup-pressing OsDR10orMPK6enhances rice resistance that is accompanied by activation of SA signaling and sup-pression of JA signaling [32,50,52,53]. In contrast, over-expressing WRKY45-2 enhances resistance that is associated with activation of JA signaling but not SA signaling [33]. The opposite JA and SA levels at some time points of the resistance reaction as compared to their levels in susceptible reaction suggest that the JA-and SA-dependent pathways may function antagonisti-cally in rice resistance to Xoo. According to this infer-ence and previous reports [32,33,50-53], we argue that the JA-and SA-dependent pathways may have crisscross roles in rice-Xoointeractions.
The IAA-dependent pathway may act antagonistically to the SA-dependent defense pathway in Arabidopsis-pathogen interaction; SA-mediated plant immunity accompanies the repression of the auxin signaling in Arabidopsis [20,54]. However, the dynamic profiling of IAA and SA afterXoo infection did not show obvious antagonistic interaction (Figures 2 and 3). Previous stu-dies have also revealed that enhancing rice resistance to Xooby suppressing IAA signaling does not require acti-vation of SA signaling [16,17]. These results suggest that in rice-pathogen interaction, IAA signaling and SA sig-naling may interact in a different way from that in Arabidopsis.
Phytoalexins
the precursor of sakuranetin [40]. After infection, the sakuranetin and naringenin levels were rapidly increased at 1 h, return to the basal levels at 2 h, and markedly increased again at 7 d in Minghui 63, but no such induction was detected in susceptible Zhenshan 97.CHS (X89859) encodes chalcone synthase that catalyzes the
first step in the biosynthesis of flavonoids [58,59]. The expression ofCHSshowed a similar variation pattern as the patterns of sakuranetin and naringenin levels in response toXooinfection (Figure 4).
The differentially increased accumulation of sakurane-tin and naringenin in the resistance reaction but not in
Time after Xoo infection (hour)
Minghui 63 (resistant)
Zhenshan 97 (susceptible) 0
5 10 15 20 25
SA
SA and its biosynthesis-related genes
Con
cen
tration
(u
g/g
FW
)
ICS1
0.0 0.5 1.0 1.5 2.0 2.5 3.0
Relative
ex
pr
ession
lev
el
PAL1
ck 0.5 1 2 12 24 72 168 0.0
0.5 1.0 1.5 2.0 2.5 3.0
Relative
ex
pression
lev
el
C
oncent
rat
io
n
(n
g/g
FW
)
100 200 300 400
0
JA
JA, JA metabolites, and JA biosynthesis-related genes
LOX
0.0 0.4 0.8 1.2 1.6
ck 0.5 1 2
0 10 20 30 40 50 60 70
Relat
ive
ex
pr
ession
lev
el
ck 0.5 1 2 12 24 72 168 AOS2
0 1 2 3 4 5
ck 0.5 1 2
0 20 40 60 80
Relative
ex
pression
lev
el
JA-Ile
Co
ncen
tration
(n
g/g
FW
)
0 200 400 600
0 2 4 6 8
Co
ncen
tration
(n
g/g
FW
) MeJA
the susceptible reaction suggest that the two flavonoid phytoalexins may be involved in Xooresistance in the present experimental conditions. This inference is also supported by the evidence that naringenin displayed growth inhibition of Xooin culture [41]. The terpenoid phytoalexin momilactone A can inhibit the growth of rice fungal pathogenM. oryzae[39,40,55], but its role in rice resistance toXoois not clear. AlthoughXoo infec-tion increased the accumulainfec-tion of momilactone A in both resistant and susceptible rice plants, the concentra-tions of momilactone A in the two rice varieties showed no significant difference (P > 0.05) at 7 d after infection. In addition, rice WRKY13-mediatedXoo resistance does not accompany increased accumulation of momilactone A [52]. Thus, the role of momilactone A in rice-Xoo interaction remains to be elucidated.
The flavonoid phytoalexins are synthesized via a branch, which is different from the branch for SA bio-synthesis, in the phenylpropanoid pathway [52]. PAL is an important enzyme upstream of the two branches in this pathway. The PAL1 showed a 4.6-fold higher expression level in resistant Minghui 63 than that in
susceptible Zhenshan 97, but the SA level in the former was significantly lower (P< 0.05) than that in the latter at 7 d after infection (Figure 3). This may be explained by the fact that the phenylpropanoid pathway largely contributes to the biosynthesis of phytoalexins in the resistant reaction (Figure 4).
Conclusion
In comparison with published methods [24-28], the advantage of the present method is the convenient and inexpensive procedure for preparing filtrated crude extracted samples, which does not require a complicated procedure of sample derivatization or has less damage to the columns of the LC-ESI-MS/MS system. Further-more, this convenient sample preparation method can be used for simultaneous quantification of multiple phy-tohormones and metabolites that have different polarity. By simultaneous quantification of multiple hormones and their metabolites and phytoalexins using this method and considering previous reports, we suggest that the JA- and SA-dependent pathways may function antagonistically in rice resistance toXoo; however, the ck 0.5 1 2 12 24 72 168
0 10 20
30 Naringenin
ck 0.5 1 2 12 24 72 168 0
1 2 3 4
Momilactone A
0 15 30
45 Sakuranetin
Minghui 63 (resistant) Zhenshan 97 (susceptible)
C
onc
ent
ra
ti
on
(n
g/g
FW
)
0 2 4 6 8 10 12
KSL4
Relat
ive
ex
pr
ession
lev
el
0 2 4 6 8 CPS4
Co
nc
en
tra
tion
(n
g/g
FW
)
Momilactone A and its biosynthesis-related genes
Co
nc
en
tra
tion
(n
g/g
FW
)
Time after Xoo infection (hour)
Sakuranetin and naringenin and their biosynthesis-related gene
Relat
ive
ex
pression
lev
el
0 1 2 3 4 CHS
Relative
ex
pression
lev
el
two pathways may have crisscross roles in the rice-Xoo interaction. In addition, at late infection, the phenylpro-panoid pathway may largely contribute to the biosynth-esis of flavonoid phytoalexins that can directly inhibit Xoogrowth other than the biosynthesis of SA.
Methods Chemicals
The standard IAA, IAA-Asp, JA, MeJA, and SA were purchased from Sigma-Aldrich (St. Louis, MO, USA), and ABA and JA-Ile were from OlChemIm (OlChemIm, Olomouc, Czech Republic). The internal standards were
2
H6ABA (Olchemin) for ABA, 10-dihydro-JA (DHJA;
Olchemin) for JA, JA-Ile, and MeJA, D2-IAA
(Sigma-Aldrich) for IAA and IAA-Asp, and naphthalene acetic acid (NAA; internal standards) for SA. The standard momilactone A was kindly provided by Dr. Morifumi Hasegawa of College of Agriculture, Ibaraki University. The standard naringenin and sakuranetin were pur-chased from Extrasynthèse (Genay, France).
Bacterial inoculation
Rice varieties (Oryza sativassp. indica) Minghui 63 and Zhenshan 97 were inoculated withXoo strain PXO61 by leaf-clipping method at booting (panicle development) stage [42]. Disease was scored by measuring the percen-tage disease area (lesion length/leaf length) at 2 weeks after inoculation. The 2-cm leaf fragments next to bac-terial infection sites were collected and stored at -70°C for preparing samples for UFLC-ESI-MS/MS analysis and gene expression analyses.
Sample preparation
Samples were prepared using a modified crude extrac-tion procedure that was originally reported by Pan et al. [27]. Three replicates of each frozen leaf sample (~100 mg for each replicate) were ground to a fine power in liquid nitrogen using a mortar and pestle. Each sample was weighed into a 1.5-mL tube, mixed with 750 μL cold extraction buffer (methanol:water:acetic acid, 80:19:1, v/v/v) supplemented with internal standards, 10 ng2H6ABA, 10 ng DHJA, 5 ng D2-IAA, and 3μg NAA,
vigorously shaken on a shaking bed for 16 h at 4°C in dark, and then centrifuged at 13,000 rpm for 15 min at 4°C. The supernatant was carefully transferred to a new 1.5-mL tube and the pellet was remixed with 400 μL extraction buffer, shaken for 4 h at 4°C, and centrifuged. The two supernatants were combined and filtered using a syringe-facilitated 13-mm diameter nylon filter with pore size 0.22μm (Nylon 66; Jinteng Experiment Equip-ment Co., Ltd, Tianjing, China). The filtrate was dried by evaporation under the flow of nitrogen gas for approximately 4 h at room temperature, and then dis-solved in 200 μL methanol. A aliquot of dissolved
sample was further diluted 100 times using methanol for quantification of SA, because rice contains a high level of SA.
To determine whether different types of filters would influence the recovery rates of analytes, each standard (5 ng) was added into a 1.5-mL tube, mixed with the same amount of cold extraction buffer, vigorously shaken on a shaking bed, and centrifuged as described above. The samples were then filtered using a nylon filer or a syr-inge-facilitated 13-mm diameter cellulose filter with pore size 0.22 μm (MCE; Navigator Lab Instrument Co., Ltd, Tianjing, China). The filtrates were dried and then dissolved in methanol as described above.
For comparison, samples were also prepared using a solid-phase extraction procedure [16]. In brief, ground sample powder was mixed with 2 ml extraction buffer and shaken on a shaking bed for 16 h as for the above-described preparation for crude extraction, and then centrifuged at 3500 g for 15 min at 4°C for collecting the supernatant. The supernatant was purified using a C18-SepPak cartridge (Waters Corporation, Milford, MA, USA) by a series of steps. The purified sample was dried by evaporation and then dissolved in 200 μL of methanol as described above for preparation for the crude extraction.
UFLC-ESI-MS/MS
Liquid chromatography was carried out using a UFLC with an autosampler (Shimadzu Corporation, Kyoto, Japan). A Waters Atlantis T3 (Waters Corporation) col-umn (2.1 × 150 cm, 3μm) was used at ambient tem-perature. The injected volume of sample was 10μL. The elution gradient was carried out with binary solvent sys-tem consisting of 0.02% acetic acid in H2O (solvent A)
and 0.02% acetic acid in MeCN (solvent B) at a constant flow rate of 250μL/min. A linear gradient profile with the following proportions (v/v) of solvent B was applied: gradient profile 0 to 5 min and 0% of B, 5 to 8 min and 0% to 16% of B, 8 to 20 min and 16% to 100% of B, 20 to 25 min and 100% of B, 25 to 28 min and 100% to 0% of B, and 28 to 32 min with 4 min for re-equilibration and 0% of B.
analyzed in the positive mode. The mixtures of standard compounds were separated by reversed-phase UFLC and analyzed by ESI-MS/MS in the MRM mode with 50 ms dwell time, 5 ms of pause time between mass ranges, and 700 ms of settle time for switching polarities. The identities of phytohormones and metabolites in the crude plant extracts were confirmed by analysis of pro-duct ion fragments obtained by the hybrid triple quad-rupole/linear ion trap mass spectrometer, operating in the IDA mode, with a source voltage of 4.5 kV and source temperature of 550. In the ‘’Enhanced Product Ion” scan mode, precursor ions were fragmented with collision energy +25 kV or -25 kV and products in the range of 50 to 500 m/z were detected.
UFLC-ESI-MS/MS assays were repeated twice biologi-cally, with each repetition having three replicates. Simi-lar results were obtained in repeated experiments; only the result in one repetition was presented.
Gene expression analyses
Quantitative reverse transcription-polymerase chain reaction (qRT-PCR) was performed as described pre-viously [32]. The gene-specific primers are listed in Additional file 1, Table S2. The expression level of actin gene was first used to standardize the RNA sample for each qRT-PCR. The expression level relative to control was then presented. For each gene, qRT-PCR assays were repeated twice biologically, with each repetition having three replicates. Similar results were obtained in repeated experiments; only the result in one repetition was presented.
Statistical analysis
The significant differences between control and treat-ment of the samples were analyzed by the pair-wise t test installed in the Microsoft Office Excel program.
Additional material
Additional file 1: Figure S1 Representative LC chromatograms of analytes and their internal standards. Figure S2 Representative MS fragmentation patterns of analytes. Table S1 Recovery of analytes in standard-containing samples prepared using different filters and in rice samples. Table S2 Primers used for quantitative reverse-transcription-PCR analysis.
Acknowledgements
This work was supported by grants from the National Natural Science Foundation of China (30930063) and the National Program of High Technology Development of China (2012AA100103).
Authors’contributions
HL performed LC-ESI-MS and gene expression analyses and drafted the manuscript. XL and JX provided molecular analysis support. SW contributed to data interpretation and to writing the manuscript. All authors read and approved the final manuscript.
Competing interests
The authors declare that they have no competing interests.
Received: 28 September 2011 Accepted: 15 January 2012 Published: 15 January 2012
References
1. Jun JH, Fiume E, Fletcher JC:The CLE family of plant polypeptide signaling molecules.Cell Mol Life Sci2008,65:743-755.
2. Santner A, Estelle M:Recent advances and emerging trends in plant hormone signalling.Nature2009,459:1071-1078.
3. Nambara E, Marion-Poll A:Abscisic acid biosynthesis and catabolism.
Annu Rev Plant Biol2005,56:165-185.
4. Ljun K, Hul AK, Kowalczyk M, Marchant A, Celenza J, Cohen JD, Sandberg G:
Biosynthesis, conjugation, catabolism and homeostasis of indole-3-acetic acid inArabidopsis thaliana.Plant Mol Biol2002,50:309-332.
5. Miersch O, Neumerkel J, Dippe M, Stenzel I, Wasternack C:Hydroxylated jasmonates are commonly occurring metabolites of jasmonic acid and contribute to a partial switch-off in jasmonate signaling.New Phytol 2008,177:114-127.
6. Mok DW, Mok MC:Cytokinin metabolism and action. Annu. Rev. Plant Physiol.Plant Mol Biol2001,52:89-118.
7. Woodward AW, Bartel B:Auxin: regulation, action, and interaction.Ann Bot (Lond)2005,95:707-735.
8. Gfeller A, Dubugnon L, Llechtl R, Farmer EE:Jasmonate biochemical pathway.Sci Signal2010,3:cm3.
9. Gfeller A, Llechtl R, Farmer EE:Arabidopsisjasmonate signaling pathway.
Sci Signal2010,3:cm4.
10. Pieterse CM, Leon-Reyes A, Van der Ent S, Van Wees SC:Networking by small-molecule hormones in plant immunity.Nat Chem Biol2009,
5:308-316.
11. Robert-Seilaniantz A, Navarro L, Bari R, Jones JD:Pathological hormone imbalances.Curr Opin Plant Biol2007,10:372-379.
12. Kuppusamy KT, Walcher CL, Nemhauser JL:Cross-regulatory mechanisms in hormone signaling.Plant Mol Biol2009,69:375-381.
13. Grant MR, Jones JDG:Hormone (dis)harmony moulds plant heath and disease.Science2009,324:750-752.
14. Kazan K, Manners JM:Linking development to defense: auxin in plant-pathogen interactions.Trends Plant Sci2009,14:373-382.
15. Navarro L, Dunoyer P, Jay F, Arnold B, Dharmasiri N, Estelle M, Voinnet O, Jones JD:A plant miRNA contributes to antibacterial resistance by repressing auxin signaling.Science2006,312:436-439.
16. Ding X, Cao Y, Huang L, Zhao J, Xu C, Li X, Wang S:Activation of the indole-3-acetic acid-amido synthetase GH3-8 suppresses expansin expression and promotes salicylate- and jasmonate-independent basal immunity in rice.Plant Cell2008,20:228-240.
17. Fu J, Liu H, Li Y, Yu H, Li X, Xiao J, Wang S:Manipulating broad-spectrum disease resistance by suppressing pathogen-induced auxin
accumulation in rice.Plant Physiol2011,155:589-602.
18. Tiryaki I, Staswick PE:An Arabidopsis mutant defective in jasmonate response is allelic to the auxin-signaling mutantaxr1.Plant Physiol2002,
130:887-894.
19. Llorente F, Muskett P, Vallet A, López G, Ramos B, Sánchez-Rodríguez C, Jordá L, Parker J, Molina A:Repression of the auxin response pathway increasesArabidopsissusceptibility to necrotrophic fungi.Mol Plant2008,1:496-509.
20. Wang D, Pajerowska-Mukhtar K, Culler AH, Dong X:Salicylic acid inhibits pathogen growth in plants through repression of the auxin signaling pathway.Curr Biol2007,17:84-1790.
21. Verslues PE, Zhu JK:Before and beyond ABA: upstream sensing and internal signals that determine ABA accumulation and response under abiotic stress.Biochem Soc Trans2005,33:375-379.
22. Ton J, Flors V, Mauch-Mani B:The multifaceted role of ABA in disease resistance.Trends Plant Sci2009,14:310-317.
23. Bari R, Jones JD:Role of plant hormones in plant defence responses.
Plant Mol Biol2009,69:473-488.
24. Müller A, Düchting P, Weiler EW:A multiplex GC-MS/MS technique for the sensitive and quantitative single-run analysis of acidic phytohormones and related compounds, and its application toArabidopsis thaliana.
25. Durgbanshi A, Arbona V, Pozo O, Miersch O, Sancho JV, Gómez-Cadenas A:
Simultaneous determination of multiple phytohormones in plant extracts by liquid chromatography-electrospray tandem mass spectrometry.J Agric Food Chem2005,53:8437-8442.
26. Forcat S, Bennett MH, Mansfield JW, Grant MR:A rapid and robust method for simultaneously measuring changes in the phytohormones ABA, JA and SA in plants following biotic and abiotic stress.Plant Methods2008,
3:4-16.
27. Pan XQ, Welti R, Wang XM:Simultaneous quantification of major phytohormones and related compounds in crude plant extracts by liquid chromatography-electrospray tandem mass spectrometry.
Phytochemistry2008,69:1773-1781.
28. Kojima M, Kamada-Nobusada T, Komatsu H, Takei K, Kuroha T, Mizutani M, Ashikari M, Ueguchi-Tanaka M, Matsuoka M, Suzuki K, Sakakibara H:Highly sensitive and high-throughput analysis of plant hormones using MS-probe modification and liquid chromatography-tandem mass spectrometry: an application for hormone profiling inOryza sativa.Plant Cell Physiol2009,50:1201-1214.
29. Gonzalez-Lamothe R, Mitchell G, Gattuso M, Diarra MS, Malouin F, Bouarab K:Plant antimicrobial agents and their effects on plant and human pathogens.Int J Mol Sci2009,10:3400-3419.
30. Edlund A, Eklof S, Sundberg B, Moritz T, Sandberg G:A microscale technique for gas chromatography-mass spectrometry measurements of picogram amounts of indole-3-acetic acid in plant tissues.Plant Physiol 1995,108:1043-1047.
31. Kowalczyk M, Sandberg G:Quantitative analysis of indole-3-acetic acid metabolites in Arabidopsis.Plant Physiol2001,127:1845-1853. 32. Qiu D, Xiao J, Ding X, Xiong M, Cai M, Cao Y, Li X, Xu C, Wang S:
OsWRKY13 mediates rice disease resistance by regulating defense-related genes in salicylate- and jasmonate-dependent signaling.Mol Plant Microbe Interact2007,20:492-499.
33. Tao Z, Liu H, Qiu D, Zhou Y, Li X, Xu C, Wang S:A pair of allelic WRKY genes play opposite role in rice-bacteria interactions.Plant Physiol2009,
151:936-948.
34. Jiang CJ, Shimono M, Sugano S, Kojima M, Yazawa K, Yoshida R, Inoue H, Hayashi N, Sakakibara H, Takatsuji H:Abscisic acid interacts
antagonistically with salicylic acid signaling pathway in
rice-Magnaporthe griseainteraction.Mol Plant Microbe Interact2010,
23(7):91-798.
35. Ludwig-Müller J:Auxin conjugates: their role for plant development and in the evolution of land plants.J Exp Bot2011,62:1757-1773.
36. Nomura K, Melotto M, He SY:Suppression of host defense in compatible plant-Pseudomonas syringaeinteractions.Curr Opin Plant Biol2005,
8:361-368.
37. Svoboda J, Boland W:Plant defense elicitors: Analogues of jasmonoyl-isoleucine conjugate.Phytochemistry2010,71:1445-1449.
38. Zulak KG, Bohlmann J:Terpenoid biosynthesis and specialized vascular cells of conifer defense.J Integr Plant Biol2010,52:86-97.
39. Dillon VM, Overton J, Grayer RJ, Harborne JB:Differences in phytoalexin response among rice cultivars of different resistance to blast.
Phytochemistry1997,44:599-603.
40. Grayer RJ, Kokubun T:Plant-fungal interactions: the search for phytoalexins and other antifungal compounds from higher plants.
Phytochemistry2001,56:253-263.
41. Padmavati M, Santhivel N, Thara KV, Reddy AR:Differential sensitivity of rice pathogens to growth inhibition by flavonoids.Phytochemistry1997,
46:449-502.
42. Chen H, Wang S, Zhang Q:New gene for bacterial blight resistance in rice located on chromosome 12 identified from Minghui 63, an elite restorer line.Phytopathology2002,92:750-754.
43. Sun X, Cao Y, Yang Z, Xu C, Li X, Wang S, Zhang Q:Xa26, a gene conferring resistance toXanthomonas oryzaepv.oryzaein rice, encoding a LRR receptor kinase-like protein.Plant J2004,37:517-527. 44. Xiang Y, Cao Y, Xu C, Li X, Wang S:Xa3, conferring resistance for rice
bacterial blight and encoding a receptor kinase-like protein, is the same asXa26.Theor Appl Genet2006,113:1347-1355.
45. Liu Q, Yuan M, Zhou Y, Li X, Xiao J, Wang S:A paralog of the MtN3/saliva family recessively confers race-specific resistance toXanthomonas oryzae
in rice.Plant Cell Environ2011,34:1958-1569.
46. Agrawal GK, Yamazaki M, Kobayashi M, Hirochika R, Miyao A, Hirochika H:
Screening of the rice viviparous mutants generated by endogenous
retrotransposon Tos17 insertion. Tagging of a zeaxanthin epoxidase gene and a novel ostatc gene.Plant Physiol2001,125:1248-1257. 47. Zhu G, Ye N, Zhang J:Glucose-induced delay of seed germination in rice
is mediated by the suppression of ABA catabolism rather than an enhancement of ABA biosynthesis.Plant Cell Physiol2009,50:644-651. 48. Koga H, Dohi K, Mori M:Abscisic acid and low temperatures suppress the
whole plant-specific resistance reaction of rice plants to the infection of
Magnaporthe grisea.Physiol Mol Plant Pathol2005,65:3-9.
49. Seo YS, Chern M, Bartley LE, Han M, Jung KH, Lee I, Walia H, Richter T, Xu X, Cao P, Bai W, Ramanan R, Amonpant F, Arul L, Canlas PE, Ruan R, Park CJ, Chen X, Hwang S, Jeon JS, Ronald PC:Towards establishment of a rice stress response interactome.PLoS Genet2011,7:41002020.
50. Shen X, Yuan B, Liu H, Li X, Xu C, Wang S:Opposite functions of a rice mitogen-activated protein kinase during the process of resistance againstXanthomonas oryzae.Plant J2010,64:86-99.
51. Shen X, Liu H, Yuan B, Li X, Xu C, Wang S:OsEDR1 negatively regulates rice bacterial resistance via activation of ethylene biosynthesis.Plant Cell Environ2011,34:179-191.
52. Qiu D, Xiao J, Xie W, Liu H, Li X, Xiong L, Wang S:Rice gene network inferred from expression profiling of plants overexpressingOsWRKY13, a positive regulator of disease resistance.Mol Plant2008,1:538-551. 53. Xiao W, Liu H, Li Y, Li X, Xu C, Long M, Wang S:A rice gene ofde novo
origin negatively regulates pathogen-induced defense response.PLoS ONE2009,4:e4603.
54. Chen Z, Agnew JL, Cohen JD, He P, Shan L, Sheen J, Kunkel BN: Pseudomonas syringaetype III effector AvrRpt2 altersArabidopsis thalianaauxin physiology.Proc Natl Acad Sci USA2007,104:20131-20136. 55. Hasegawa M, Mitsuhara I, Seo S, Imai T, Koga J, Okada K, Yamane H,
Ohashi Y:Phytoalexin accumulation in the interaction between rice and the blast fungus.Mol Plant Microbe Interact2010,23:1000-1011. 56. Wilderman PR, Xu M, Jin Y, Coates RM, Peters RJ:Identification of
syn-pimara-7,15-diene synthase reveals functional clustering of terpene synthases involved in rice phytoalexin/allelochemical biosynthesis.Plant Physiol2004,135:2098-2105.
57. Shimizu T, Jikumaru Y, Okada A, Okada K, Koga J, Umemura K, Minami E, Shibuya N, Hasegawa M, Kodama O, Nojiri H, Yamane H:Effects of a bile acid elicitor, cholic acid, on the biosynthesis of diterpenoid phytoalexins in suspension-cultured rice cells.Phytochemistry2008,69:973-981. 58. Scheffler BE, Reddy A, Hoffmann I, Wienand U:Chalcone synthase cDNA
from rice (Oryza sativa).Plant Physiol1995,109:722-722.
59. Winkel-Shirley B:Biosynthesis of flavonoids and effects of stress.Curr Opin Plant Biol2002,5:218-223.
doi:10.1186/1746-4811-8-2
Cite this article as:Liuet al.:A convenient method for simultaneous quantification of multiple phytohormones and metabolites: application in study of rice-bacterium interaction.Plant Methods20128:2.
Submit your next manuscript to BioMed Central and take full advantage of:
• Convenient online submission
• Thorough peer review
• No space constraints or color figure charges
• Immediate publication on acceptance
• Inclusion in PubMed, CAS, Scopus and Google Scholar
• Research which is freely available for redistribution