Proposing a New Model for Waste Dump Site Selection: Case Study of Ayerma
Phosphate Mine
Shahram Shariati
1, Abdolreza Yazdani-Chamzini
2, Armin Salsani
3,
Jolanta Tamosaitiene
41
Department of Geology, Sari branch, Islamic Azad University Sari, Iran
E-mail. [email protected]; shariati@ayerma
2
Young Researchers Club, South Tehran Branch, Islamic Azad University Tehran, Iran
E-mail. [email protected]; [email protected]
3
Department of Geology, Faculty of Science, University of Kharazmi Tehran, Iran
E-mail. [email protected]; [email protected]
4
Vilnius Gediminas Technical University Sauletekio al. 11, LT-10223, Vilnius, Lithuania E-mail. [email protected]
The purpose of developing a mining project is to meet the demand for metals and minerals resources. This is obviously connected with the generation of a considerable volume of waste. However, one of the most important strategies in waste management is to select the optimum waste dump site. To face with this problem, managers go in search of the techniques that not only can consider the technical and economic factors but also take into account environmental aspects to get a better perspective on the problem under consideration. The merit of using multicriteria decision making (MCDM) model is to consider different criteria. One of the most standard techniques used for the formulation of a complex problem under different criteria is Additive Ratio ASsessment (ARAS). In this paper, the ARAS based group decision making (GARAS) for evaluating the possible alternatives under partial or incomplete information is proposed. The proposed model contains three main stages: (i) identifying the main and sub-criteria, (ii) evaluating the feasible alternative by using fuzzy GARAS technique, and (iii) conducting a sensitivity analysis to determine how the importance weights influence the process of the decision making. To demonstrate the potential application of the proposed model, a real case study is illustrated. The strength of the proposed model is its effectiveness and capability to produce proper solutions under the inherent uncertainty involved in the process of modeling a real-life problem.
Keywords:Waste Dump Selection, MCDM, Fuzzy GARAS, Ayerma Phosphate Project. Introduction
Mining and its downstream industries play significant roles in most countries. Mining industry is influenced by a large number of laws and regulations owing to its unique features like mine waste, land subsidence, and environmental, water and air contaminations. In fact, mine wastes represent the highest proportion of waste produced by industrial activity, billions of tones being annually produced. Since the wastes comprise hazardous substances (e.g. acids and heavy metals), they are problematic and challengeable. Based on the study conducted over the recent century, mine wastes are one of the most dangerous structures that have been known to be the cause of death for more than 1000 innocent people over the past 80 years (Blight, 2010). These show that the wastes often require monitoring, control, management, and safe disposal of dangerous wastes. The main problem in mines is that the waste produced by mining operation causes awful conditions from technical and environmental points of view.
Selecting a location is an actual nowadays problem, which is analysed by many authors. Bagocius et al., 2014a)
analysed the selecting a location for a liquefied natural gas terminal in the Estern Baltic sea and Multi-person selection of the best wind turbine (Bagocius et al., 2014b; Hashemkhani Zolfani et al., 2013) presented model in shopping mall locating, (Hashemkhani Zolfani et al., 2012) presented Quality control manager selection processes, (Rezaeiniya et al., 2012) presented the Greenhouse locating, (Aghdaie et al., 2012) presented the prioritizing constructing projects of municipalities, (Peldschus et al., 2010) prepared the model of sustainable assessment of construction site (Turskis & Zavadskas, 2010) selected the logistic centers location.
these main and sub-criteria are in conflict with each other; therefore, the problem of selecting the waste dump site can be considered as a multi-criteria decision making (MCDM) issue.
The process of modeling an MCDM problem comprises a ten-step procedure: (1) define the problem under consideration, (2) identify decision makers or evaluators, (3) recognize the main or sub-criteria, (4) define the feasible alternatives, (5) select the MCDM technique(s), (6) calculate the importance weights of the criteria, (7) assess the performance of the alternatives with respect to the criteria under consideration by using the selected MCDM technique, (8) transfer the performance ratings of alternatives into commensurable units, if required, (9) conduct sensitivity analysis, and (10) make the final decision. Different algorithms are developed to solve the MCDM problem (Kaplinski 2009; Kaplinski & Tamosaitiene 2010; Zavadskas & Turskis 2011; Kaplinski & Tupenaite, 2011; Ruzgys et al., 2014). Additive Ratio Assessment (ARAS) is one of the most recently developed methods of solving a sophisticated and complex problem (Zavadskas & Turskis, 2010). This technique utilizes a utility function value, determining the complex relative efficiency of a feasible alternative, for prioritizing a finite number of feasible alternatives. The utility function value is directly proportional to the relative effect of values and weights of the main criteria under consideration (Zavadskas & Turskis, 2010). The ARAS method has been used by different research (Zavadskas et al., 2010; Zavadskas & Turskis, 2010; Bakshi & Sarkar, 2011; Bakshi & Sinharay, 2011; Dadelo et al., 2012; Zavadskas et al., 2012; Kutut et al., 2013) because of having a number of advantages: (i) the computations defined in the process of modeling the MCDM problem are straightforward; (ii) the concepts have a profound logic (iii) this method contains a simple mathematical form in the pursuit of the best alternative, and (iv) the relative weights are incorporated into the comparison procedures.
However, in case of less or lack of information, all of the criteria and sub-criteria cannot be completely considered as effective factors in selecting the best alternative. This leads to an inherent uncertainty in the process of modeling. The uncertainty arises from two key sources: the uncertainty associated with the model parameters, and the structure of the model. The former is due to the fact that often criteria are ill-defined or unknown or immeasurable owing to lack of knowledge. The latter results from the structure of mathematical models that are employed to represent scenarios, and processes of interest are often a key source of uncertainty, due to the fact that models are only a simplified representation of a real-world system (Sadiq et al., 2004).
In order to handle the uncertainty involved in the process of modeling, several techniques have been employed. Fuzzy logic, one of the most popular techniques in handling the inherent uncertainty, is a powerful mathematical tool for translating inaccurate and qualitative knowledge into numerical reasoning. This method is widely used for modeling a large number of practical and engineering problems, especially mining and tunneling issues like roof fall, tunneling risk management, equipment selection, maintenance strategy selection, mining strategy,
shaft sinking selection, and road header performance. This method demonstrates its worth and potential application as engineering and practical problem-solving tool.
However, the ARAS technique is not capable of dealing with vague and uncertain problems involved in the process of modeling. Thus, without considering the inherent random uncertainty and/or imprecision of the parameter, the results are unrealistic and could result in unreliable assessment. The merit of using fuzzy logic is to take into account the uncertainty and to receive results more adapted to the real world problems. Therefore, fuzzy ARAS is employed to solve the problem of priority in decision making issues (Turskis & Zavadskas, 2010; Turskis et al., 2012).
The main purpose of this paper is to develop a model based on fuzzy group ARAS for evaluating and selecting the best waste dump site in Ayerma phosphate mine located in Yasouj, Iran. The Ayerma phosphate is a major phosphate-producing region and phosphate mining has been an important industry in the area. The process of phosphate extraction from the earth contains an underground mining operation. This deposit comprises an area with about 39 km2 constituting a NW-SE trending symmetrical anticline including Kazhdumi, Sarvak, Gurpi, Pabdeh, Asmari, Gachsaran, and Quaternary formations.
Fuzzy Set Theory
Fuzzy logic, a branch of soft computing techniques, uses heuristic algorithms to provide rational solutions for complex problems. This mathematical tool employs linguistic terms instead of numerical values to describe a system or process. Fuzzy logic, introduced by Zadeh (1996), is capable of computing with words. Therefore, this method has a key importance for many problems related to real world complexity.
When evaluating elements in sophisticated systems, decision makers or evaluators often like to evaluate alternatives or criteria in terms of linguistic variables such as very low, low, medium, high, and very high. Fuzzy logic is capable of dealing with the uncertainty and vagueness involved in the process of modeling. This technique uses the form of interval analysis to handle inaccurate information. A fuzzy set is a general form of the Boolean set theory, in which
x
is either a member of setA or not; whereas, a fuzzy number belongs to the closed interval 0 and 1, which 1 addresses full membership and 0 expresses non-membership.Fuzzy GARAS Technique
Additive Ratio Assessment (ARAS), introduced by Zavadskas & Turskis (2010), is based on the concept that the phenomena of complicated world could be understood by using simple relative comparisons (Turskis & Zavadskas, 2010). The ARAS method not only determines the performance of alternatives, but also calculates ratio of each alternative to the ideal alternative (Turskis et al., 2012; Zavadskas, 2013; Rabbani et al., 2014).
determine precise weights for criteria and alternatives with respect to the criteria under consideration (Yazdani Chamzini & Yakhchali, 2012). The merit of using a fuzzy approach is to determine the importance or preference of criteria and alternatives using fuzzy numbers instead of crisp numbers to be more adapted to the real world cases. Therefore, fuzzy logic and ARAS technique are combined in the form of fuzzy ARAS to formulate the real world problems more accurately. On the other hand, the benefit from a group of experts or decision makers is to investigate all relevant aspects of decision making problems (Vahdani et al., 2011). The fuzzy group ARAS (fuzzy GARAS) technique helps the decision team to conduct a comprehensive analysis for prioritizing the preference of the alternatives in presence of vague or imprecise information. The procedure of fuzzy GARAS can be defined as follows.
Step 1. Define the linguistic values for the evaluation criteria and feasible alternatives. In this step, the relative importance of criteria and the preference of alternatives are described by using linguistic variables (as shown in Figure 1) to rank the alternatives with respect to the criteria under consideration.
Step 2. Construct the fuzzy decision matrix. If assume that the number of criteria is
n
and the count of alternatives ism
, fuzzy decision matrix will be obtained withm
rows andn
columns as following matrix:01 0 0
1
1
j n
i ij in
m mj mn
x x x
x x x
X
x x x
(1)
where
x
ijis fuzzy value representing the preference of the ialternative in terms of thej
criterion;x
0jis the optimal value of thej
criterion.Step 3. Aggregate the ratings of alternatives respect to each criterion
(
x
ij)
and fuzzy weights of evaluation criteria(
w
j)
. In order to aggregate the ratings of alternatives versus each criterion and fuzzy weight of each criterion, the arithmetic mean is applied.Let the fuzzy ratings of all decision makers be TFNs
(
,
,
)
ijk ijk ijk ijk
x
a
b
c
, k = 1, 2. . ., K, whichx
ijkrepresents the value of the ith alternative respect to the jth criterion by kth decision maker. Then the aggregated fuzzy rating can be defined as(
,
,
),
1, 2,...,
ij ij ij ijx
a b c
k
K
(2) Where 1
1
k ij ijk ka
a
K
(3) 11
k ij ijk kb
b
K
(4) 11
k ij ijk kc
c
K
(5) Let the fuzzy weights of evaluation criteria be TFNs1 2 3
(
,
,
)
jk jk jk jk
w
w
w
w
; k =1, 2, . . ., K. Then the aggregated fuzzy weight of each criterion can be calculated as:1 2 3
(
,
,
),
1, 2,...,
j j j j
w
w
w
w
k
K
(6) Where 1 1 1
1
k j jk kw
w
K
(7) 2 2 11
k j jk kw
w
K
(8) 3 3 11
k j jk kw
w
K
(9) Step 4. Calculate the optimal value ofj
criterion. It optimal value is unknown, then it can be obtained by using the following equations:max
oj ij
i
x
x
; The larger, the better type (10)min
oj ij
i
x
x
; The smaller, the better type (11) Step 5. Normalize the decision matrix. The ratio to the optimal value is used to avoid the difficulties caused by different dimensions of the criteria. Several algorithms are developed for calculating the ratio to the optimal value. However, the values are usually transferred into the closed interval 0 and 1. The matrix resulted from the normalization process can be defined as follows:(12)
01 0 0
1
1
j n
i ij in
m mj mn
x
x
x
x
x
x
X
x
x
x
The criteria, whose preferable values are maxima, are normalized as follows (Turskis & Zavadskas, 2010):
Step 6. Calculate the weighted normalized decision matrix. The weighted normalized value is calculated by multiplying the weights of the criteria under consideration (
w
j) with the normalized fuzzy decision matrix derived from the previous step. The weighted normalized decision matrix is calculated by the following relations:ˆ
ij ij jx
x w
(15) Step 7. Measure the optimality function. The following equation is employed for determining the values of optimality function of i-th alternative (Turskis & Zavadskas, 2010):
1
ˆ
ni ij j
S
x
(16) The biggest value for
S
iis the best, and the least one is the worst.Step 8. Defuzzify the values of optimality function. The output obtained for each alternative is a fuzzy number. Therefore, it is necessary to convert fuzzy numbers into crisp numbers by defuzzification in order to compare the rank of dimensions. The procedure of defuzzification is to locate the Best Nonfuzzy Performance (BNP) value. Methods of such defuzzified fuzzy ranking generally include mean of maximal (MOM), center of area (COA), and -cut (Chen et al., 2011). In this study, the authors employ the center of area (COA) method to prioritize the order of importance of each dimension. This method is a simple and practical without the need to bring in the preferences of any evaluators (Wu et al., 2009). The BNP value for the fuzzy number
S
i
(
LS MS US
i,
i,
i)
can befound by using the following equation:
[(
) (
)] / 3
i i i i i i
BNP
US
LS
MS
LS
LS
(17) Step 9. Calculate the degree of the alternative utility by making a comparison with the optimum oneS
0. The utility degree of an alternative can be calculated by the following equation:0
i i
S
K
S
(18)
From mathematical point of view, the values acquired for
K
ibelong to the range of [0,1].Step 10. Rank the alternatives according to
K
i in descending order and select the alternative with maximum value ofK
i.The Proposed Model Approach
The proposed model for evaluation of waste dump sites with respect to the evaluation criteria under consideration comprises three main stages.
1. Identifying the evaluation criteria.
2. Evaluating the feasible alternatives and selecting the best one.
3. Performing sensitivity analysis to analyze the robustness of the alternative priority.
The text sounds better when the same word forms or parts of speech are used when smth is listed, or even in the same sentence.
These steps are briefly described below.
In stage 1, criteria that support the goals of decision making must be selected. Therefore, the feasible alternatives and the evaluation criteria are identified. In order to identify the evaluation criteria, a wide range of options should be firstly recognized; then, each one should be comprehensively analyzed; finally, the most important factors must be selected. A common technique for selecting the most critical parameters is to analyze the impact of each criterion on other criteria. According to the selection of the appropriate criteria can properly reflect the performance of the alternatives evaluated in a logical manner, this stage plays a critical role in the process of prioritization.
To calculate the relative weights of the indicators, the decision matrices for the main and sub-criteria are formed in the second stage. In order to determine the importance weights of the evaluation criteria and the preference ratings of the alternatives, experts form the decision matrices for both indicators and alternatives by using the scale given in Table 1. Using the arithmetic mean, the evaluations established by different decision makers are aggregated into the final matrix to computation be conducted based on this final matrix.
Table 1 Membership function of linguistic scale
Importance Rating
Linguistic value Fuzzy number Linguistic value Fuzzy number
Very low (VL) (0.00,0.10,0.25) Very poor (VP) (0.0,1.0,2.5)
Low (L) (0.15,0.30,0.45) Poor (P) (1.5,3.0,4.5)
Medium (M) (0.35,0.50,0.65) Fair (F) (3.5,5.0,6.5)
High (H) (0.55,0.70,0.85) Good (G) (5.5,7.0,8.5)
Very high (VH) (0.75,0.90,1.00) Very good (VG) (7.5,9.0,10)
In the last stage, after calculating the final rank of the feasible alternatives, a sensitivity analysis is conducted to evaluate how the relative weights of the evaluation criteria influence the decision making process. Sensitivity analysis helps decision maker to understand how the overall decision is sensitive to small changes in the individual weights. In many situations, in which the definition of the
Figure 1. The proposed algorithm of procedures of Fuzzy GARAS approach
The Implementation of the Proposed Approach
The method described in the previous section is employed for finding a solution for a real-life problem to reflect the potential application of the proposed model.
Ayerma's phosphate deposit with an area of about 39 km2 lies on north-west nose of Lar anticline in south-west of Zagros Mountains (Shariati & Salsani, 2012). Lar Mountains constitutes a NW-SE trending symmetrical anticline including Kazhdumi (Kz), Sarvak (Sa), Gurpi (Gu), Pabdeh (Pa), Asmari (As), Gachsaran (Gs) and Quaternary (Qt) formations. This deposit is situated in about 240 Km north east of Mahshahr port and the biggest sedimentary phosphate reserve in Iran.
According to the 16 Boreholes drilled in a total depth of 4000 Meters and the 35 tranches dug in this anticline with the extrapolation of 150 meters, Ayerma's Phosphate deposit has 81 Million tons of ore with 8,9 % grade P2O5 as a row material. Geologically, this enormous reserve has been located in Pabdeh Formation by the age of Early Eocene-Late Oligocene (Daneshian et al., 2012). This Formation overlies the Gurpi Formation and is disconformably overlain by the Asmari Formation in exploration area. The ore body has strike N45E, the dip varying between 12 to 16 degree towards north and about 13 kilometers in length with average thickness varying between 2–4 meters. The proposed approach for modeling the process of the waste site selection is described as follows.
Stage 1. Identify the evaluation criteria
The primary criteria are recognized from literature review (Hekmat et al., 2008; Rosendal, 2009; Sener et al.,
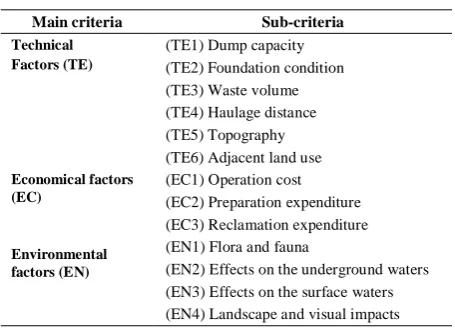
2010; Ekmekcioglu et al., 2010; Moghaddas & Namaghi, 2011; Munawar & Fellner, 2013) and a number of face to face interviews with expert team. After preliminary screening and discussion with the expert team, the most important criteria are determined. Fourteen indicators are identified by using the procedure described above to be considered in the process of the waste site selection. These fourteen criteria are as follows; Dump capacity, Foundation condition, Waste volume, Haulage distance, Topography, Adjacent land use, Operation cost, Preparation expenditure, Reclamation expenditure, Flora and fauna, Effects on the underground waters, Effects on the surface waters, and Landscape and visual impacts. These criteria are classified into three main groups, including technical, economical, and environmental factors. As seen in Table 2, the indicators are classified into three main criteria and fourteen sub-criteria.
Table 2 List of the main and sub-criteria
Main criteria Sub-criteria Technical
Factors (TE)
Economical factors (EC)
Environmental factors (EN)
(TE1) Dump capacity (TE2) Foundation condition (TE3) Waste volume (TE4) Haulage distance (TE5) Topography (TE6) Adjacent land use (EC1) Operation cost (EC2) Preparation expenditure (EC3) Reclamation expenditure (EN1) Flora and fauna
(EN2) Effects on the underground waters (EN3) Effects on the surface waters (EN4) Landscape and visual impacts
Prioritize the feasible alternatives Calculate aggregated fuzzy decision matrix
Construct fuzzy decision matrix
Determine the importance weights of the evaluation criteria Classify the indicators into main groups (main criteria)
Identify the evaluation criteria
Select the optimum waste dump site
From Table 2, it can be seen that criterion TE1, TE2, TE3, TE5, and TE6 are the benefit type criteria that is, the higher the value, the better. The remaining criteria are cost category criteria, that is, the lower the value, the better. The locations of alternatives are “A1”, “A2”, “A3”, and “A4”.
Stage 2. Alternatives evaluation and selection using fuzzy GARAS
In the second step, allocation of linguistic ratings to the evaluation criteria and the feasible alternatives with respect to each criterion is implemented by the decision maker team, including a seven-expert group with a high degree of expertise and experience in waste management. In this manner, different professional skills and educational backgrounds are comprised in the team to make a more comprehensive investigation of the problem.
The linguistic ratings for the criteria and the alternatives are given in Table 1. The final evaluation for the evaluation criteria performed by the decision makers (Di) is presented in Table 3. Then, the linguistic variables are converted into fuzzy numbers. The fuzzy values resulted from previous step are aggregated by using the arithmetic mean method as presented in Table 4. In order to obtain the global weights of the indicators, the values of the main criteria are multiplied with those of sub-criteria as listed in Table 4. The fuzzy values for the indicators are defuzzified to rank them. After defuzzifing the fuzzy values, the final weights of the indicators are normalized by dividing each criterion weight by thesummation of all criteria importance weight as shown in Figure 2 and the last column of Table 4.
Table 3 Importance of the evaluation criteria
Factors D1 D2 D3 D4 D5 D6 D7
Criteria TE L M M M H M M
EC M M H H H M H
EN L L L M M L H
Sub-criteria
TE1 L L VL VL L M L
TE2 VL L L M L VL L
TE3 L VL VL VL VL L VL
TE4 H M M H H H M
TE5 M L L L M L L
TE6 VL VL L VL VL L L
EC1 M M H H M H H
EC2 M H H M H VH H
EC3 VL L L VL L L M
EN1 M M H H M M M
EN2 H VH VH H H H VH
EN3 H H M H H M H
EN4 L L M L L M L
For determination of the best alternative among the feasible alternatives, the fuzzy GARAS method is applied. To achieve the aim, the expert team evaluates the alternatives with respect to the criteria under consideration. After transferring the linguistic values into fuzzy numbers, in order to generate an overall score for the alternatives, the arithmetic mean method is employed to aggregate the ratings as presented in Table 5.
Table 4 Aggregated weights of the criteria
Factors Local aggregated weights Global aggregated weights Final weights
TE 0,350 0,500 0,650 - - - -
EC 0,464 0,614 0,764 - - - -
EN 0,264 0,414 0,564 - - - -
TE1 0,136 0,271 0,421 0,048 0,136 0,274 0,049
TE2 0,136 0,271 0,421 0,048 0,136 0,274 0,049
TE3 0,043 0,157 0,307 0,015 0,079 0,200 0,032
TE4 0,464 0,614 0,764 0,163 0,307 0,497 0,105
TE5 0,207 0,357 0,507 0,073 0,179 0,330 0,063
TE6 0,064 0,186 0,336 0,023 0,093 0,218 0,036
EC1 0,464 0,614 0,764 0,216 0,377 0,584 0,127
EC2 0,521 0,671 0,814 0,242 0,412 0,622 0,138
EC3 0,136 0,271 0,421 0,063 0,167 0,322 0,060
EN1 0,407 0,557 0,707 0,108 0,231 0,399 0,080
EN2 0,636 0,786 0,914 0,168 0,326 0,516 0,109
EN3 0,493 0,643 0,793 0,130 0,266 0,447 0,091
EN4 0,264 0,414 0,564 0,070 0,172 0,318 0,061
After normalizing the decision matrix, the weighted normalized decision matrix is calculated as presented in
Table 6. The optimality function is computed by using Eq. (16) as listed in Table 7.
Table 5 Aggregated evaluation matrix
A0 A1 A2 A3 A4
TE1 (10,10,10) (4.643,6.143,7.571) (4.929,6.429,7.929) (4.929,6.429,7.786) (3.5,5.0,6.5)
TE2 (10,10,10) (5.214,6.714,8.214) (5.214,6.714,8.143) (3.786,5.286,6.786) (4.929,6.429,7.929)
TE3 (10,10,10) (6.357,7.857,9.143) (4.357,5.857,7.357) (6.929,8.429,9.571) (4.071,5.571,7.071)
TE4 (4.071,5.571,7) (4.929,6.429,7.929) (4.357,5.857,7.357) (4.929,6.429,7.857) (4.071,5.571,7.0)
TE5 (10,10,10) (6.071,7.571,8.929) (3.786,5.286,6.786) (7.214,8.714,9.786) (6.071,7.571,8.786)
TE6 (10,10,10) (4.357,5.857,7.286) (4.071,5.571,7.071) (6.357,7.857,9.143) (5.214,6.714,8.071)
EC1 (10,10,10) (3.786,5.286,6.786) (1.286,2.714,4.214) (0.214,1.286,2.786) (1.786,3.286,4.786)
EC2 (3.786,5.286,6.786) (5.214,6.714,8.214) (3.786,5.286,6.786) (7.214,8.714,9.786) (5.5,7.0,8.429)
EC3 (1.786,3.286,4.786) (3.786,5.286,6.786) (4.643,6.143,7.643) (2.071,3.571,5.071) (1.786,3.286,4.786)
EN1 (3.214,4.714,6.214) (4.929,6.429,7.929) (5.214,6.714,8.214) (7.214,8.714,9.786) (3.214,4.714,6.214)
EN2 (3.857,5.286,6.786) (3.857,5.286,6.786) (4.643,6.143,7.429) (5.786,7.286,8.571) (4.929,6.429,7.929)
EN3 (4.071,5.571,7) (5.214,6.714,8.143) (5.214,6.714,8.214) (4.071,5.571,7) (5.214,6.714,8.214)
EN4 (1.786,3.286,4.786) (5.214,6.714,8.214) (1.786,3.286,4.786) (7.214,8.714,9.786) (3.214,4.714,6.214)
Table 6 Weighted normalized decision matrix
A0 A1 A2 A3 A4
TE1 (0.0087,0.0087,0.0087) (0.0054,0.0071,0.0087) (0.0061,0.008,0.0098) (0.0049,0.0065,0.0078) (0.0042,0.006,0.0079)
TE2 (0.0087,0.0087,0.0087) (0.006,0.0077,0.0095) (0.0065,0.0083,0.0101) (0.0038,0.0053,0.0068) (0.006,0.0078,0.0096)
TE3 (0.0056,0.0056,0.0056) (0.0047,0.0058,0.0068) (0.0035,0.0047,0.0058) (0.0045,0.0054,0.0062) (0.0032,0.0043,0.0055)
TE4 (0.0003,0.0003,0.0004) (0.0003,0.0004,0.0005) (0.0004,0.0004,0.0006) (0.0003,0.0003,0.0004) (0.0004,0.0005,0.0006)
TE5 (0.011,0.011,0.011) (0.0089,0.0111,0.0131) (0.006,0.0083,0.0107) (0.0092,0.0111,0.0125) (0.0093,0.0116,0.0135)
TE6 (0.0063,0.0063,0.0063) (0.0037,0.0049,0.0061) (0.0037,0.005,0.0064) (0.0047,0.0058,0.0067) (0.0046,0.0059,0.0071)
EC1 (0.0008,0.0017,0.0104) (0.0004,0.0006,0.0008) (0.0008,0.0012,0.0025) (0.0009,0.002,0.0121) (0.0007,0.0009,0.0017)
EC2 (0.0004,0.0005,0.0006) (0.0004,0.0005,0.0006) (0.0005,0.0007,0.0009) (0.0003,0.0003,0.0004) (0.0004,0.0005,0.0006)
EC3 (0.0002,0.0003,0.0006) (0.0002,0.0003,0.0004) (0.0002,0.0002,0.0003) (0.0002,0.0003,0.0006) (0.0003,0.0004,0.0008)
EN1 (0.0002,0.0003,0.0004) (0.0002,0.0003,0.0004) (0.0002,0.0003,0.0004) (0.0002,0.0002,0.0002) (0.0003,0.0004,0.0006)
EN2 (0.0003,0.0004,0.0005) (0.0004,0.0005,0.0007) (0.0004,0.0004,0.0006) (0.0003,0.0003,0.0004) (0.0003,0.0004,0.0005)
EN3 (0.0002,0.0003,0.0004) (0.0003,0.0003,0.0004) (0.0003,0.0003,0.0004) (0.0003,0.0003,0.0005) (0.0003,0.0003,0.0004)
EN4 (0.0002,0.0003,0.0006) (0.0002,0.0002,0.0003) (0.0003,0.0005,0.0008) (0.0001,0.0001,0.0002) (0.0002,0.0003,0.0005)
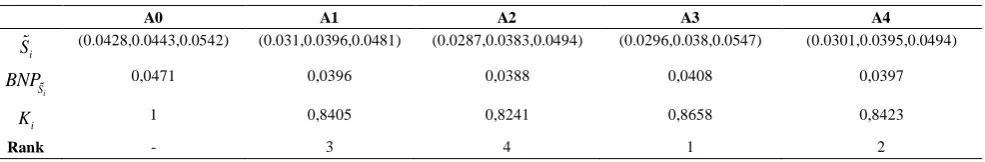
After calculating the optimality function, the values of optimality function are defuzzified by using Eq. (17). Then, by making a comparison between the degree of the alternative utility with the optimum one, the utility degree of each alternative is computed as resented in Table 7.
Finally, the alternatives are ranked based on the value of
.
i
K
The alternative A3 with the highest score (0,8658) is selected as the best choice for the waste dump site in the Ayerma phosphate project.Table 7 Final ranking of the waste dump sites
A0 A1 A2 A3 A4
i
S (0.0428,0.0443,0.0542) (0.031,0.0396,0.0481) (0.0287,0.0383,0.0494) (0.0296,0.038,0.0547) (0.0301,0.0395,0.0494)
i
S
BNP 0,0471 0,0396 0,0388 0,0408 0,0397
i
K 1 0,8405 0,8241 0,8658 0,8423
Rank - 3 4 1 2
Stage 3. Sensitivity analysis
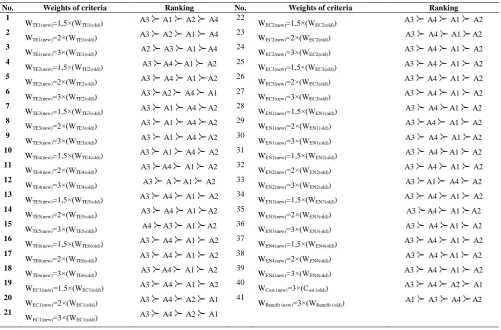
Sensitivity analysis, a powerful tool for evaluating the proposed model, is used to determine how “sensitive” a model is to changes in the value of the parameters of the model and to changes in the structure of the model (Breierova & Choudhari, 2001). In the decision making problems, this technique is usually applied to determine the effect of criteria weights on decision making and generates
different scenarios that may change the priority of alternatives and be needed to reach a consensus.
to find out which criteria is most effective in influencing the decision making process.
In experiment 40, the weight of the cost type criteria is increased by 300 % and the others are set without changing
whereas in the 41st experiment, the weight of the cost category criteria is constant and the others are increased by 300 %. The results of the sensitivity analysis are presented in Figure 3.
Table 8 Sensitivity analysis
No. Weights of criteria Ranking No. Weights of criteria Ranking
1
WTE1(new)=1,5×(WTE1(old)) A3 A1 A2 A4
22
WEC2(new)=1,5×(WEC2(old)) A3 A4 A1 A2 2
WTE1(new)=2×(WTE1(old)) A3 A2 A1 A4
23
WEC2(new)=2×(WEC2(old)) A3 A4 A1 A2 3
WTE1(new)=3×(WTE1(old)) A2 A3 A1 A4
24
WEC2(new)=3×(WEC2(old)) A3 A4 A1 A2 4
WTE2(new)=1,5×(WTE2(old)) A3 A4 A1 A2
25
WEC3(new)=1,5×(WEC3(old)) A3 A4 A1 A2 5
WTE2(new)=2×(WTE2(old)) A3 A4 A1 A2
26
WEC3(new)=2×(WEC3(old)) A3 A4 A1 A2 6
WTE2(new)=3×(WTE2(old)) A3 A2 A4 A1
27
WEC3(new)=3×(WEC3(old)) A3 A4 A1 A2 7
WTE3(new)=1,5×(WTE3(old)) A3 A1 A4 A2
28
WEN1(new)=1,5×(WEN1(old)) A3 A4 A1 A2 8
WTE3(new)=2×(WTE3(old)) A3 A1 A4 A2
29
WEN1(new)=2×(WEN1(old)) A3 A4 A1 A2 9
WTE3(new)=3×(WTE3(old)) A3 A1 A4 A2
30
WEN1(new)=3×(WEN1(old)) A3 A4 A1 A2 10
WTE4(new)=1,5×(WTE4(old)) A3 A1 A4 A2
31
WEN2(new)=1,5×(WEN2(old)) A3 A4 A1 A2 11
WTE4(new)=2×(WTE4(old)) A3 A4 A1 A2
32
WEN2(new)=2×(WEN2(old)) A3 A4 A1 A2 12
WTE4(new)=3×(WTE4(old)) A3 A A1 A2
33
WEN2(new)=3×(WEN2(old)) A3 A1 A4 A2 13
WTE5(new)=1,5×(WTE5(old)) A3 A4 A1 A2
34
WEN3(new)=1,5×(WEN3(old)) A3 A4 A1 A2 14
WTE5(new)=2×(WTE5(old)) A3 A4 A1 A2
35
WEN3(new)=2×(WEN3(old)) A3 A4 A1 A2 15
WTE5(new)=3×(WTE5(old)) A4 A3 A1 A2
36
WEN3(new)=3×(WEN3(old)) A3 A4 A1 A2 16
WTE6(new)=1,5×(WTE6(old)) A3 A4 A1 A2
37
WEN4(new)=1,5×(WEN4(old)) A3 A4 A1 A2 17
WTE6(new)=2×(WTE6(old)) A3 A4 A1 A2
38
WEN4(new)=2×(WEN4(old)) A3 A4 A1 A2 18
WTE6(new)=3×(WTE6(old)) A3 A4 A1 A2
39
WEN4(new)=3×(WEN4(old)) A3 A4 A1 A2 19
WEC1(new)=1.5×(WEC1(old)) A3 A4 A1 A2
40
WCost (new)=3×(Cost (old)) A3 A4 A2 A1 20
WEC1(new)=2×(WEC1(old)) A3 A4 A2 A1
41
WBenefit (new)=3×(WBenefit (old)) A1 A3 A4 A2 21
WEC1(new)=3×(WEC1(old)) A3 A4 A2 A1
It can be seen from Table 8 and Figure 3 that out of 41 experiments, alternative A3 has the highest score in thirty eight experiments (experiments 1–2, 4–14, and 16–40). In the 3th experiment the alternative A2 is selected as the first choice. In the 15th experiment, A4 is the winner and in the remaining one experiment (experiment 41), A1 is come out as the winner. Therefore, it can be resulted that the process of site selection is rarely sensitive to the criteria weight with alternative A3 emerging as the winner (92,68 % votes).
Figure 3. Results of sensitivity analysis
Conclusions
Acknowledgement
The authors would like to acknowledge the financial support of Ayerma International Industry and Mining Research Company for this research.
References
Aghdaie, M. H., Hashemkhani Zolfani, S., & Zavadskas, E. K. (2012). Prioritizing Constructing Projects of Municipalities based on AHP and COPRAS-G: a Case Sstudy About Footbridges in Iran, The Baltic journal of road and bridge engineering, 7(2), 145–153.
Bagocius, V., Zavadskas, E. K., & Turskis, Z. (2014a). Selecting a Location for a Liquefied Natural gas Terminal in the Estern Baltic sea. Transport, 29(1), 69–74. http://dx.doi.org/10.3846/16484142.2014.897996
Bagocius, V., Zavadskas, E. K., & Turskis, Z. (2014b). Multi-Person Selection of the best Wind turbine Based on the multi-Criteria Integrated Additive-Multiplicative Utility Function. Journal of civil engineering and management, 20(4), 590–599.
Bakshi, T., & Sarkar, B. (2011). MCA Based Performance Evaluation of Project Selection. International Journal of Software Engineering & Applications, (IJSEA) 2(2), 14–22. http://dx.doi.org/10.5121/ijsea.2011.2202
Bakshi, T., & Sinharay, A. (2011). An Integrated Novel Approach in MCDM under Fuzziness. International Journal of Computer & Communication Technology 2, 36–43.
Blight, G. (2010). Geotechnical Engineering for mine Waste Storage Facilities. Taylor & Francis Group, London, UK. http://dx.doi.org/10.1201/9780203859407
Breierova, L., & Choudhari, M. (2001). An Introduction to Sensitivity Analysis. Massachusetts Institute of Technology, D-4526-2, 43–107.
Chen, V. Y. C., Lien, H. P., Liu, C. H., Liou, J. J. H., Tzeng, G. H., & Yang, L. S. (2011). Fuzzy MCDM Aapproach for Selecting the best Environment - Watershed plan. Applied Soft Computing 11(1), 265–275. http://dx.doi.org/10.1016/ j.asoc.2009.11.017
Dadelo, S., Turskis, Z., Zavadskas, E. K., & Dadeliene, R. (2012). Multiple Criteria Assessment of Elite Security Personal on the Basis of ARAS and Expert Methods. Economic Computation and Economic Cybernetics Studies and Research, 46 (4), 65–87.
Daneshian, J., Salsani, A., Aghanabati, S. A., & Shariati, Sh. (2012). Foraminiferal Biostratigraphy and Paleoecology of Pabdeh Formation and its Relationship to the Phosphatic Horizon in Lar Mountain (North Gachsaran). Stratigraphy Master Thesis. Kharazmi University, Tehran, Iran. P. 146.
Ekmekcioglu, M., Kaya, T., & Kahraman, C. (2010). Fuzzy Multicriteria Disposal Method and Site Selection for Municipal solid waste. Waste Management, 30 (2010), 1729–1736 http://dx.doi.org/10.1016/j.wasman.2010.02.031 Hashemkhani Zolfani, S., Aghdaie, M. H., Derakhti, A., Zavadskas, E. K., & Varzandeh, M. H. M. (2013). Decision
Making on Business Issues With Foresight Perspective; an Application of New Hybrid MCDM Model in Shopping Mall Locating. Expert systems with applications 40(17), 7111–7121. http://dx.doi.org/10.1016/j.eswa.2013.06.040 Hashemkhani Zolfani, S., Rezaeiniya, N., Aghdaie, M. H., & Zavadskas, E. K. (2012). Quality Control Manager Selection
Based on AHP- COPRAS-G methods: a Case in Iran. Ekonomska istrazivanja = Economic research, 25(1), 88–104. Hekmat, A., Osanloo, M., & Shirazi M. A. (2008). New Approach for Selection of Waste Dump Dites in Open pit Mines.
Mining Technology 117(1), 24–31. http://dx.doi.org/10.1179/174328608X343768
Kaplinski, O., & Tupenaite, L. (2011). Review of the Multiple Criteria Decision Making Methods, Intelligent and Biometric Systems Applied in Modern Construction Economics. Transformations in Business & Economics, 10(1(22)), 166–181.
Kaplinski, O., & Tamosaitiene, J. (2010). Game Theory Applications in Construction Engineering and Management. Technological and Economic Development of Economy, 16(2), 348–363. http://dx.doi.org/10.3846/tede.2010.22 Kaplinski, O. (2009). Sapere Aude: Professor Edmundas Kazimieras Zavadskas. Inzinerine Ekonomika-Engineering
Economics (5), 113–119.
Kutut, V., Zavadskas, E. K., & Lazauskas, M. (2013). Assessment of Priority Options for Preservation of Historic City Centre Buildings Using MCDM (ARAS). Procedia Engineering, 57, 657–661. http://dx.doi.org/10.1016/j. proeng.2013.04.083
Moghaddas, N. H., & Namaghi, H. H. (2011). Hazardous Waste Landfill site Selection in Khorasan Razavi Province, Northeastern Iran. Arabian Journal of Geosciences 4,103–113. http://dx.doi.org/10.1007/s12517-009-0083-8
Peldschus, F., Zavadskas, E. K., Turskis, Z., & Tamosaitiene, J. (2010). Sustainable Assessment of Construction site by Applying game Theory. Inzinerine Ekonomika-Engineering Economics, 3(21), 223–237.
Rezaeiniya, N., Hashemkhani Zolfani, S., & Zavadskas, E. K. (2012). Greenhouse Locating Based on Anp-Copras-G Methods – an Empirical Study Based on Iran. International Journal of Strategic Property Management, 16(2), 188– 200. http://dx.doi.org/10.3846/1648715X.2012.686459
Rosendal, R. M. (2009). Landfill Mining - Process, Feasibility, Economy, Benefits and Limitations. RenoSam.
Ruzgys, A., Volvaciovas, R., Ignatavicius, C., & Turskis, Z. (2014). Integrated Evaluation of External Wall Insulation in Residential Buildings Using SWARA-TODIM MCDM method. Journal of Civil Engineering and Management, 20(1), 103–110. http://dx.doi.org/10.3846/13923730.2013.843585
Sadiq, R., Husain, T., Veitch, B., & Bose, N. (2004). Risk-Based Decision Making for Drilling waste Discharges Using a Fuzzy Synthetic Evaluation Technique. Ocean Engineering, 31, 1929–1953. http://dx.doi.org/10.1016/j. oceaneng.2004.05.001
Sener, S., Sener, E., & Karaguzel, R. (2010). Solid Waste Disposal site Selection with GIS and AHP Methodology: a Case Study in Senirkent–Uluborlu (Isparta) Basin, Turkey. Environ Monit Assess. DOI 10.1007/s10661-010-1403-x. Shariati, Sh., & Salsani, A. (2012). Semi Comprehensive & Comprehensive Exploration of Ayerma’s Phosphate (Lar
Mountain) in Kohgiluye & Bouyer Ahmad Province (Based on Revised Information and Field Works). Ayerma International Industry & Mining Research Company Report. P. 250.
Turskis, Z., Zavadskas, E. K., & Kutut, V. (2013), Model based on ARAS-G and AHP Methods for Multiple Criteria Prioritizing of Heritage Value. International Journal of Information Technology & Decision Making 12(1), 45–73. http://dx.doi.org/10.1142/S021962201350003X
Turskis, Z., Lazauskas, M., & Zavadskas, E. K. (2012). Fuzzy Multiple Criteria Assessment of Construction Site Alternatives for Non-Hazardous Waste Incineration Plant in Vilnius City, Applying ARAS-F and AHP Methods. Journal of Environmental Engineering and Landscape Management, 20(2), 110-120. http://dx.doi.org/10.3846/ 16486897.2011.645827
Turskis, Z., & Zavadskas, E. K. (2010). A New Fuzzy Additive Ratio Assessment Method (ARAS‐F). Case study: The Analysis of Ffuzzy Multiple Criteria in Order to Select the Logistic Centers Location. Transport, 25(4), 423–432. http://dx.doi.org/10.3846/transport.2010.52
Vahdani, B., Mousavi, S. M., & Tavakkoli Moghaddam, R. (2011). Group Decision Making Based on Novel Fuzzy Modified TOPSIS Method. Applied Mathematical Modelling 35: 4257-4269. http://dx.doi.org/10.1016/j. apm.2011.02.040
Wu, H. Y., Tzeng, G. H., & Chen, Y. H. (2009). A Fuzzy MCDM Approach for Evaluating Banking Performance Based on Balanced Scorecard, Expert Systems with Applications 36(6), 10135–10147. http://dx.doi.org/10.1016/ j.eswa.2009.01.005
Yazdani Chamzini, A., & Yakhchali, S. H. (2012). Tunnel Boring Machine (TBM) Selection Using Fuzzy Multicriteria Decision Making Methods. Tunnelling and Underground Space Technology, 30, 194–204. http://dx.doi.org/ 10.1016/j.tust.2012.02.021
Zadeh, L. A. (1996). Fuzzy Logic = Computing With Words. IEEE Transactions on Fuzzy Systems 4 (2), 103–111. http://dx.doi.org/10.1109/91.493904
Zamani, M., Rabbani, A., Yazdani-Chamzini, A., & Turskis, Z. (2014). An Integrated Model for Extending Brand Based on Fuzzy ARAS and ANP Methods. Journal of Business Economics and Management, 15(3), 403–423. http://dx.doi.org/10.3846/16111699.2014.923929
Zavadskas, E. K., & Turskis, Z. (2010). A new Additive ratio Assessment (ARAS) Method in Multicriteria Decision-Making. Technological and Economic Development of Economy, 16(2), 159–172. http://dx.doi.org/10.3846/tede. 2010.10
Zavadskas, E. K., Turskis, Z., & Vilutiene, T. (2010). Multiple Criteria Analysis of Foundation Instalment Alternatives by Applying Additive Ratio Assessment (ARAS) method. Archives of Civil and Mechanical Engineering, X(3), 123– 141. http://dx.doi.org/10.1016/S1644-9665(12)60141-1
Zavadskas, E. K., &Turskis, Z. (2011). Multiple Criteria Decision Making (MCDM) Methods in Economics: an Overview. Technological and Economic Development of Economy, 17(2), 397–427. http://dx.doi.org/10.3846/20294913. 2011.593291
Zavadskas, E. K., Vainiunas, P., Turskis, Z., & Tamosaitiene, J. (2012). Multiple Criteria Decision Support System for Assessment of Projects Managers in Construction. International Journal of Information Technology & Decision Making, 11(2), 501–520. http://dx.doi.org/10.1142/S0219622012400135