Vol.8 (2018) No. 3
ISSN: 2088-5334
Data Mining for Detecting E-learning Courses Anomalies:
An Application of Decision Tree Algorithm
Fatiha Elghibari
#, Rachid Elouahbi
#, Fatima El Khoukhi
* #Department of mathematics and computer Science, Moulay Ismail University, Faculty of Sciences, Meknes, Morocco E-mail: [email protected]; [email protected]
*
Team of Applied Computer Modelling in Humanities, Moulay Ismail University, Faculty of Humanities, Meknes, Morocco E-mail: [email protected]Abstract— E-learning adaptation has become the most important method that facilitates access to the appropriate content. Adaptive approaches consist of reducing the problems of incompatibilities between learner’s cognitive abilities and educational content’s difficulties. In some cases, the adapted curriculum cannot meet learner's skills completely seen its incoherent structure, its unsuitable methodologies and sometimes its complexity. Therefore, we need to measure the convenience of the content material to improve it and ensure learners’ satisfaction. In other words, it is necessary to estimate its appropriateness to each learner. That is why; we have proceeded by using decision tree (DT) algorithm which is a supervised data mining method. It helps to predict the convenience of the proposed content material for learners. Our system consists of classifying learning material into two classes: “good” if it is convenient, and “anomaly” if not. To achieve that, we have used an intelligent agent called Classifier Agent (CLA). It tracks learner’s behavior by collecting a set of attributes like score, learning time, and number of attempts, feedback and interactions with the tutor. Then, he calculates the predictive attribute by using the (DT) algorithm. The finding algorithm shows that the score is the most crucial indicator gives us more information about the conformity of curriculum to learners, followed by learning time, feedback and number of attempts.
Keywords— e-learning; learners’ convenience; content material’s anomalies; decision tree; adaptation.
I. INTRODUCTION
The E-learning is a smart mean to carry out remote education. It allows learners to learn from anywhere at any time, by providing immediate access to a variety of educational contents. However, they have different behaviors, attitudes and learning styles which can affect their learning process. Also, their cognitive abilities and skills differ according to their understanding level [1]. Therefore, providing the same learning content for all of them may reduce their performance. Many studies have been done in this field to propose a proper learning path. It presents a dynamic educational content suited to the acquired abilities, changing skills and learner’s preferences [2], [3]. Some research work has conceived recommendation systems which generate suggestions on new items or predict the usefulness of an item for a given learner. It is a content-based filtering that recommends items similar to those that users have already appreciated [4]. Adaptive e-learning systems have widely used as a solution to learners’ adaptation problems [5]. It allows a variety of free navigation to them by using the Semantic Web and Ontology [6]. Some researchers have opted to use intelligent agents as an important mechanism to present the most suited content
materiel [7]. In general, the instructional designer estimates the most suitable one meeting learner’s capacities according to some adaptation methods [8]. Except, proposing an adapted content, doesn’t mean his satisfaction and his motivation. It cannot meet completely his cognitive abilities [9]. Sometimes, learners face problems due to some anomalies in the proposed content itself. Namely, bad construction, lack of some definitions or reminders that help to quick understanding of some concepts [10]. Also, the absence of examples facilitating the assimilation of the objective of some complicated notions. Sometimes, there are problems in introducing courses by using high abstraction level that learners can’t assimilate easily. They find it difficult to understand its objective and its usefulness in real life. And then, they don’t appreciate it.
learners. To achieve that, we have used an intelligent agent called Classifier Agent (CLA) which gathers a set of learners’ attributes like score, learning time, interactions with the tutor, number of attempt and feedback as an input of (DT) algorithm. Moreover, he calculates the predictive attribute which is the (LO) class (good, anomaly). The experimentation done in this context has shown that these variables are effective to detect e-learning content anomalies.
Data mining is a set of mathematical, statistical and computing methods and techniques. It allows analysis and making decisions through the rapid and efficient discovery of unknown or hidden information schemes within large databases. It also permits, automated discovery of new relationships and dependencies of attributes in the observed data [11]. The objective is better understanding the behavior of a population based on its characteristics, to propose optimization and adaptation solutions later [12]. Data mining techniques are used in many research areas, including mathematics, cybernetics, genetics, and marketing. We can distinguish between two sorts of data mining: supervised data mining that serves mainly for data classification and prediction. Moreover, unsupervised data mining that is used in the search for associations or groups of individuals [13].
Supervised data mining is regarded as an essential technique in the field of artificial intelligence especially in machine learning. Machine learning consists of using methods and algorithms allowing computers to perform tasks without having been explicitly programmed to do so [14]. In this field, supervised learning concerns the methods of data classification; it means that we know the input and we want to determine the output. Moreover, also some techniques of regression that permit to find the input by knowing the output.
In the last decades, supervised data mining has been widely used in many domains through a set of relevant classification methods such as; Genetic algorithm, KNN algorithm, artificial neural network and (DT) algorithm. Several researchers have used these methods to solve some complex problems, especially those of prediction, classification and making a decision. It has proved its efficiency in different domains such as banking, finance, marketing and e-learning [15]. For example, in the field of education, and due to the vital role of e-learning to facilitate access to the knowledge; researchers have begun more interested in investigating various data mining methods to help administrators and instructors to improve e-learning systems [16]. Several methods have been proposed in this context to make it smarter [17]. The (DT) algorithm has been widely used in e-learning. For example, Romeo et al. [18] made a comparative study between three classification methodologies. Namely, between Naive Bayes algorithm (NB) based on pure assumptions, Multilayer Perceptron (MLP) which is a neural network algorithm and C4.5 which is (DT) algorithm. The objective was to define the best classifier method that helps administrators to predict the final exam result, to identify students who need help and improve their performance. However, Osmanbegović et al. [19] proposed an e-learning system for automatically classify level questions in the examination group by using (DT) algorithm. It classifies questions according to their difficulties and then it can choose easily the most suitable
for each learner’s abilities. Also, the research of Cheng et al. [20] revealed that (DT) algorithm could be excellent method to help tutors to classify learners according to their learning styles and interests by using some personal attributes detected from the learning process. The experimental results of Özpolat et al. [21] proved that (DT) algorithm could be a good vehicle for learners’ motivation by providing creativity in the learning system. It was achieved by using game learning based on intelligent agents and personalized learning system [22]. The growing popularity of computers and internet has led Lin et al. [23] to design an e-news delivery system that sends personalized e-mails to every student’s mailbox according to his preferences as to as facilitate access to the latest information. The system realized good result due to the efficiency of (DT) algorithm by using some indicators’ learners attributes like preferences, login time and category. Also, the study of Chen et al. [24] demonstrated the efficiency of this sort of data mining algorithm to analyze learners’ behavior by exploring their information.
Some research work chose to elaborate comparative studies between several classification algorithms like neural network algorithm, (DT) and statistical classifier as shown in the study of Al-Barrak et al. [25]. They chose Moodle as an area of their experimentation.
Sometimes, using (DT) algorithm alone is not enough to solve some problems. In this context, the research work of Romero et al. [26] used a combination of neural network and (DT) algorithm to achieve a dropout prediction method for e-learning courses with more precision based on machine learning and detailed student data. The objective of the study of Lykourentzou et al. [27] was to solve the class imbalance problem; they have applied machine learning techniques to improve prediction results of academic performances by using three algorithms: (DT), Bayesian Networks and Support Vector Machines. The diversity of classifiers can also help to predict learners’ performance and avoid irrelevant information automatically by combining an incremental version of Naive Bayes, the 1-NN, and the WINNOW algorithms as shown in a study of Thai-Nghe et al. [28]. The couple KNN and (DT) algorithm have proved its effectiveness not only in an e-learning context but also in the network [29], computer science and stock market prediction [30], [31].
context, the purpose of our research is to conceive an intelligent system by using (DT) algorithm as a supervised method that:
• Detect learning content materials which constitute anomalies for learners by predicting their convenience to learners’ abilities.
• Ensure a good quality of courseware, by inserting another one more convenient and adapted.
II. MATERIAL AND METHOD
A. E-learning model for detecting curriculum anomalies
1) What is (DT) s algorithm: The (DT) algorithm
represents an effective method of decision-making. It represents a set of choices in the graphical tree form. It consists of partitioning data into homogeneous groups as possible according to the predictive variable (decision variable). It takes as input classified data, and we obtain as output a tree that looks like an orientation diagram. Each last node (leaf) represents a decision class, and each node (internal) is a new test. Each leaf represents a decision belonging to a class. Data verify all path test leading from the root to that leaf [32].
The (DT) algorithm has the advantage of being readable and fast to execute. It is an automatically computable representation of supervised learning algorithms. We have two types:
• The classification trees: consists of explaining or predicting the appurtenance of a set of objects (observations, individuals) to a class, or category that is considered as a qualitative variable, based on quantitative or qualitative explanatory variables.
• The regression trees: are used to explain or predict the values taken by a quantitative dependent variable as a function of quantitative or qualitative explanatory variables.
The classification model is based on a set of recorded data called dataset. It constitutes the input of learning algorithm. The generated model must fit the input data (training set). Moreover, predict the class label of newly recorded attributes (Test Set) that have never seen before. The objective is to build a learning model (tree, graph) with a good generalization capability [33] as explained in the following figure Fig. 1.
Fig.1 General approach for building classification models [34]
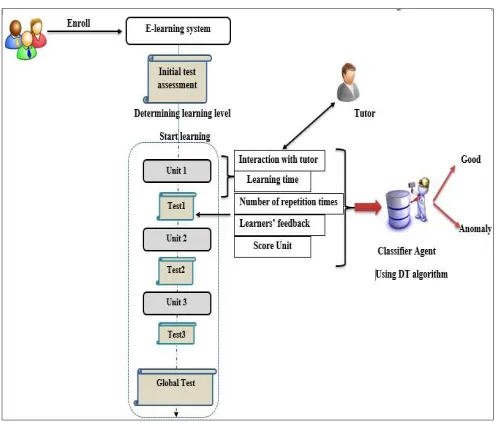
2) E-learning system for classifying content materials using (DT) algorithm: The decision tree technique is widely used in e-learning systems seen its efficiency in predicting and classifying learners’ performance. It can be considered as a sort of tracking learners to analyze their behaviors [34] and the main objective remains to provide a relevant learning curriculum. Also, it can be used as a mechanism to detect courses’ anomalies during learning. In this context, our research aims essentially to detect problems can affect learners during the learning phase. Namely, problems in course's structure, its methodologies or a high abstraction level compared to their cognitive skills. The objective is to find the algorithm that allows the best and the precise classification of e-learning content (good, anomaly) by exploring some learners' attributes.
Fig. 2 the architecture of our classification system
Once registered in e-learning system, learners pass an assessment test to determine their appropriate level. We define three levels, beginner, intermediate and advanced. The educational curriculum is composed of a short units’ collection helps them to quickly understand and evaluate information through a test at the end of each unit. Our objective is to define if the content material responds to their needs or not. Namely, measure its appropriateness in term of each unit. The (CLA) collects attributes which constitute the input (data set) of (DT) algorithm.
• Learning time (LT): This attribute gives us more
information about the time spent in learning and understanding (LO) in term of each unit. When learners face problems in learning, they try to assimilate some concepts by communicating with the tutor and looking for more courses to understand. So, the more learning period is long more it includes understanding problems
• Score (S): represents the obtained score at the end of the unit. It reflects the comprehension level of the learned concepts.
• Some attempts (NA): represents the number of
repetition times to validate the test unit. More the number of attempts is high more it means that the course does not fit precisely the learners’ cognitive abilities.
• Interaction with the tutor (I): represents the frequency of interaction with the tutor through chat and messages. When learner cannot assimilate some notions and concepts, he tries to contact the tutor. The frequency of interaction between them can reflect the existence of anomalies.
• Feedback (F): represents learners’ feedback and their opinions about the structure and methodologies of (LO). If learners’ are dissatisfied with the (LO), their feedback will be negative.
The output of (DT) algorithm is the predictive variable (class).
• Class (C): is the predictive variable representing the classification of the (LO) in the good or the anomaly category.
3) The (CLA) algorithm for retrieving attributes The (CLA) agent tracks learners’ behaviors and retrieves the input data to be explored by the (DT) algorithm. The process of getting these attributes is explained in the following Fig. 3.
Fig. 3 Activity diagram explaining the (CLA) algorithm for retrieving a dataset
Once connected, learner chooses the appropriate (LO). When he starts learning in the selected one, the (CLA) initializes two essential attributes: Learning Time (LT=0) and the number of interactions with the tutor (I=0). The (CLA) launches counter calculating learning time (LT). At the same time, it counts the number of interactions with the tutor (I). For example, if learner communicates with him asking for help or explanation, the attribute (I) will be incremented. By finishing the (LO), the (CLA) saves the recorded values (LT) and (I) in the track.xml file. Then, students must pass test assessment to evaluate the comprehension level and the efficiency of the proposed (LO). So, we have two cases:
• If he succeeds (S>=12): the agent saves the obtained (S), learner’s feedback (F), Interactions (I) and Number of attempt (NA =0) in the track.xml file.
• Else, the agent increments the (NA) and learner must repeat the (LO). The agent does not save any information.
4) How to build a decision tree?: The (DT) algorithm
partition at each branch is pure as possible. For this reason, the entropy has been introduced as a good indicator to measure the impurity as shown in the following equation (1):
E(D)= -
∑
ni=0Pi
* log
2(Pi) (1)
Pi is the probability of the appearance of class I in the dataset (D)
We also have another function that permits to measure the degree of heterogeneity of classes in all samples, and in any position of the tree in construction. It defines the gain for a set D of examples and an attribute Q. it represents the difference between the entropy before and after splitting (2):
,
=
− ∑
∗ E D, Qi
(2)
The process of building (DT) is explained in the following algorithm 1:
The C4.5 (DT) algorithm
algorithm LearnDecisionTree(examples, attributes, class) returns a decision tree
inputs: examples, examples attributes, attributes
output: class, a category for the predictive attribute if examples are empty, then return leaf labeled by class
else if all examples have same category for predictive attribute // pure class
then return leaf labelled by class else
bestatt = Choose Attribute (attributes, examples) // defined by the above criteria
tree = a new décision tree with root test bestatt for each class ci of bestatt do
examplesi = {elements of examples with best = ci}
subtree = Learn Decision Tree(examplesi, attributes – bestatt, Majority Class (examples))
add a branch to tree with label ci and subtree return tree
Algorithm1 the algorithm C4.5 to build a decision tree
To build the (DT), we need to define in the input of the algorithm: attributes, examples which mean a set of observations according to the selected attributes and the values of the target attribute (predictive) called class (category). The output of the algorithm is the (DT), which is defined according to the following steps.
• First step: initialize the current tree on the empty tree and the root of the current node
• Second step: if all examples belong to the same class, return leaf labeled by class
• Third step: choose the best attribute that maximizes the gain and minimizes the entropy criteria. Then new (DT) is built with the best attribute as root.
• Fourth step: the number of examples belonging in the class ci, the best attribute is calculated, and new (DT) is determined by calculating subtree (examples, attributes – bestatt, MajorityClass (examples)). Moreover, finally, the branch is added
to a tree with label ci and subtree. This step is repeated until obtaining the complete (DT)
• Fifth step: the (DT) is returned.
III.RESULTS AND DISCUSSION
A. Experimental phase using (DT) algorithm
To prove the efficiency of the proposed approach, we have tested it in the Faculty of Arts and Humanities, Moulay
Ismaîl University, Meknes, Morocco
(http://www.flsh.umi.ac.ma/). We proposed online learning of some computing subjects like Microsoft office word. 60 learners have been involved in this experimentation as examples. First, they have passed an assessment test to identify their knowledge level. Then we have provided to learners on the same level an e-learning content to detect its difficulties and its incoherence. We have proposed Microsoft Office Word 2010 as (LO) organized in a successive units explaining its main features.
During learning and at the end of each unit, we have collected the values of the attributes mentioned above for each learner.
TABLEI
DESCRIPTION OF THE ATTRIBUTES CHARACTERIZING LEARNERS. Attribute Description attribute Type of
Learning time (LT)
We define the average of (LT) of each unit. This attribute takes “no” if learners exceed the average time and “yes” if not.
Nominal
Number of attempt per unit (NA)
This variable takes “yes” if (NA) is less than two attempts and “no” if not
Nominal
Learners’ feedback(F)
This variable can be
“positive” or “negative.” Nominal
Interactions with the tutor (I)
This attribute represents the frequency of (I) if this interaction is less than two times this attribute takes “yes,” if not it takes “no.”
Nominal
Unit’s score (S) This attribute represents
the (S) of unit test Numeric
Class (C )
It represents the class predictive attribute explaining the category of content “good” or “anomaly.”
Nominal
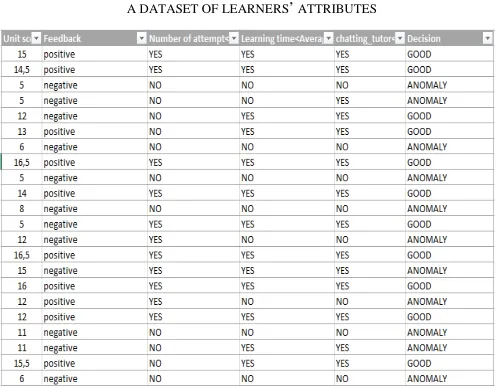
We have defined dataset composed of the above learners’ attributes or examples (LT, I, S, NA, F). We have stored learners’ observations representing examples in the following table 2.
Then we have calculated the entropy: - E(D) = -p1*log(p1)- p2*log(p2)
- E(D) = - 26 /60*log(26/60)-34/60*log(34/60)= 0.987
We have observed that the attribute (S) splits the examples into two subsets (scores>=13/20 and scores<13/20), so we calculated the average entropy for this attribute from the data set D:
We have:
• S <12/20 {26 Anomaly, 2 Good} of 28 examples
• E1(D,S greater
)=-[28/32*log(28/32)+4/32*log(4/32)]= 0.543
• E2(D,Sless)=-[26/28*log(26/28)+2/28*log(2/28)]= 0.371
• E(D,S)=34/60*0.543+26/60*0.371 =0.468
TABLEII
A DATASET OF LEARNERS’ ATTRIBUTES
After computing the average entropy E (D, S), we have computed the gain information by comparing the average entropy with the previous original data set entropy:
• Gain(D,S)=E(D)-E(D,S)= 0.987-0.468= 0.519 In the same way, we have calculated the gain information of the others attributes to select the best one that splits the dataset into pure partitions. We must select the attribute that maximizes gain information and minimizes the average entropy because E (D) is constant for all the attributes.
We have obtained these average entropy for the rest of attributes:
• The average entropy of (LT) attribute : E(D,L)= 0.647
• The average entropy of (NA) attribute: E(D, N)=0.817
• The average entropy of (F) attribute: E(D, F)=0.638
And
• the gain information of (LT) attribute: G(D,L)=0.339
• The gain information of (NA) attribute G(D, N)=0.17
• The gain information of (F) attribute G(D, L)=0.349
The maximum gain information is 0.519; it corresponds to the (S) attribute. As we can see the best attribute is the score because its gain information is the maximum. Therefore, it will be the root of the (DT). This operation is repeated with the remaining attribute (LT, F, NA, I) as a loop of (DT) algorithm as it is mentioned above.
B. Discussion
To be more precise, we have used the WEKA software. WEKA is a collection of machine learning algorithms for data mining tasks. The algorithms can either be applied
directly to a dataset. It contains tools for data classification, regression, clustering, association rules, and visualization. We have used WEKA software to facilitate the calculating process and to create (DT) automatically. We have used the C4.5 algorithm which is considered one of the best classification algorithms. It is an improved version of an ID3 algorithm which doesn’t handle the numeric attributes. The C4.5 algorithm is called “J48 classifier” in the WEKA software. We have used this classifier, and we have obtained at the output the DT algorithm representing the content classification (GOOD, ANOMALY) as it is shown in the following Fig.4.
Fig. 4 The obtained DT algorithm for detecting anomalies
The (DT) algorithm selects attributes according to its importance and its impact on learners' achievement. The obtained algorithm shows that the score is the most influencing one giving the best splitting. Therefore, the course is classified as good content if (S) exceeds 13/20. In general, the score reflects the success on the (LO), and having a good mark means understanding its concepts and proves its relevance and then motivates learners to continue. In the case of a score less than this threshold, and because the algorithm evaluates the content, not the learner, it takes into account learning time as a second indicator of its appropriateness. Thus, the more learner respects the time devoted to learning; more it reflects the relevance of the content and its methodologies. Learners cannot proceed if they do not like the content, even it is interesting (F=negative). That is why the (DT) algorithm considers learners’ feedback as a third important factor influencing the learning process. The number of attempts to validate the (LO) is the last attribute affecting the learning process. The more learner does not exceed the threshold allowed to succeed; more it reflects the existence of anomalies in the structure and the methodology of the proposed (LO).
We notice that interactions with the tutor attribute do not appear in the (DT), it is relied strongly on to the learning time attribute, because when learner communicates with the tutor, he spends the allocated time for learning and understanding unit, and then he can overtake the learning time threshold.
IV. CONCLUSION
In this paper, we have proposed a system allowing detecting content’s anomalies based on the (DT) algorithm. The proposed solution consists of collecting some attributes during learning like score, learning time, feedback, number of attempts and interaction with the tutor. We have explored these attributes as an input of (DT) algorithm, and the output is content’s category (good, anomaly). The experimentation has shown an appropriate classification according to the importance of each attribute. It revealed that the score is the most important indicator giving us more information about the curriculum’s conformity to the learner, followed by learning time, feedback and number of attempts. The obtained (DT) algorithm provides a clear vision of the classification process, we have applied it to the rest of students to measure their convenience with the current content as sort of prediction. We can also apply it to other courses to determine the level of its compatibilities or incoherence with learners.
REFERENCES
[1] D. Hooshyar, R. Ahmad, M. Yousefi, F. Yusop and S.-J. Horng, “A flowchart ‐ based intelligent tutoring system for improving problem‐solving skills of novice programmers,” Journal of computer assisted learning, vol. 31, no. 4, pp. 345-361, 2015. [2] F. Elghibari, R. Elouahbi and F. El Khoukhi, “modèle d’un processus
d'apprentissage adapté aux évolutions cognitives du profil de l'apprenant,” in 1ère Edition du Workshop International sur les Approches Pédagogiques & E-Learning, Fez, Morocco, 2015. [3] R. Elouahbi, D. Bouzidi, N. Abghour and A. M. Nassir, “A flexible
approach to modelling adaptive course sequencing based on graphs implemented using XLink,” International Journal of Advanced
Computer Science and Applications (IJACSA), vol. 3, no. 1, pp. 1-9, 2012.
[4] M. Ghenname, M. Abik, R. Ajhoun, J. Subercaze, C. Gravier and F. Laforest, “Personalized Recommendation Based Hashtags on E-learning Systems,” in ISKO-Maghreb 2013 Concepts and Tools for Knowledge Management (KM), Tunisia, 2013.
[5] V. Esichaikul, S. Lamnoi and C. Bechter, “Student Modelling in Adaptive Learning Systems,” Knowledge Management & E-Learning: An International Journal, pp. 342-355, 2011.
[6] S. Bateman, C. A. Brooks and G. I McCalla, “Collaborative Tagging Approaches for Ontological Metadata in Adaptive E-Learning Systems,” in Proceedings of the Fourth International Workshop on Applications of Semantic Web Technologies for E-Learning, 2006. [7] X. Daomin, “Multi-Agent Based e-Learning Intelligent Tutoring
System for Supporting Adaptive Learning,” in Fourth International Conference on Intelligent Systems Design and Engineering Applications, 2013.
[8] F. Elghibari, R. Elouahbi, F. El Khoukhi, L. Ezzahri and S. Amali, “the 15th International Conference onIntelligent model for measuring learners' satisfaction towards new contents,” in Information Technology Based Higher Education and Training (ITHET), Istanbul, Turkey, 2016.
[9] I. Kamsa, F. Elghibari, R. Elouahbi, S. Chehbi and F. El Khoukhi, “Learning time planning in a distance learning system using intelligent agents,” in 14th Information Technology Based Higher Education and Training (ITHET), Lisbon, Portugal, 2015.
[10] F. Elghibari, R. Elouahbi, F. Elkhoukhi, S. Chehbi and I. Kamsa, “Intelligent e-learning system model for maintenance of updates courses,” in 15th International Conference on Information Technology Based Higher Education and Training, Lisbon, Portugal, 2015.
[11] A. Peña-Ayala, “Educational data mining: A survey and a data mining-based analysis of recent works,” ELSEVIER, vol. 41, no. 4, pp. 1432-1462, 2013.
[12] G. Calas, “Studies of the main data mining algorithms,” [SCIA] EPITA, Kremlin-Bicêtre, 2009.
[13] Bermudes, “Decision tree,” Zeste du savoir, 2016.
[14] A. L. Buczak and E. Guven, “A Survey of Data Mining and Machine Learning Methods for Cyber Security Intrusion Detection,” IEEE Communications Surveys & Tutorials, vol. 18, no. 2, pp. 1153 - 1176, 2016.
[15] C. Romero and S. Ventura, “Educational data mining: A survey from 1995 to 2005,” ELSEVIER: Expert Systems with Applications, pp. 135-146, 2007.
[16] D. Hooshyar, M. Yousefi and H. Lim, “A systematic review of data-driven approaches in the player modeling of educational games,” Artificial Intelligence Review, pp. 1-21, 2017.
[17] D. Hooshyar, R.. B. Ahmad, M. Yousefi, M. Fathi, S.-J. Horng and H. Lim, “Applying an online game-based formative assessment in a flowchart-based intelligent tutoring system for improving problem-solving skills,” Elsevier: Computers & Education, vol. 94, pp. 18-36, 2016.
[18] C. Romero, S. Ventura, and E. Garcıa, “Data mining in course management systems: Moodle case study and tutorial,” Elsevier: Computers & Education, p. 368–384, 2008.
[19] E. Osmanbegović and M. Suljić, “Data Mining Approach For Predicting Student Performance,” Economic Review – Journal of Economics and Business, vol. 10, no. 1, pp. 3-12, 2012.
[20] S.-C. Cheng, Y.-M. Huang, J.-N.. Chen and Y.-T. Lin, “Automatic Leveling System for E-Learning Examination Pool Using Entropy-Based Decision Tree,” Springer-Verlag Berlin Heidelberg, p. 273 – 278, 2005.
[21] E. Özpolat and G. B. Akar, “Automatic detection of learning styles for an e-learning system,” ELSEVIER: Computers and Education, p. 355–367, 2009.
[22] D. Hooshyar, M. Yousefi, and H. Lim, “Data-Driven Approaches to Game Player Modeling: A Systematic Literature Review,” ACM Computing Surveys (CSUR), vol. 50, no. 6, p. 90, 2018.
[23] C. F. Lin,. Y.-c. Yeh , Y. H. Hung and R. I Chang, “Data mining for providing a personalized learning path in creativity: An application of decision trees,” ELSEVIER: Computers & Education, p. 199–210, 2013.
[25] M. A. Al-Barrak and M. Al-Razgan, “Predicting Students Final GPA Using Decision Trees: A Case Study,” International Journal of Information and Education Technology, vol. 6, no. 7, pp. 528-533, 2016.
[26] C. Romero, V. Sebastián, P. G. Espejo and C. Hervás, “Data Mining Algorithms to Classify Students,” in International Conference on Educational Data MiningMontréal, Québec, 2008.
[27] I. Lykourentzou , I. Giannoukos, V. Nikolopoulos, G. Mpardis and V. Lou, “Dropout prediction in e-learning courses through the combination of machine learning techniques,” ELSEVIER: Computers & Education, p. 950–965, 2009.
[28] N. Thai-Nghe, A. Busche and L. Schmidt-Thieme, “Improving Academic Performance Prediction by Dealing with Class Imbalance,” in International Conference on Intelligent Systems Design and Applications, 2009.
[29] S. Kotsiantis, K. Patriarcheas and M. Xenos, “A combinational incremental ensemble of classifiers as a technique for predicting students’ performance in distance education,” ELSEVIER:Knowledge-Based Systems, p. 529–535, 2010. [30] A. P. Muniyandia, . R. Rajeswarib and R. Rajaramc, “Network
Anomaly Detection by Cascading K-Means Clustering and C4.5 Decision Tree algorithm,” ELSEVIER: Procedia Engineering, p. 174 – 182, 2012.
[31] I. Firdausi, C. Lim, A. Erwin and A. S. Nugroho, “Analysis Of Machine Learning Techniques Used In Behavior-Based Malware Detection,” in International Conference on Advances in Computing, Control, and Telecommunication Technologies, 2010.
[32] B. Qian and K. Rasheed, “Stock market prediction with multiple classifiers,” Springer Science+Business Media, pp. 26-33, 2006. [33] L. Rokach and O. Maimon, “Decision Trees,” in Data Mining and
Knowledge Discovery Handbook, Springer, 2005, pp. pp 165-192. [34] V. Kumar, M. Steinbach and P.-N. Tan,
“http://text.123doc.org/document/1148085-data-mining- classification-basic-concepts-decision-trees-and-model-evaluation-lecture-notes-for-chapter-4-introduction-to-data-mining-pptx.htm,” in Introduction data mining, Addison-Wesley Companion Book Site , 2005, pp. 145-204.
[35] J.-C. Lin and K.-C. Wu, “Analyze on the Learning Behavior of E-Learning,” JDCTA (International Journal of Digital Content Technology and its Applications, vol. 4, no. 5, pp. 1-6, 2010. [36] E. Holohan, M. Melia, D. McMullen and C. Pahl, “Adaptive
E-Learning Content Generation based on Semantic Web Technology,” in International Conference on Artificial Intelligence in Education AIED, 2005.
[37] F. Elghibari, R. Elouahbi and F. El Khoukhi, “An Automatic Updating Process to Control The E-learning Courseware,” International Journal on Advanced Science, Engineering and Information Technology, vol. 7, no. 2, pp. 546-551, 2017.
[38] U. Fayyad, G. Piatetsky-Shapiro and P. . Smyth , “From Data Mining to Knowledge Discovery in Databases,” American Association for Artificial Intelligence, pp. 37-54, 1997.