Vol.6 (2016) No. 6
ISSN: 2088-5334
Prediction Model for Offloading in Vehicular Wi-Fi Network
Mahmoud Abdulwahab Alawi
#1, Raed A Alsaqour
#2, Elankovan Sundararajan
#3, Mahamod Ismail
*#
Research Center for Software Technology and Management, Faculty of Information Science and Technology, Universiti Kebangsaan Malaysia, 43600, Bangi, Selangor, Malaysia.
Email: [email protected], [email protected], [email protected]
*
Department of Electrical, Electronic and System Engineering, Faculty of Engineering and Built Environment Universiti Kebangsaan Malaysia, 43600, Bangi, Selangor, Malaysia
Email: [email protected]
Abstract— It cannot be denied that, the inescapable diffusion of smartphones, tablets and other vehicular network applications with diverse networking and multimedia capabilities, and the associated blooming of all kinds of data-hungry multimedia services that passengers normally used while traveling exert a big challenge to cellular infrastructure operators. Wireless fidelity (Wi-Fi) as well as fourth generation long term evolution advanced (4G LTE-A) network are widely available today, Wi-Fi could be used by the vehicle users to relieve 4G LTE-A networks. Though, using IEE802.11 Wi-Fi AP to offload 4G LTE-A network for moving vehicle is a challenging task since it only covers short distance and not well deployed to cover all the roads. Several studies have proposed the offloading techniques based on predicted available APs for making offload decision. However, most of the proposed prediction mechanisms are only based on historical connection pattern. This work proposed a prediction model which utilized historical connection pattern, vehicular movement, and driver profile to predict the next available AP. The proposed model is compared with the existing models to evaluate its practicability.
Keywords— vehicular network; Markov predictor; 4G LTE-A; Wi-Fi; VANET; prediction model
I. INTRODUCTION
In a heterogeneous vehicular environment, vehicle users have the opportunity to use different types of the radio access technologies (RATs) with varying capability and load at different locations. The development of intelligent transportation system (ITS) makes the onboard unit (OBU) devices have multiple interfaces which can connect to multiple networks simultaneously [1], [2]. Though, the operating environment of these networks may change rapidly especially in a high dynamic network environment. In general, the cellular network is normally available most of the time, whereas other networks such as Wi-Fi AP’s will be available time to time. On the other hand, we have noted that Wi-Fi and cellular networks (i.e 4GLTE-A/3G) are two wireless access technologies that are commonly used. However, these two access technologies have significant differences. The former is free and cheaper but offers higher throughput. It also operates on the unlicensed spectrum but it covers a relatively small area. The latter is operated on licensed bands with large coverage area. Though, it requires the additional cost to use. As Cisco [3] predict by 2019 there will be nearly 1.5 mobile devices per capita and all
these devices will need a direct connection to the cellular network. Therefore, the need of having alternative networks to offload cellular data is currently high. Thus, Wi-Fi could be effectively utilized to relieve the overload in the cellular network. Several works have studied the system of offloading the cellular infrastructure using Wi-Fi and Femtocells. However, Wi-Fi is widely used for this purpose [4]. Some part of the data targeted for cellular infrastructure can be directed to Wi-Fi. Thus, the congestion to cellular infrastructure can be reduced.
Offloading data to Wi-Fi is being standardized by the third generation partnership project (3GPP) [5]. Currently, the researchers are focused on using the vehicular ad-hoc network (VANET) to offloading cellular network traffic and this is known as vehicle Wi-Fi offloading (VWO) [6]-[9]. However, VWO will not be feasible if the vehicle users have no prior information about future Wi-Fi AP availability. Prior information on the future Wi-Fi AP availability is crucial in exploiting the network heterogeneity. Predicting wireless network availability problem is defined as guessing a mobile node’s next AP and its available capacity as it moves through a wireless network [10]. The prediction mechanism helps the vehicle users to take proactive
connection decision in order to guarantee the QoS of the different applications [9]. Predicting network availability can support all types of applications that do not require continuous connectivity (i.e file transfer, email, software update). It helps the vehicle user to delay the transmission to the cellular network if there is a possibility of encountering the Wi-Fi AP in future.
In this paper, a prediction model for offloading cellular traffics in a vehicular scenario is proposed. The model makes use of historical information, vehicular movement and driver profile in the offloading decision.
The rest of the paper is organized as follows. Section II related work and the proposed prediction model are discussed. Section III performance evaluation metrics and qualitative comparisons of the proposed model with other existing models are presented. Lastly, Section IV concludes the paper.
II. MATERIALS AND METHODS
A. Related Work
Several mobility prediction techniques have been proposed in the literature. Most of the proposed techniques rely on the fact that the user movements are not totally random, it follows certain patterns. However, there are some irregularities in the mobility pattern which require the prediction techniques to utilize certain metrics such as user current location, velocity and moving direction.
The authors in [11]-[14] adopt Markov prediction model to predict the mobile user future location. Both [11], [13] use a real dataset obtained from [15] to train the model. However, in [12], [14], global position system (GPS) was used to collect the location information which is then incorporated into a Markov model to predict the user’s future locations.
In [14], the authors proposed the breadCrumbs system for forecasting mobile connectivity. The proposed system not only predicts the next APs but also forecasts the capacity of next encounter AP. In [11], a hidden Markov model (HMM) is proposed. The model uses the current and previous locations of the connected APs to predict the next AP. The results show that the prediction accuracy falls exponentially as the sequence length of the APs increases; this is due to nature of user behavior which involved some elements of uncertainty.
In [13], the authors proposed the algorithm to predict next location based on the number (n) of previously visited locations. The algorithm was derived from mobility Markov chain (MMC) and is called n-MMC. Three different datasets were used to validate the accuracy of n-MMC and the results show that the prediction accuracy was in the range of 70% to 90% when n=2. However, it was shown that a large value of n does not have any significant effect on the accuracy of the prediction. In general, all these proposed methods were focused on mobile device users which are moving at a low speed.
The issue of using either centralized or decentralized method to predict the next available AP is discussed in [10]. The authors compared these two approaches to determine the reliability and accuracy of each method. In the centralized method, the prediction agent is bound on AP. The AP is responsible for predicting the next AP of all the mobile hosts (MH’s). However, in the decentralized method, each MH is responsible for predicting the next AP by itself.
It was shown that the decentralized method is more reliable and accurate compared to the centralized one. This result was also justified in [16] where the decentralized approach was used and the results revealed that the method offers significant prediction accuracy.
Recently, different VWO techniques were proposed in the literature. Some of these techniques use prediction method to predict the future AP the vehicle encounter. This helps the vehicle in making the offloading decision.
In [17], Wiffler model was designed to augments 3G capacity. It uses a simple model to predict Wi-Fi connectivity. It delays data transfer in order to offload more data on Wi-Fi. It does so, only if delay reduces 3G usage and the transfers can be completed within the application’s tolerance threshold. The proposed prediction method is based on the observation that if the mobile node meets APs frequently, then the probability to meet the next AP within a short interval of time is high. However, the prediction error for this model is about 20% for a prediction time interval of 100 seconds.
Furthermore, the authors in [16], [18]-[20] proposed prediction techniques based on a table that the vehicle has to maintain and update while connecting to different APs. The table was used to store the position of different APs the vehicle meets. The urban scenario was the main focus and GPS system was used to update the location of the moving vehicle.
In [16] , the authors proposed prediction methods based on the current connected AP and the vehicular trajectory motion to predict the next available AP and its expected data capacity. This will help the vehicle to make the right decision for offloading cellular data to the available APs. The proposed method used prediction table to store all the connection patterns of the vehicle. Then, it uses the information in the prediction table to predict the future AP.
Furthermore, the authors use vehicle trajectory computation to compute the direction movement of the vehicle. Vehicle trajectory computation determines how close the vehicle is moving toward the predicted AP. If the vehicle notes that, the signal strength from the current connected AP falls below a certain threshold. It starts to use the prediction table to predict the next AP with its capacity.
Two conditions must be satisfied for the vehicle to offload the cellular network to AP. First, if the time to reach to the predicted AP is below than the delay requirement of the specific application. Second, if the expected data capacity of the predicted AP is greater than the amount of the data that can be transferred to that AP. When both of these conditions are fulfilled the vehicle will defer the data transmission and wait to meet the predicted AP.
However, the weakness of this work is of relying on the current location to predict the future location. This is not efficient because the vehicle may move from a different direction and the potential future AP will not be discovered.
Contrariwise, the research work in [18] proposed a contact map which is used to predict a vehicle’s potential contact APs ahead on the route and the respective transition probabilities. The contact map was modelled as a graph, in which the vertex represents the APs and the edges are the transition contexts. The contact map information is kept the table which consists of three columns. The first column represents the next encounter AP. The second column shows the previous contacted AP and the last column represents the transition probability. The vehicle will look up through the table to predict the next AP the vehicle may encounter. However, from this work, the transition probability is only based on the previous contact AP before the transition. No any moving direction of the vehicle is taken into consideration.
Moreover, the authors in [19] predict the next AP based on the position and movement direction of the vehicle. The prior knowledge of the next AP to be encountered reduces the scanning process for handoff. The prediction method utilizes GPS system to get the position and movement direction of the vehicle. The AP with higher probability to be encounter next is always scanned first. This reduces the scanning time if the chosen AP is the actual AP the vehicle meets. The vehicle movement is also considered in determining the next AP. The vehicle has to maintain a queue of three elements. This queue will store the coordinate of the three latest positions of the vehicle. The queue is updated only when the distance between the current and previous positions are greater than a pre-defined threshold ( . If this is true the first element in a queue is removed. When the queue is full, two angles are calculated and if these two angles are greater than threshold ( ) threshold the turning event is detected and improves the prediction method. Nevertheless, the prediction algorithm proposed suffers from false negative and false positive errors when determining the turning detection of the vehicle.
In [20] an offloading technique based on predicting the next encountered AP was proposed. The objective of the proposed technique is to optimize the user satisfaction. When the vehicle wants to connect to the cellular network it has to estimate the time from the current location to the next AP. If the delay time is accepted the vehicle waits for the next AP for access connection. If the vehicle did not meet the AP as estimated time indicates, it has to re-calculate the estimation time by taking into consideration of the current situation and makes a new decision. It was assumed that the meeting time between the vehicle and APs follows the exponential Gaussian distribution. If the delay time is not acceptable, the vehicle will connect directly to the cellular network.
B. The Proposed Prediction Model
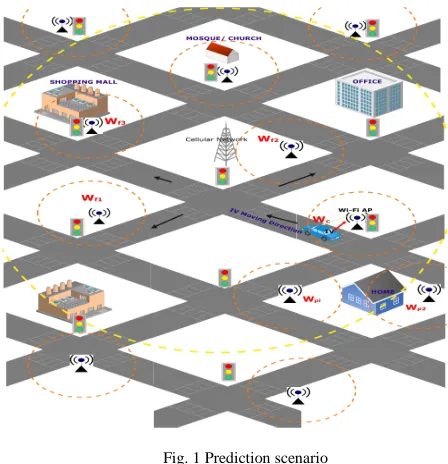
The proposed model is based on HVN architecture (refer Fig. 1. Two types of networks are present, Wi-Fi network
which is based on IEEE802.11 technology and 4G LTE-A network. The 4G LTE-A base station is referred as LTE-A eNB and IEEE802.11 access points are named as Wi-Fi APs.
Fig. 1 Prediction scenario
All Wi-Fi APs are in open access mode and has enough bandwidth to accommodate certain numbers of the vehicle at the same time. Wi-Fi AP's are not overlapping; they are placed at a certain distance apart. The OBU of the interesting vehicle (IV) is equipped with two network interfaces: one to communication with the cellular network and the other is for Wi-Fi AP communication. Each IV is also equipped with GPS which is used to update the locations where IV connect and disconnect to the specific Wi-Fi AP. This model used to predict the next AP the moving vehicle will encounter. This will help the IV in deciding of either to wait or to connect directly to the cellular network. The decision is based on the availability of the next AP and delay requirement of the application runs on IV. Three criteria are used (refer to Fig. 2), namely, historical information, vehicular movement and driver profile.
1)Historical information: Consider a scenario whereby
the IV moves along the road and connect to several access points (i.e Wi-Fi APs) along its journey. The historical patterns of successful connected APs are recorded. This pattern includes previous AP contacted by IV current AP connected, and next AP encounter observed by IV. The user
may move away from this AP (say ) and connect to an
adjacent AP , or after some interval of time. The IV observed this connection pattern and stores the information in the prediction table (PT).
PT is the table created by the IV which stores the historical connection pattern. If cellular access becomes available while the receive signal strength (RSS) from the current AP is smaller than the threshold ( , the IV computes the total number of transition from to the next
using the information in PT as in Equation (1).
If is greater than threshold meaning more information is available to predict the transition from to the next . However, if is less than the the IV has to update its PT table.
Fig. 2 Proposed prediction model
(1)
where is a total number of transition from to the
next .
We apply first and second order Markov chain to predict the transition from to the next . Markov chain model has been studied in [11], [21] to solve this problem. Both first (Equation (2)) and second order (Equation (3)) Markov rules are adopted whereby the future AP is predicted using the current and previous visited APs. The Markov chain predicts different transition that might be happening for the scenario shown in Fig. 1. Using First-order Markov chain, two possible transitions may happen which are or . However, rely on First-order Markov rule only is not sufficient because the IV may come from the opposite direction which can increase the prediction error. To solve this we also adopt the Second order Markov predictor in order to increase the prediction accuracy.
(2)
(3)
where is the probability of the next AP ( using the current connected AP ( and is the probability
of the next AP using previous contacted AP
( .
In this case, four possible transitions may happen from
previous, current to future connected AP
(i.e, , , , and )
refer to Fig. 1. These transition patterns are recorded in PT table. From PT information, two transition probabilities are calculated. The probability of the next AP using previous contacted AP and the probability of the next AP using the current connected AP.
2)Vehicular Movement: Vehicular movement is the
crucial criterion for determining if the IV is moving towards
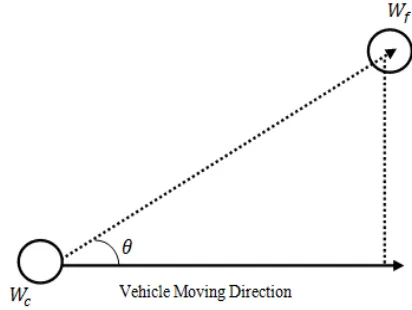
the predicted AP. The vehicular movement is computed whenever the IV needs to predict the next AP. This will assure that if the IV is moving towards the predicted AP. From the Fig. 3. It is assumed that using GPS, IV is able to
obtain its location when its connect to AP . In order for the IV to know if it is moving toward the predicted AP, it must calculate the angle made between the current connected AP and future APs. This angle must be calculated into two different positions to detect the turning effect of the vehicle. If the first calculated angle is smaller than the second angle means the vehicle is moving away from the predicted AP. However, if the second angle is smaller than the first angle, it indicates that the vehicle is moving closer to the predicted AP. The average angles between these positions are used to compute the probability of how close the vehicle moves toward the specific AP.
Fig. 3 Vehicular movement Computation
3)Driver Profile: There are some common places that
normally most drivers visit on a daily basis. These places can be home, office, shopping malls, and restaurant or worships places. To know the commonly visited location is useful in defining movement pattern of the IV. It is clearly known that during the morning time most of the people drive to workplaces, in the afternoon, we normally rush to restaurants for lunch. During the weekend, the hot destination point is Shopping malls. However, some people visit the worship area in daily basis which also must be taken into consideration. All this movement pattern helps in increase the probability of the vehicle to move on certain location depend on the time or days of the week.
Moreover, after getting all the three probabilities, the probability product of these three probabilities is calculated. The turple with higher probability product is chosen as the next available AP. The source vehicle also estimates the time to reach the next AP. This helps the IV to decide if it can wait for the next AP encounter or send the traffic direct to the cellular network.
TABLEI
COMPARISON OF THE PROPOSED PREDICTION MODEL WITH OTHER EXISTING MODELS
Prediction Model Prediction Parameters Performance Metrics Evaluation Method Simulator
Proposed model •Historical information
• Vehicular movement
• Driver profile
• Prediction error
• Offloading efficiency
Simulation MATLAB
S. Lee et al.[16] • Historical information
•Vehicular trajectory
• Prediction Error
• Offloading Ratio
Analytical/Simulation Customer
D. Zhang et al. [18] •Contact Map
•Historical information
• Prediction Accuracy Simulation NS2
A. Balasubramanian et
al. [17] •
Historical information • Prediction Error
• Offloading Ratio
Experiment Null
M. Almulla et. al [19] • Vehicular Movement • Prediction Error Simulation NS2
A.J.Nichlson et. al[14] • Markov Predictor • Prediction Accuracy Analytical Null
P. S. Prasad [11] •Markov Predictor • Prediction Accuracy Analytical Null
S. Gambs et al.[13] •Markov Predictor • Prediction Accuracy Experimental Null
N. Wang[20] •Vehicle movement • Prediction Accuracy
• User satisfaction
Experiment Null
III.RESULTS AND DISCUSSION
A. Performance Metrics Used to Evaluate The
Proposed Prediction Model
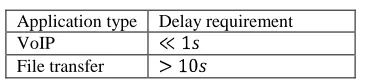
The proposed prediction model will be evaluated in term of prediction error (PE) (Equation (4)) and the offloading ratio (OR) (Equation (5)). The PE was examined against the number of APs exist and the vehicles speed. On the other hand, for OR we examine the efficiency of the proposed model by using both delay (i.e VoIP) and non-delay sensitive (i.e FTP) applications. These applications were evaluated based on the different maximum delay tolerance requirement as indicated from Table 2. The VoIP application employs G.729 codec and the delay requirement is set to be varied in several values. For FTP, we enable the IV able to download a large file in order to evaluate the offloading efficiency of the proposed model.
TABLE II
DELAY REQUIREMENTS FOR DIFFERENT APPLICATION TYPE
Application type Delay requirement VoIP
File transfer
Definition 1 Prediction error (PE) is the relative average error between the numbers of APs predicted correctly (NPC) and the total number of AP meeting observed in the measurement (TNPO)[17], i.e.,
(4)
where is the prediction error, NPC number of AP predicted correctly and TNPO is the total number of AP meeting observed
Definition 2 Offloading ratio (OR) is the ratio of the total traffic offloaded (TTO) to the total traffic generated by the vehicle traffic (TTG)[9], i.e.,
(5)
where OR offloading ratio, TTO is the total traffic offloaded and TTG is the total traffic generated by the IV.
B. Comparison of The Proposed Model with The
Existing Related Prediction Models
In this section, we qualitatively evaluate the proposed model with the existing related model in the state of art. Table 1, shows the comparison of the proposed model with other models in terms of parameters used for prediction, performance metrics used for evaluation, evaluation method and simulator used for evaluation (if any). From Table 2, it shows that most of the existing model relays on the information history of the moving vehicles. The existing models fail to take into accounts the driver behavior and vehicular movement as the prediction criteria. However, the model proposed in this paper utilized all three parameters in design high accuracy prediction method. Furthermore, in future work, the proposed prediction model will be validated using MATLAB simulator. We choose MATLAB as the simulation tool because of its efficiency on recognizing and predicting the patterns. Other available network simulators are, NS2, NS3, and QualNet.
C. Simulation Parameters and Results
In this section, we analysis the proposed model based on Matlab to evaluate its performance. The simulation environment is based on an urban scenario with heterogeneous network features as shown in Fig. 4. The entire simulation area is composed of 8 perpendicular streets whereby each street is 1km. Both LTE-AeNBs and APs are deployed.
The number and the positions of eNBs are fixed while the numbers of APs are determined by the simulation scenario and their positions are randomly changed at every simulation run. We adopt the pass loss model proposed in [22], which is the combination of free space path loss model with Two-Ray ground path loss model. For 4G
LTE-A network, we use Okumura-Hata path loss model for urban scenario[23]. In our simulation, we set four points as departure and destination points and these points can be home (H), office (O), restaurant(R) or shopping mall (M). We set the probability of the IV to move to all these points to be which range from 0 to 1. Initially, the IV depart from home and moves to the assigned locations using different routes towards the designed destinations.
Fig. 4 Simulation environment
The simulation runs for 500 times to collect the AP connection patterns and store in PT before starting the prediction process. When the amount of the historical information is above threshold , IV uses the PT to predict the next AP. Other important simulation parameters are listed in Table 3.
TABLE III
SIMULATION PARAMETERS
Simulation parameters Value
Frequency band AP/LTE-A(GHz) 2.4/2
Transmission power of AP/ LTE-A [dBm] 17/23
Height of AP/eNBs 1.5/20m
LTE transmitter and Receiver Gain (Gt/Gr) 1dB/1dB
Number of vehicles 50-200
Vehicle speed 10m/s-16m/s
Simulation scenario Urban scenario
Number of APs 9-36
Coverage area of each AP 200m
Data rate of each AP 5Mbps
Number of eNBs 2
Coverage Area of eNBs 8km
Data rate of eNB 100 Mbps
-80dB
Confidence interval 95%
We analyze PT created during simulation in term of connection patterns observed and recorded in PT. Fig. 5 shows the commutative distribution function (CDF) of the connection patterns for different value of . The connection pattern means in which pattern the IV accesses the AP during its normal routine. For example, IV observe a connection patter of 30 times. This means, IV access then go to and then move to 30 times during the simulation. From the simulation results, it is clearly seen that, when the value of decreased the
number occurrence of each pattern are also decreased.if we take 50% of connection patterns are appeared less than 50 times. However, for the larger value of , some connection patterns appeared more than others. For example, , 50% of the connection patterns are reappeared more than 200 times, this means the probability of IV moving to specific locations is high. To reduce the biasness we set the value of to be 0.5 in order to assure that a variation of connection patterns is normally distributed. Each IV has an equal chance to move to any of the predefined locations (i.e home, office, restaurant or shopping mall).
0 50 100 150 200 250 300 350 400 450 0.1
0.2 0.3 0.4 0.5 0.6 0.7 0.8 0.9 1
Connection Pattern Connection Pattern Connection Pattern Connection Pattern
C
D
F
C
D
F
C
D
F
C
D
F
Prob 0.4 Prob 0.9 Prob 0.8 Prob 0.5 Prob 0.6 Prob 0.7 Prob 0.3 Prob 0.2 Prob 0.1
Fig. 5 CDF for different value of Prob ( ranging from 0-1 with 95% confidence level
0 1 2 3 4 5 6 7 8 9 10 11 12 13 14 15 16 17 18 19 20 21 22 23 24 25
0 100 200 300 400 500 600 700 800 900 1000
AP IDs AP IDs AP IDs AP IDs
F
re
q
u
e
n
c
y
F
re
q
u
e
n
c
y
F
re
q
u
e
n
c
y
F
re
q
u
e
n
c
y
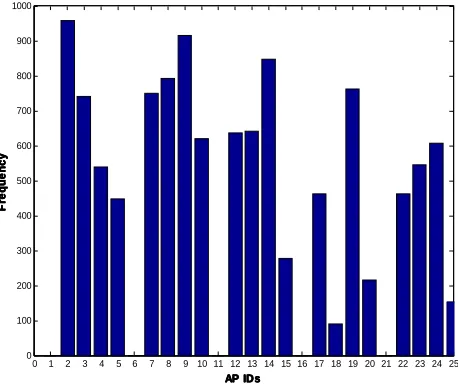
Fig. 6 Frequency of each AP visited in simulation
In Fig. 6, we record the number of times each AP was visited during simulation. The result shows that, for 25 APs few APs such as AP ID 1, 11, 16, 21 are not connected at all by IV. This prevails that, during travel, the IV has a chance to connect to any AP alongside the road during the simulation. Addition, the graph revealed that the driver likes to follow some common routes that why some of the APs show higher connection frequency than the other APs.
Refer to Fig. 7, APs ID 2, 9, 14 connection frequencies are above 800 times per simulation.
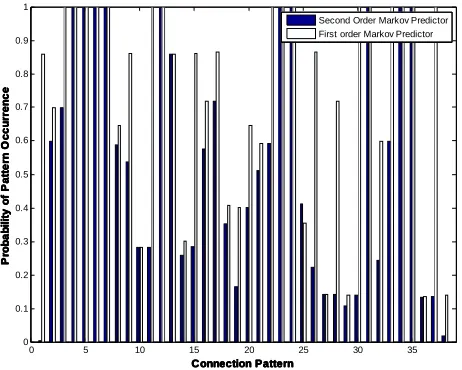
As we discuss above, our proposed model utilizes both current and previous AP contacted techniques to predict the next AP. In Fig. 7 we compared these two techniques to determine their performance in term of the probability of occurrence of different connection patterns in predicted the next AP.
From Fig. 7, it shows that using first order Markov predictor gives a higher probability for difference connection pattern occurrence compare to the second order Markov predictor. However, relaying only on the first order Markov predictor may decrease the prediction accuracy. This mainly occurs when the IV changes its moving direction (i.e. IV moves in opposite direction). To improve the prediction accuracy, this paper adopts both first and second orders Markov predictors.
0 5 10 15 20 25 30 35
0 0.1 0.2 0.3 0.4 0.5 0.6 0.7 0.8 0.9 1 Connection Pattern Connection Pattern Connection Pattern Connection Pattern P ro b a b il it y o f P a tt e rn O c c u rr e n c e P ro b a b il it y o f P a tt e rn O c c u rr e n c e P ro b a b il it y o f P a tt e rn O c c u rr e n c e P ro b a b il it y o f P a tt e rn O c c u rr e n c e
Second Order Markov Predictor First order Markov Predictor
Fig. 7 First and second order Morkov predictor probabilities
IV.CONCLUSIONS
Predicting the next available AP and expecting data capacity is crucial for the moving vehicle to make a right offloading decision. This paper proposed the prediction model for Wi-Fi vehicular offloading which utilized several parameters for prediction. These parameters include information history, vehicular movement, and driver profile. The proposed model then compared with the existing related models in terms of the prediction parameters, performance metrics, evaluation method and the simulator tools used. Furthermore, the proposed model was evaluated using MATLAB and some preliminary results were presented. In our future work, this model will be evaluated in term of prediction error and the offloading ratio and benchmarked with the existing related models.
ACKNOWLEDGMENTS
This research was supported in part by the Ministry of Higher Education, Zanzibar University, and Universiti Kebangsaan Malaysia, under the Fundamental Research Grant Scheme (FRGS/1/2016/ICT03/UKM/02/2).
REFERENCES
[1] M. A. Alawi, R. A. Saeed, A. A. Hassan, and R. A. Alsaqour, "Simplified gateway selection scheme for multihop relay in vehicular ad hoc network," International Journal of Communication Systems, vol. 27, pp. 3855-3873, Dec 2014.
[2] M. A. Alawi, R. A. Saeed, and A. A. Hassan, "Cluster-based multi-hop vehicular communication with multi-metric optimization," in Computer and Communication Engineering (ICCCE), 2012 International Conference on, 2012, pp. 22-27.
[3] Cisco, "Cisco Visual Networking Index: Global Mobile Data Traffic Forecast Update, 2014–2019," Visual Networking Index 2015.
[4] A. Aijaz, H. Aghvami, and M. Amani, "A survey on mobile data offloading: technical and business perspectives," Wireless Communications, IEEE, vol. 20, pp. 104-112, 2013.
[5] I. F. Mobility, "Seamless Wireless Local Area Network (WLAN) Offload," ed: Stage, 2012.
[6] G. Zhioua, M., H. Labiod, N. Tabbane, and S. Tabbane, "VANET Inherent Capacity for Offloading Wireless Cellular Infrastructure: An Analytical Study," in New Technologies, Mobility and Security (NTMS), 2014 6th International Conference on, 2014, pp. 1-5. [7] F. Malandrino, C. Casetti, C. Chiasserini, and M. Fiore,
"Offloading cellular networks through ITS content download," in Sensor, Mesh and Ad Hoc Communications and Networks (SECON), 2012 9th Annual IEEE Communications Society Conference on, 2012, pp. 263-271.
[8] M. Gramaglia, C. Bernardos, and M. Calderon, "Seamless internet 3G and opportunistic WLAN vehicular connectivity," EURASIP Journal on Wireless Communications and Networking, vol. 2011, p. 183, 2011.
[9] S. Wang, T. Lei, L. Zhang, C.-H. Hsu, and F. Yang, "Offloading mobile data traffic for QoS-aware service provision in vehicular cyber-physical systems," Future Generation Computer Systems, vol. 61, pp. 118-127, 8// 2016.
[10] J.-M. François and G. Leduc, "AP and MN-Centric Mobility Prediction: A Comparative Study Based on Wireless Traces," in NETWORKING 2007. Ad Hoc and Sensor Networks, Wireless Networks, Next Generation Internet: 6th International IFIP-TC6 Networking Conference, Atlanta, GA, USA, May 14-18, 2007. Proceedings, I. F. Akyildiz, R. Sivakumar, E. Ekici, J. C. d. Oliveira, and J. McNair, Eds., ed Berlin, Heidelberg: Springer Berlin Heidelberg, 2007, pp. 322-332.
[11] P. S. Prasad and P. Agrawal, "Movement Prediction in Wireless Networks Using Mobility Traces," in Consumer Communications and Networking Conference (CCNC), 2010 7th IEEE, 2010, pp. 1-5.
[12] D. Ashbrook and T. Starner, "Learning significant locations and predicting user movement with GPS," in Wearable Computers, 2002. (ISWC 2002). Proceedings. Sixth International Symposium on, 2002, pp. 101-108.
[13] B. Gambs, M.-O. Killijian, M. N, and e. d. P. Cortez, "Next place prediction using mobility Markov chains," presented at the Proceedings of the First Workshop on Measurement, Privacy, and Mobility, Bern, Switzerland, 2012.
[14] A. J. Nicholson and B. D. Noble, "BreadCrumbs: forecasting mobile connectivity," presented at the Proceedings of the 14th ACM international conference on Mobile computing and networking, San Francisco, California, USA, 2008.
[15] A. Jøsang, "The right type of trust for distributed systems," in Proceedings of the 1996 workshop on New security paradigms, 1996, pp. 119-131.
[16] S. Lee and S. Lee, "User-Centric Offloading to WLAN in WLAN/3G Vehicular Networks," Wireless Personal Communications, vol. 70, pp. 1925-1940, 2012.
[17] A. Balasubramanian, R. Mahajan, and A. Venkataramani, "Augmenting mobile 3G using WiFi," Proceedings of the 8th International Conference on Mobile Systems, Applications, and Services, pp. 209 - 222, 2010.
[18] D. Zhang and C. K. Yeo, "Enabling Efficient WiFi-Based Vehicular Content Distribution," IEEE Transactions on Parallel and Distributed Systems, vol. 24, pp. 479-492, 2013.
[19] M. Almulla, Y. Wang, A. Boukerche, and Z. Zhang, "Design of a Fast Location-Based Handoff Scheme for IEEE 802.11 Vehicular Networks," IEEE Transactions on Vehicular Technology, vol. 63, pp. 3853-3866, 2014.
[20] N. Wang and J. Wu, "Opportunistic WiFi offloading in a vehicular environment: Waiting or downloading now?," in IEEE INFOCOM 2016 - The 35th Annual IEEE International Conference on Computer Communications, 2016, pp. 1-9.
[21] B. Gambs, M.-O. Killijian, M. N, #250, #241, et al., "Next place prediction using mobility Markov chains," presented at the Proceedings of the First Workshop on Measurement, Privacy, and Mobility, Bern, Switzerland, 2012.
[22] C. Sommer, S. Joerer, and F. Dressler, "On the applicability of Two-Ray path loss models for vehicular network simulation," in Vehicular Networking Conference (VNC), 2012 IEEE, 2012, pp. 64-69.
[23] S. S. John, "Introduction to RF propagation," ed: Wiley-Interscience, 2005.