University of New Orleans University of New Orleans
ScholarWorks@UNO
ScholarWorks@UNO
University of New Orleans Theses and
Dissertations Dissertations and Theses
Summer 8-4-2011
Computational Pipeline for Human Transcriptome Quantification
Computational Pipeline for Human Transcriptome Quantification
Using RNA-seq Data
Using RNA-seq Data
Guorong Xu
University of New Orleans, [email protected]
Follow this and additional works at: https://scholarworks.uno.edu/td
Part of the Bioinformatics Commons, and the Computer Sciences Commons
Recommended Citation Recommended Citation
Xu, Guorong, "Computational Pipeline for Human Transcriptome Quantification Using RNA-seq Data" (2011). University of New Orleans Theses and Dissertations. 343.
https://scholarworks.uno.edu/td/343
This Thesis is protected by copyright and/or related rights. It has been brought to you by ScholarWorks@UNO with permission from the rights-holder(s). You are free to use this Thesis in any way that is permitted by the copyright and related rights legislation that applies to your use. For other uses you need to obtain permission from the rights-holder(s) directly, unless additional rights are indicated by a Creative Commons license in the record and/or on the work itself.
Computational Pipeline for Human Transcriptome Quantification using RNA-seq data
A Thesis
Submitted to the Graduate Faculty of the University of New Orleans in partial fulfillment of the requirements for the degree of
Master of Science in
Computer Science Bioinformatics
by
Guorong Xu
ii
iii
Acknowledgments
First and foremost, I want to thank my advisor Dr. Dongxiao Zhu. His endless
support and wisdom helped me to finish this thesis. His enthusiasm for Bioinformatics
was contagious—and I definitely caught it. His depth of knowledge and very precise
academic guidance brought me to develop a computational pipeline for characterizing
human transcriptome using RNA-seq.
I would like to thank Dr. Erik Flemington. The major experiment data and
biology knowledge for this study were provided by his lab. I really appreciate his
consistent support.
I wish to thank our bioinformatics group members: Nan Deng, Lipi Rani Acharya,
Thair Judeh, Tin Chi Nguyen, Kristen Marie Johnson. Each individual provided insights
that guided and challenged my thinking, substantially improving the finished product.
Lastly, I would like to thank my family members, especially my wife Yan Gao for
supporting and encouraging me to pursue this degree. Without my wife’s encouragement,
iv
Table of Contents
List of Figures ... vi
List of Tables ... vii
Abstract ... viii
Chapter 1. Background and Introduction ... 1
1.1 Introduction to transcriptome ... 1
1.2 Gene expression ... 1
1.3 Microarray technology ... 2
1.4 Next-generation sequencing... 2
1.4.1 RNA-seq technology ... 3
1.4.2 Short reads alignment ... 4
1.4.3 Junction mapping ... 5
1.4.4 Data Format – SAM/BAM ... 6
1.4.5 Quantification of gene expression using RNA-seq ... 8
1.5 Motivation ... 9
1.6 Overview ... 9
Chapter 2. Transcriptome and Targetome Analysis in MIR155 Expressing Cells using RNA-seq ... 11
2.1 Introduction ... 11
2.2 Results ... 14
2.2.1 Model system ... 14
2.2.2 Read mapping ... 15
2.2.2 Expression analysis ... 16
2.2.3 Relative expression and distribution of genes with 3’ UTR MIR155 seed sequences ... 17
2.2.4 NGS versus microarray studies ... 19
2.2.5 3’ UTR reporter analysis ... 21
2.2.5 Validation of RNA-seq analysis using 3’UTR luciferase reporter assay ... 23
2.2.6 Global analysis of terminal exon relative expression ... 25
2.3 Discussion ... 27
2.4 Materials and methods ... 32
2.4.1 Biological experiments ... 32
2.4.2 Sequencing and base calling ... 32
2.4.3 Read mapping to genome and across splice sites ... 33
2.4.4 Gene expression analysis using RNA-seq data ... 34
2.4.5 Analysis of Agilent MIR155 arrays ... 34
2.4.6 Statistical treatment of sequencing and microarray data ... 35
2.4.7 Cross-species gene mapping ... 36
2.4.8 Cross-platform comparison of targetome prediction using bitmap ... 36
2.4.9 Statistical comparison of a pair of populations ... 36
2.4.10 3’ UTR-luciferase reporter analysis ... 37
2.4.11 Accession numbers ... 37
2.5 Supplemental Figures... 38
v
3.1 Background ... 40
3.2 Analysis of EBV gene expression in Mutu I and Akata cells ... 41
3.3 Splicing evidence in Mutu I and Akata... 45
3.4 Conclusions ... 47
Chapter 4. SAMMate GUI software system ... 49
4.1 Introduction ... 49
4.2 Key features ... 50
4.2.1 Key feature: calculating genomic feature abundance scores ... 50
4.2.2 Key feature: generating signal map for peak detection ... 53
4.2.3 Key feature: generating wiggle files for visualization ... 53
4.2.4 Key feature: generating alignment report ... 55
4.3 Conclusion ... 55
Chapter 5. Conclusion and Future Works ... 56
5.1 Conclusion ... 56
5.2 Future works ... 57
References ... 59
vi
List of Figures
Figure 1.1. Combination of exon reads with junction reads to accurately calculate gene
expression RPKM scores ... 5
Figure 1.2. Example of single-end reads in SAM format. ... 7
Table 1. 1 Overview of 11 mandatory fields in alignment line ... 7
Table 1. 2 Overview of optional fields in alignment line ... 8
Figure 2.1 The biological system ... 15
Figure 2.2. Genes containing MIR155 seed sequences are enriched in down-regulated fractions... 19
Figure 2.3. Cross-platform comparison of transcriptome quantification using bitmap. ... 21
Figure 2.4. Validation of RNA-seq analysis using 3’ UTR assay. ... 22
Figure 2.5. Isoform-dependent regulation of TAF5L by MIR155... 28
Figure 2.6. Mitigated response of endogenous genes to MIR155 is mediated in part by alternate transcript structure ... 29
Supplemental Figure 2.1. Lack of read evidence for MIR155 seed containing isoform of PCDH9. ... 38
Supplemental Figure 2.2. Read evidence for the last exon of MAP3K10 shows a sharp drop in mapped reads upstream from the MIR155 seed site. ... 39
Supplemental Figure 2.3. Top biological functions implicated by Ingenuity Pathways Assessment (IPA) analysis of regulated genes ... 39
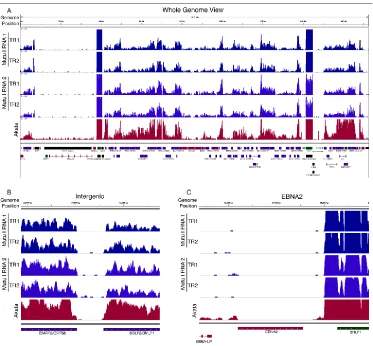
Figure 3.1. Visualization of RNA-seq coverage across the EBV genome ... 42
Figure 3.2. RPKM values for EBV genes in Mutu I (A) and Akata (B) cells. ... 45
Figure 3.4. Visualization of junction evidence for EBNA1 ... 47
Figure 4.1. Key features of SAMMate... 50
Figure 4.2. Combination of exon reads with junction reads to accurately calculate gene expression RPKM scores ... 52
vii
List of Tables
viii
Abstract
The main theme of this thesis research is concerned with developing a
computational pipeline for processing Next-generation RNA sequencing (RNA-seq) data.
RNA-seq experiments generate tens of millions of short reads for each DNA/RNA
sample. The alignment of a large volume of short reads to a reference genome is a key
step in NGS data analysis. Although storing alignment information in the Sequence
Alignment/Map (SAM) or Binary SAM (BAM) format is now standard, biomedical
researchers still have difficulty accessing useful information. In order to assist biomedical
researchers to conveniently access essential information from NGS data files in
SAM/BAM format, we have developed a Graphical User Interface (GUI) software tool
named SAMMate to pipeline human transcriptome quantification. SAMMate allows
researchers to easily process NGS data files in SAM/BAM format and is compatible with
both single-end and paired-end sequencing technologies. It also allows researchers to
accurately calculate gene expression abundance scores.
Keywords
Transcriptome
Gene Expression
Next-Generation Sequencing
RNA-seq Pipeline
SAMMate
SAM/BAM Format
1
Chapter 1. Background and Introduction
1.1 Introduction to transcriptome
The transcriptome is the set of all RNA molecules, including mRNA, rRNA, tRNA, and
other non-coding RNA produced in one or a population of cells, or it can be referred to as the
total of transcripts (or called isoform) or the specific subset of transcripts in a living cell. Unlike
the genome that nearly does not change in a living cell except for mutation cases, the
transcriptome varies according to different external environmental conditions, such as
specialized tissues or cell lines. Most of the transcripts are processed by splicing to remove
introns and generate a mature transcript or messenger RNA (mRNA) that only contains exons.
Transcriptome is highly diverse, dynamic, complex and overlapping. Importantly, the range of
transcriptome is enhanced by alternative splicing. Alternative splicing is a fundamental
molecular process of multiple transcripts from a single gene due to variations in the splicing
reaction of pre-mRNA. An exon can be either included or excluded from the mature transcripts.
Thus, different splicing variants are generated from the same gene.
1.2 Gene expression
Gene expression is the synthesis process of a functional gene product by using the genetic
information from a gene. These functional gene products include proteins and functional RNAs,
the latter are in non-protein coding genes such as ribosomal RNA (rRNA) genes or transfer RNA
(tRNA) genes. There are two major stages in gene expression. The first stage is transcription. In
this stage, a single RNA molecule (a primary transcript) with basically the same sequence as the
2
information required for protein synthesis. Therefore, most mature primary transcripts or
mRNAs only contain exons by splicing to remove intron regions. The second stage is translation.
In this stage, mRNA along with transfer RNA (tRNA) and ribosomes work together to produce
proteins. Other stages of gene expression include RNA splicing and post-translational
modification of a protein, and any step of gene expression may be modulated. In genetics, gene
expression fundamentally interprets the genetic code stored in DNA.
1.3 Microarray technology
Microarray technology is referred to as a multiplex lab-on-a-chip technology that is
widely used in molecular biology. A small solid glass slide or silicon thin-film cell attaches a
large amount of different nucleic acid probes to hybridize a cDNA or cRNA sample (called
target) under high-stringency conditions. The relative abundance of nucleic acid sequences in the
target can be usually determined by detection and quantification of the probe-target hybridization.
Microarray technology was once as the experiment of choice for transcriptome analysis.
Applications of microarray technology widely involve gene discovery, disease diagnosis, drug
discovery, toxicological research and so on. In contrast to digital counts of transcript abundance
produced by Next-Generation Sequencing (NGS), the fluorescent dye–based microarrays
generate analogous signals from image intensity. Although the use of microarrays remains active
in a number of research areas, the promising NGS is becoming the method of choice due to the
intrinsic experimental limitations of microarrays.
1.4 Next-generation sequencing
For many years, the microarray-based analysis of transcriptomes plays critical roles in
3
have several intrinsic limitations, such as signal saturation, biasness of probe design and
non-specific hybridization. High-throughput sequencing technologies have overcome many
limitations of microarray technologies. NGS technologies sample the mRNA with fewer biases
and generate tens of millions of short fragments from a library of nucleotide sequences.
Currently, a range of genetic analyses, including whole genome resequencing, gene expression
analysis and small ribonucleic acid (RNA) analysis, were supported by NGS platforms. For
example, using the Illumina (http://www.illumina.com/) Genome Analyzer platform, recent
applications include sequencing mammalian transcriptomes [Mortazavi et al. 2008], ABI Solid
Sequencing to profile stem cell transcriptomes [Cloonan et al. 2008] or Life Science's 454
Sequencing to discover SNPs in maize [Barbazuk et al. 2007]. Even though technical differences
or applications exist in each platform, the information gathered from each share similar principle.
Compared with microarray technology, RNA-seq experiments also provide much higher
resolution measurements of expression at comparable costs [Marioni et al. 2008].
The following sections will introduce a series of relevant methods and analyses of
whole-transcriptome sequencing data (RNA-seq).
1.4.1 RNA-seq technology
RNA-seq, also called "Whole Transcriptome Shotgun Sequencing" [Ryan et al. 2008]
("WTSS") and dubbed "a revolutionary tool for transcriptomics" [Wang et al. 2009], refers to the
use of high-throughput sequencing technologies to sequence cDNA in order to get information
about a sample's RNA content. RNA-seq quickly becomes invaluable in the study of diseases
like cancer [Maher et al. 2009]. For many years, the standard method for determining the
sequence of transcribed genes has been to capture andsequence messenger RNA using expressed
4
sequences using conventional Sanger sequencing technology. However, RNA-seq has a number
of advantages over the conventional EST sequencing. RNA-seq samples the mRNA with fewer
biases and generates tens of millions of short reads per experiment, and these datacan be used in
measurement of the level of gene expression.
As an emerging RNA-seq technology, we are facing the challenge of complex alignment
problem. In an RNA-seq experiment, the computing power to track all the possible alignments is
nontrivial when aligning tens of millions of short reads to the reference genome. Besides,
millions of reads unable to accurately align to the references genome when the reads originating
from exon-exon junctions. Aligning reads originating from exon-exon junctions to references
genome is also a hard nut to crack for researchers. Thanks to the deep coverage and base level
resolution provided by next-generation sequencing instruments, RNA-seq provides researchers
with efficient ways to interrogate transcriptome [Maher CA et al. 2009].
1.4.2 Short reads alignment
In a typical RNA-seq experiment, tens of millions of short reads are generated from a
library of nucleotide sequences. We need to map these short reads of mRNA to identify regions
of similarity on a reference genome. Since these short reads are sequenced from exonic and
junction regions, we need to pay attention to short reads aligned to those regions. Due to the
short read length, aligning a large volume of short reads to a long reference genome poses a great
challenge to analysis of RNA-seq data. For measuring gene expression, we often have to align
short reads to original positions on a reference genome using alignment tools. There are several
tools Maq [Li H et al. 2008] , SOAP [Li R et al. 2008], RMAP [Smith et al. 2008], Bowtie [Ben
et al. 2009] and Novoalign (http://www.novocraft.com) available for aligning genomic reads to a
5
1.4.3 Junction mapping
Regarding alignment of short reads, a special attention is needed when processing the
alignment ofthe short reads on both sides of the exon-exon junctions. Although most of the short
reads can be mapped onto exon regions, a large set of short reads originating from exon-exon
junctions still cannot be aligned against to reference genome. Thus, working with the short reads
originating from exon-exon junctions in cDNA (around 10%) is a unique challenge for
researchers. These short reads fail to map to the reference genome since the exons are separated
by introns (Figure 1.1). Millions of unmapped short reads originating from exon-exon junctions,
denoted as Initially Unmapped Reads (IUM's), need to be accounted for when measuring gene
expression. To address the IUM problem, ERANGE [Mortazavi et al. 2008], Tophat [Trapnell et
al. 2009] and rSeq [Jiang et al. 2008] are among the recently developed approaches to map
IUM's originating from exon-exon junctions back to individual genes. ERANGE uses a union of
known and novel junctions while Tophat de novo assembles IUM's using a module in Maq [Li H
et al. 2008].
6
1.4.4 Data Format – SAM/BAM
Sequence Alignment/Map (SAM) format is defined as a generic nucleotide alignment
format which describes the alignment of query sequences or sequencing reads to a reference
sequence or assembly [Li et al. 2009]. Many of these tools output the alignment results in the
SAM and Binary SAM (BAM) formats [Li et al. 2009], which are widely considered the de facto
standards for storing and transferring short read alignment results. Although SAM format is easy
to understand and straight-forward, SAM is still a bit slow to parse. Therefore, Binary SAM
(BAM) format is introduced for intensive data storing and parsing. SAM/BAM file can store
both sing-end and paired-end reads. A mapped read pair is stored in two (or more if multiple hits
are stored) separate alignment records [Li et al. 2009].
SAM is a TAB-delimited text format. It generally consists of a header section and an
alignment section. The header section is optional and it must be placed before the alignments
section if present. Header lines start with ‘@’ and include format version, sorting order of
alignments, related reference sequence dictionary and read group. In the alignments section, each
alignment line has 11 mandatory fields for essential alignment information. For example,
mapping position, and variable number of optional fields for flexible or aligner specific
7
Figure 1.2. Example of single-end reads in SAM format.
In each alignment line, these mandatory fields are required to present in the same order,
but their values can be ‘0’ or ‘*’ (depending on the field) if the corresponding information is not
available. The following table gives an overview of the mandatory fields in the SAM format:
Col Filed Type Regxp/Range Brief description
1 QNAME String [!-?A-~] {1,255} Query template NAME
2 FLAG Int [0, -1] bitwise FLAG
3 RNAME String \*|[!-()+-<>-~][!-~]* Reference sequence NAME
4 POS Int [0, -1] 1-based leftmost mapping POSition
5 MAPQ Int [0, -1] MAPping Quality 6 CIGAR String \*|([0-9]+[MIDNSHPX=])+ CIGAR string
7 RNEXT String \*|=|[!-()+-<>-~][!-~]* Ref. name of the mate/next fragment
8 PNEXT Int [0, -1] Position of the mate/next fragment
9 TLEN Int [- +1, -1] observed Template LENgth
10 SEQ String \*|[A-Za-z=.]+ fragment SEQuence
11 QUAL String [!-~]+ ASCII of Phred-scaled base QUALity+33
Table 1. 1 Overview of 11 mandatory fields in alignment line. [http://samtools.sourceforge.net/SAM1.pdf.]
In each alignment line, all optional fields follow the TAG:TYPE:VALUE format where
TAG is a two-character string that matches /[A-Za-z][A-Za-z0-9]/. Each TAG can only appear
once in one alignment line. A TAG containing lowercase letters are reserved for end users. In an
8
Type Regexp matching VALUE Description
A [!-~] Printable character
i [-+]?[0-9]+ Singed 32-bit integer
f [-+]?[0-9]*\.?[0-9]+([eE][-+]?[0-9]+)? Single-precision floating number
Z [ !-~]+ Printable string, including space
H [0-9A-F]+ Byte array in the Hex format1
B [cCsSiIf](,[-+]?[0-9]*\.?[0-9]+([eE][-+]?[0-9]+)?)+ Integer or numeric array
Table 1. 2 Overview of optional fields in alignment line. [http://samtools.sourceforge.net/SAM1.pdf.]
1.4.5 Quantification of gene expression using RNA-seq
Quantifying gene expression in cells via measurement of mRNA levels arouses
researchers’ interest all the time. In RNA-seq experiment, for each gene, ERANGE reports the
number of mapped Reads Per Kilobase of exon per Million mapped reads (RPKM), a measure
of transcription activity [Trapnell et al. 2009]. For paired-end short reads, we measure the
transcript-level relative abundance in Fragments Per Kilobase of exon model per Million
mapped fragments (FPKM).
C is the total number of mapped short reads or fragments, L is the length of exons and N
is the total number of short reads in one lane of one experiment. When scaled to range [0, 1000],
this value stands for the normalized depth of coverage for each gene. Even though it has been
shown that there is no strong correlation between the abundance of mRNA and the related
proteins [Greenbaum et al. 2003], measurement of mRNA levels is still very useful in
determining how cells differ between a healthy state and a diseased state and other research
9
1.5 Motivation
Intrinsic technical limitations to microarray technology constrain its ability to fully
quantify gene expression. Fortunately, high-throughput multiplexed next-generation sequencing
provides a digital readout of absolute transcript levels and imparts a higher level of accuracy and
dynamic range than microarray platforms. In a typical experiment, tens of millions of short reads
are sampled from RNA with fewer biases for accurately measuring gene expression. However, a
significant challenge in analyzing gene expression is the short read alignment to a reference
genome. Although storing alignment information in the Sequence Alignment/Map (SAM) or
Binary SAM (BAM) format is a generic alignment format, biomedical researchers are still
facing a technical obstacle in accessing the useful information stored SAM/BAM files. In this
thesis, we present a GUI computational pipeline for researchers to efficiently process and extract
information from NGS data for quantifying human transcriptome. We show our GUI software
can accurately calculate the gene expression abundance scores for genomic intervals using short
reads originating from both exons and exon-exon junctions for RNA-seq data.
1.6 Overview
This thesis is organized into 5 chapters. In Chapter 1 we introduce background,
motivation and overview. In Chapter 2 we describe transcriptome and targetome analysis in
MIR155 expressing cells using RNA-seq. In Chapter 3 we present RNA-seq Analysis of EBV
Transcriptome. In Chapter 4 we discuss a GUI tool for processing short read alignments in
SAM/BAM format named SAMMate. In Chapter 5 we draw a conclusion of the thesis and
10
The thesis is largely based on the following list of relevant publications and software,
Transcriptome and targetome analysis using RNA-seq
Xu, G, Fewell, C, Taylor, C, Deng, N, Hedges, D, Wang, X, Zhang, K, Lacey, M, Zhang, H, Yin, Q, Cameron, J, Zheng, L, *Zhu, D and *Flemington, EK: Transcriptome and targetome analysis in mir155 expressing cells using rna-seq. RNA (New York, N.Y.), 16(8):1610–1622, August 2010.
#Lin, Z, #Xu, G, Deng, N, Taylor, C, *Zhu, D and *Flemington, EK: Analysis of EBV transcriptome using RNA-seq. J. Virology, doi:10.1128/JVI.01521-10.
SAMMate: a GUI tool for processing short read alignments in SAM/BAM format
Xu,G, Deng, N, Zhao, Z, Zhang, K, Judeh, T, Flemington, EK and *Zhu, D: SAMMate: A GUI tool for processing short read alignment information in SAM/BAM format. Source Code for Biology and Medicine, 6:2.
Software
11
Chapter 2. Transcriptome and Targetome Analysis in MIR155
Expressing Cells using RNA-seq
2.1 Introduction
MicroRNAs play critical roles in controlling biological processes through their ability to
post-transcriptionally regulate gene expression. A testament to their importance in normal
organismal biology is that dysregulation of microRNA function through genetic or epigenetic
alterations is at the root of an array of disparate diseases including cancer [Calinet al. 2004; Iorio
et al. 2005; Lu et al. 2005; Volinia et al. 2006; Zhang et al. 2006]. The gene encoding
microRNA-155(MIR155) was classified as an oncogene [Clurman and Hayward 1989; Tam et al.
1997; Costinean et al. 2006] many years before it was identified as a microRNA [Eiset al. 2005]
and is now among the most highly implicated microRNAs in cancer. Despite its link to
hematologic [Eiset al. 2005; Kluiver et al. 2005] and other cancers [Volinia et al. 2006], there is
currently little information regarding direct targets or pathways through which MIR155 signals
to promote the tumor phenotype.
The phenotypic consequences of microRNAs are facilitated through the combination of
not only direct, but also indirect, influences on gene expression. Nevertheless, the identification
of direct target mRNAs is a topic of intense interest because it provides insights into the entry
point through which microRNAs regulates a respective pathway. The recognition of targets
through a predominantly Watson–Crick base-pairing mechanism has capacitated informatics
based prediction approaches that have lent considerable support to global target identification
efforts [Li et al. 2010b]. Despite the applicability of this approach, there are less tangible
12
limits the veracity of informatics-based target prediction and necessitates the concomitant
application of experimental methods to search for and/or validate microRNA targets.
High-throughput sequencing of RNAs isolated by cross-linking immunoprecipitation (HITS-CLIP) is a
recently developed method that enables identification of direct target sequences through the
sequencing of RNAs from immunoprecipitated cross-linked Argonaute–miRNA–mRNA
complexes [Chi et al. 2009]. The use of SILAC (stable isotope labeling with amino acids in cell
culture) and state-of-the-art mass spectroscopy approaches has allowed the interrogation of up to
5000 members of a proteome for changes in protein output in response to micro-RNA expression
[Selbach et al. 2008]. Whereas HITS-CLIP can directly identify targeting sequences, proteomics
approaches identify an inferred targetome. On the other hand, SILAC-based proteomics
approaches also provide expression information for directly and indirectly affected genes that
can give additional insights (relative to HITS-CLIP) into the biological outcomes of a
microRNA’s function. In spite of this, proteomics methods likely miss up to half of all expressed
proteins and may be biased against the less abundant proteins that often play critical regulatory
roles in cell signaling.
Microarray-based analysis of transcriptomes has the potential to interrogate a much larger
portion of all genes expressed in a cell, and this approach has been used to globally characterize
microRNA-mediated transcriptome changes and inferred targetomes (for example, see Grimson
et al. 2007). Nevertheless, microarray technologies have several intrinsic characteristics that limit
their utility in fully exploiting RNA changes to assess microRNA-induced transcriptome changes
and microRNA targetomes. High-throughput sequencing of RNAs has overcome many of these
limitations, and we reasoned that next-generation sequencing (NGS) may provide an
13
2008; Mortazavi et al. 2008] should make it more suitable for assessing the relatively moderate
influences that microRNAs have on their target mRNAs. Its broader dynamic range allows the
analysis of both high- and low-abundance transcripts and should therefore facilitate the analysis
of genes spanning a wide spectrum of expression levels. Unlike the most commonly used
microarray platforms, which only interrogate the ends of terminal exons to derive expression
information, NGS gathers expression information throughout the entire locus of all expressed
genes. This feature of NGS is important in light of recent studies showing the occurrence of
widespread upstream transcription termination shifts during immune cell development and in
cancer cells, for example, Sandberg et al. (2008) and Mayr and Bartel (2009). For genes
simultaneously expressing shortened and long transcripts, expression changes obtained by
microarray studies reflect only changes in the subset of extended isoforms that may be more
responsive to microRNA targeting but do not accurately mirror overall changes in expression of
the locus. Finally, NGS allows the user to simultaneously assess isoform structure, which is
critically important for many regulatory processes including microRNA targeting. This
information can be used to elucidate targeting failures in a particular system. We also anticipate
that as the potential targetomes of microRNAs become well characterized and as NGS data
become broadly accumulated for different cell systems, actual targetomes can be predicted for
each cell system based on transcript structure. This should allow for informed prediction of
biological outputs of microRNAs in different cell systems based on publicly available
14
2.2 Results
2.2.1 Model system
Epstein-Barr virus (EBV) infected B-cells expressing the full repertoire of latency genes
(type III latency) manifest high levels of MIR155, whereas EBV-infected B-cells exhibiting a
limited viral gene expression program (type I latency) do not [Jiang et al. 2006; Kluiver et al.
2006]. To investigate the utility of next generation RNA sequencing (RNA-seq) in assessing a
microRNA targetome, we infected the type I latency B-cell line, Mutu I, in duplicate with an
MIR155 expressing retrovirus (or an empty vector control etrovirus) to achieve high MIR155
expression in a low expression background. Infections were judged to be highly efficient based
on the low level of cell death after selection and the high percentage of GFP-positive cells (>60%)
2 d after infection. We therefore considered the infected cell populations to be highly polyclonal.
Expression of MIR155 was found to be 100, 000-fold higher in MIR155 transduced Mutu I
cells than in control transduced Mutu I cells or in two other type I latency cell lines (Figure 2.1A,
Akata and Rael). Additionally, expression in MIR155 transduced Mutu I cells was comparable to
endogenous MIR155 expression in the type III latency cell lines, JY, X50-7, and IB4 (Figure
2.1A). The level of MIR155 in retrovirally transduced Mutu I cells was found to be sufficient to
exert suppression of the previously identified MIR155 target, BACH1 [Figure 2.1B; Gottwein et
al. 2007; Skalsky et al. 2007; Yin et al. 2008]. Furthermore, ectopic MIR155 exerted a
phenotypic influence on Mutu I cells since MIR155 transduced cells formed more colonies in
soft agar than their control transduced counterparts (Figure 2.1C), a result that is consistent with
the known oncogenic properties of MIR155. We therefore considered this system to be suitable
15
Figure 2.1 The biological system. (A) Mature MIR155 was analyzed by real-time RT-PCR in the EBV type I latency cell lines—Akata, Rael, and Mutu I—and the type III latency cell lines—JY, X50-7, and IB4. CNTL-1 and CNTL-2 and 155-1 and 155-2 refer to duplicate biological replicate infections with control and MIR155 expressing retroviruses. Expression values are reported relative to the average expression levels in Akata and Rael. (B) BACH1 and ACTB (b-actin) Western blots were performed using protein extracts isolated 14 d after retroviral infections. (C) Newly established control and MIR155 expressing Mutu I cells were plated in soft agar and cultured for 2 wk prior to photo-documentation. (D) The total number of genes and the number of genes containing any MIR155 seed type that are expressed above and below the indicated RPKM cutoffs in control Mutu I cells were counted and graphed.
2.2.2 Read mapping
Control and MIR155 transduced Mutu I RNAs were analyzed by NGS using an Illumina
Genome Analyzer II. Reads per kilobase of exon model per million mapped reads (RPKM)
[Mortazavi et al. 2008] was used to score gene expression abundance. A unique challenge for
working with RNA-seq data is short reads originating from exon–exon junctions in cDNAs
( 10%) that fail to map back to the reference genome because in this context, exons are
separated by introns. The millions of unmapped short reads originating from exon–exon
junctions, denoted as initially unmapped reads (IUMs), needed to be accounted for when
16
hereinafter) map only short reads originating from exons (ignoring IUMs), ERANGE [Mortazavi
et al. 2008], TopHat [Trapnell et al. 2009], and rSeq [Jiang and Wong 2008] (named ‘‘junction
mapper’’ hereinafter) are among recently developed approaches to assign IUMs originating from
exon–exon junctions back to individual genes.
The exon aligners and junction mappers differ vastly in algorithms and accuracy. For
RNA-seq data, it is necessary to choose and combine the most accurate exon aligner and junction
mapper to estimate the gene expression RPKM scores. In our analysis, alignments were first
carried out using the exon aligner Novoalign (http://www.novocraft.com), with reads aligning to
more than one locus excluded from further analysis. IUMs were secondly de novo aligned to the
assembled IUMs using the junction mapper TopHat [Trapnell et al. 2009]. IUMs mapping to
exon junctions using TopHat were then combined with exon mapped reads from the Novoalign
output, and RPKM calculations were carried out using University of California Santa Cruz
(UCSC)–annotated gene loci [Rhead et al.2010].
2.2.2 Expression analysis
Microarray technologies can readily be used to generate information regarding the
relative expression of genes between samples. Due in part to cross-hybridization and sensitivity
issues as well as the analog nature of microarray platforms, however, the determination of
absolute transcript levels is challenging. In contrast, NGS provides a digital readout of the
number of reads mapping to each gene, and Li et al. (2010a) have shown that when the mean
expressed transcript length is 1 kb, 1 RPKM corresponds to roughly one transcript per cell in
mouse. It is reasonable to assume that transcript levels falling below this threshold may be of
limited functional significance to the overall cell population. At the very fundamental level of
17
direct global role in altering cell signaling/phenotype in a particular system. Such genes can be
set aside and perhaps considered at a later point in the context of paracrine or subpopulation
effects. In control Mutu I cells, approximately half of all annotated genes were found to be
expressed below 1 RPKM (Figure 2.1D). Approximately 800 genes bearing MIR155 3’ UTR
seed sequences were found to be expressed below 1 RPKM. Even at a 0.1-RPKM cutoff, more
than 600 seed containing genes were found to fall below this threshold and are therefore likely to
have limited functional significance in these cells irrespective of whether they are true MIR155
targets. Notably, a higher percentage of MIR155 seed containing genes are expressed in Mutu I
B-cells compared to the percentage of all genes expressed, possibly reflecting the critical role of
MIR155 in immune cell development [O’Connell et al. 2007; Rodriguez et al. 2007].
Alternatively, this enrichment may simply reflect a general bias toward targeting a group of
genes that are universally expressed.
2.2.3 Relative expression and distribution of genes with 3’ UTR
MIR155 seed sequences
We next assessed whether genes containing MIR155 3’ UTR seed sequences are
preferentially distributed among down-regulated genes. Genes expressed below 0.5 RPKMs were
excluded from this analysis since these genes are likely of arguable functional significance and
technical reproducibility begins to wane in this RPKM range [Mortazavi et al.2008]. In line with
expectations, we observed preferential distribution of genes containing 7-mer and 8-mer MIR155
seed sequences in the down-regulated fractions (Figure 2.2A–C). Statistical analysis
demonstrated preferential distribution (P-value < ) in terms of mean and variance (for
18
enrichment of all classes of 7-mers and 8-mers in the down-regulated fractions relative to genes
with no 7-mer or 8-mer seeds (P-value < ) (Figure 2.2D). Notably, even among genes
without MIR155 seed sequences, there is a greater number of down-regulated compared to
induced genes, indicating a more global redistribution of gene expression. This is not
inconsistent with previous microarray studies showing that MIR155 down-regulates more genes
than it induces [Gottwein et al. 2007; Skalsky et al. 2007]. Because RPKM calculations
normalize to all mappable reads, these results presumably mean that MIR155 decreases the
expression of genes within the lower expression class through a mechanism other than 3’ UTR
7-mer or 7-mer basepairing. Irrespective of this issue, the enrichment for genes with 7-7-mer or
8-mer seeds in the down-regulated fractions relative to genes without 7-8-mer or 8-8-mer seeds is
consistent with expectations based on previous microarray studies. As further evidence that
RNA-seq analysis performed within expectations, we observed a down regulation bias for genes
19
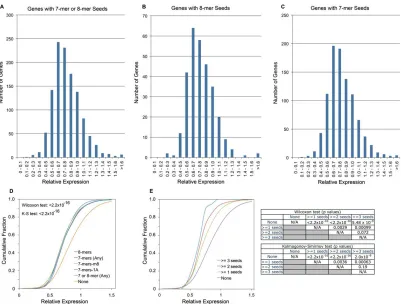
Figure 2.2. Genes containing MIR155 seed sequences are enriched in down-regulated fractions. Relative expression (expression in MIR155 transduced Mutu I cells divided by the expression in control transduced Mutu I cells) histograms for genes containing 7-mer or 8-mer (A), 8-mer (B), or 7-mer (C) seeds in their 3’ UTR. (D) Cumulative distribution of genes with different seed classes. P-values for all seed classes as determined by sided Wilcoxon test (Wil.) and one-sided Kologorov–Smirnov test (K-S) were < . (E) Cumulative distribution of genes with different numbers of seeds. P-values for all seed number comparisons were determined using a one-sided Wilcoxon test and a onesided Kologorov–Smirnov test and are shown in the matrix to the right.
2.2.4 NGS versus microarray studies
Having demonstrated a preferential distribution of genes with MIR155 seeds in
down-regulated fractions, we next sought to assess the performance of next generation sequencing
relative to microarray analysis. We performed differential expression analysis on our RNA-seq
data set and on data sets from two previously published microarray studies in which MIR155
20
2008] or human 293 cells [Skalsky et al. 2007]. Using only gene identifiers common to all four
platforms and using a false discovery rate (FDR) of zero, 2165 genes were determined to be
down-regulated by NGS, whereas 38 and 58 down-regulated genes were identified in our
analysis of the two published microarray data sets (Figure 2.3). NGS identified 102
down-regulated genes (FDR = 0) with 3’ UTR 8-mer seeds, while seven and two down-down-regulated genes
with 8-mer seeds were identified in the two microarray data sets.
To more stringently assess the relative robustness of NGS for transcriptome and
targetome studies, we generated additional control and MIR155 retrovirally transduced Mutu I
cell lines and subjected four control and four MIR155 expressing cell lines to Agilent microarray
analysis with dye swaps for each comparison. This resulted in better concordance relative to
previous microarray studies, but the number of downregulated genes and the number of
down-regulated genes with 8-mer seed sequences were threefold and 2.6-fold lower than that observed
21
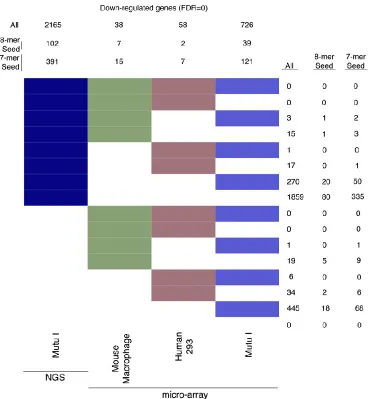
Figure 2.3. Cross-platform comparison of transcriptome quantification using bitmap. Downregulated genes were identified at a false discovery rate (FDR) = 0 for NGS and each microarray platform. Each gene was determined to be significantly down-regulated (at FDR = 0) or not in each of the four platforms; down-regulated genes were assigned to one of the = 16 possible clusters, represented by color/white patterns and corresponding to 16 rows in the bitmap. Numbers at the top refer to the total number of down-regulated genes for the indicated platform (summation of the number of genes represented by all colored patterns in column). Numbers to
the right refer to the number of genes common to platforms with colored patterns in each
respective row.
2.2.5 3’ UTR reporter analysis
Luciferase reporter plasmids bearing ectopic 3’ UTRs can be used to assess microRNA
22
NGS, a 3’ UTR reporter data set was generated using 170 3’ UTRs containing MIR155 7-mer or
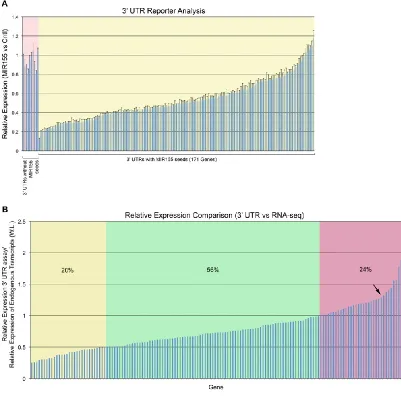
8-mer seeds and nine 3’ UTRs with no MIR155 seeds (Figure 2.4A). The relative expression of
reporters lacking MIR155 seeds in cells cotransfected with a MIR155 expression vector versus a
control expression vector fell in the range of 0.8 to 1.04. The relative expression of genes with
MIR155 seed sequences spanned a range from 0.13 to 1.2 (Figure 2.4A; Supplemental Data 1),
allowing us to analyze a spectrum of MIR155 target regulatory classes.
23
expression vector divided by the expression of the control reporter cotransfected with the MIR155 expression vector versus cells cotransfected with the control expression vector. Results are based on biological triplicate transfections with control and MIR155 expression vectors. Error bars are standard error of change. (B) Comparison of relative expression observed in 3’ UTR assays with relative expression of endogenous transcripts at the whole locus level. The y -axis values are the relative expression observed in 3’ UTR assays divided by the relative expression of the endogenous transcripts (at the whole locus [W.L.] level). Genes with yellow shading are genes considered to lack full response at the endogenous transcript level. Genes with green shading fall within the expected difference range. Genes with pink shading represent candidate genes whose transcripts are regulated through additional mechanisms in Mutu I cells. The arrow indicates an inflection point in the curve.
2.2.5 Validation of RNA-seq analysis using 3’UTR luciferase reporter
assay
A total of 150 of the 170 genes tested in the 3’ UTR reporter study were expressed at 0.5
or more RPKMs in Mutu I cells, allowing us to do comparisons with these 150 genes. Whereas
changes observed by RNA-seq only reflect influences at the transcript level, changes observed in
3’ UTR assays reflect the combined influence of transcript level changes plus the influence of a
microRNA on translation, the latter of which is expected to vary depending on the target. In line
with expectations, the majority (76%) of genes tested showed greater than or equal suppression
in 3’ UTR reporter assays relative to the RNA-seq analysis (Figure 2.4B; Supplemental Data 2).
Of the remaining 24% of genes that displayed greater suppression as observed by RNA-seq
versus 3’ UTR analysis (values >1 in the y-axis of Figure 2.4B), at least some of these genes are
likely to be modulated endogenously through additional mechanisms such as transcriptional
regulation (especially those to the right of the apparent inflection point; see arrow in Figure
2.4B).
Although the relative contribution of translational inhibition varies from target to target,
24
[Selbach et al. 2008]. In our case, there are 29 genes (19%) with more than twofold greater
inhibition in 3’ UTR assays compared to the inhibition observed at the endogenous transcript
level (Figure 2.4B; Supplemental Data 2). We operationally treated these genes as outliers that
show a disproportionately lesser degree of regulation at the level of RNA-seq.
To investigate these poor performers, we first directed our attention to some of the most
extreme examples, those with little or no regulation observed by RNA-seq but good regulation in
our 3’ UTR analysis. Three examples—PCDH9, MAP3K10, and TAF5L (Supplemental Data
3)—proved to be illustrative of scenarios accounting for some of these targeting
failures/inefficiencies. First, suppression of the PCDH9 3’ UTR in the reporter assay was found
to be substantial (relative expression of 0.26), whereas there was no change in RNA-seq (relative
expression of 1.0). Visualization of the read pile-ups on the USCS Genome Browser [Rhead et al.
2010) showed no evidence of reads mapping to exons 3, 4, or 5, the latter of which contains the
MIR155 seed sequence (Supplemental Figure 2.1). In contrast, ample read evidence supports
transcription through exons 1 and 2, and splicing evidence supports an exon 1 and exon 2
junction. In this example, PCDH9 is likely to be a true target of MIR155 as evidenced by the 3’
UTR reporter analysis. The lack of any change in PCDH9 transcript levels in Mutu I cells is
likely an accurate reflection of the dominant utilization of an isoform that is recalcitrant to
MIR155 targeting.
Several recent studies have demonstrated 3’ UTR shortening in activated lymphocytes
and in tumors [Sandberg et al. 2008; Mayr and Bartel 2009]. The lack of a change in MAP3K10
transcript levels as determined by RNA-seq analysis in the face of a relative expression of 0.47
observed by 3’ UTR analysis likely reflects such a scenario. In this case, read evidence falls off
25
UTR isoform entry identified from the GenBank database (Z48615) (Supplemental Figure 2.2).
MAP3K10 is a representative example of a lack of responsiveness resulting from the dominant
usage of an upstream poly-adenylation site.
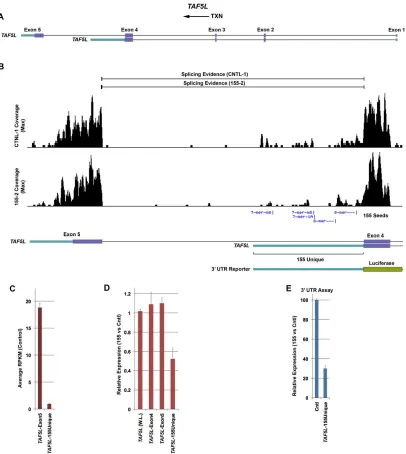
Expression of MIR155 in Mutu I cells resulted in no observable change in overall TAF5L
RNA levels despite the presence of a 3’ UTR with five MIR155 sites and a relative expression of
0.3 observed in our 3’ UTR analysis. TAF5L has two annotated isoforms with two distinct 3’
UTRs (Figure 2.5A, B). In contrast to the 3’ UTR tested in our 3’ UTR analysis, the other 3’
UTRs contains no MIR155 seed sequences. Although both isoforms are expressed in Mutu I
cells, RPKM analysis of exon 5 (no MIR155 seeds) and the unique region of exon 4 (5 MIR155
seeds) shows that the relative abundance of the isoforms containing seeds is 20- fold lower
than the isoforms lacking seeds (Figure 2.5C). This dominant expression of the
non-seed-containing isoform can explain the lack of observable changes in overall TAF5L transcripts in
MIR155 expressing Mutu I cells. To determine whether the seed-containing isoform is regulated
by MIR155 in Mutu I cells, we calculated the differential expression of 3’ UTR sequences that
are unique to this transcript. Whereas the relative expression of exon 4 (common to both
isoforms) and exon 5 are , the relative expression of the unique region is 0.52 (Figure 2.5D),
which is in line with the relative expression observed for this 3’ UTR in the reporter assay
(Figure 2.5E). Therefore, while the dominance of the nonseed containing TAF5L isoform results
in no change at the whole locus level, the seed containing isoform is specifically regulated by
MIR155 in concordance with the 3’ UTR results.
2.2.6 Global analysis of terminal exon relative expression
We used these examples of targeting failures as a basis to design a general approach to
26
Mutu I cells. We reasoned that the relative expression of terminal exons would better reflect the
degree of suppression observed in 3’ UTR assays in cases in which multiple transcript isoforms
account for mitigated suppression in our cells (as observed by RNA-seq analysis of the whole
transcript locus). First, for genes using more than one terminal exon, the terminal exons bearing
MIR155 seed sequences should, on average, show a higher degree of suppression than the whole
locus. Second, for genes bearing only one terminal exon but using more than one poly(A) signal,
there should be a higher relative read representation of longer MIR155 seed containing
transcripts within terminal exon coordinates compared to the whole gene locus.
For this analysis, RPKM and corresponding relative expression calculations were carried
out for all terminal exon loci.We first applied this terminal exon differential expression data to
the group of genes (excluding PCDH9, MAP3K10, and TAF5L) showing a disproportionately
greater suppression in the 3’ UTR assays relative to RNA-seq (3’ UTR relative
expression/RNA-seq [transcript] relative expression <0.5). Genes with terminal exon RPKM levels of <0.5 were
excluded from this analysis. Of the 23 testable genes, better concordance with 3’ UTR data was
achieved with the terminal exon analysis in a little more than half of the genes (Figure 2.6A).
This indicates that, in these cases, the inability of MIR155 to suppress expression of these genes
to its full potential is likely due to the expression of alternate nonsuppressible isoforms.
At the global level, cumulative distribution analysis of terminal exons with or without
MIR155 seed sequences shows a relative enrichment of seed containing genes in the
down-regulated fractions (P-value < ) (Figure 2.6B), in line with the whole locus analysis
shown in Figure 2.2. However, greater inhibition is observed at the terminal exon level than the
whole locus level (Figure 2.6C), indicating that isoform usage likely dictates the degree of
27
that for some targets, a lack of miRNA repression responses at the endogenous transcript level
can be attributed to altered transcript structure.
2.3 Discussion
There are now a number of tangible methods to globally assess the influence of
microRNAs on cell signaling, which range from an assessment of RNA binding sites (e.g.,
HITSCLIP), to an assessment of changes in RNA (e.g., microarray and NGS) and protein output
(e.g., SILAC). Each of these methods has its own niche in determining the overall cascade of
events leading to a microRNA’s influence on cell signaling pathways. A unique advantage of
NGS is its capacity to simultaneously provide accurate transcript level information while, at the
same time, providing unprecedented clarity regarding transcript structure at a relatively low cost.
Our data support the contention that mRNA isoform utilization is a critical determinant in
specifying microRNA targeting. It also advocates transcriptome and miRNA targetome
characterization at the isoform level as opposed to the typically used gene level analysis. In our
experiments, transcript structure information obtained by NGS provided clarity with respect to at
least half of all targeting failures and/or inefficiencies (Figs. 2.5, 2.6; Supplemental Figs. 2.1,
2.2). In addition, NGS provides the user with information on ‘‘failures to detect’’ changes that
are attributed to low (or no) target gene expression (in our case, 39% of all genes with seed
sequences were expressed below 0.5 RPKMs). NGS makes these transcriptome level targeting
28
29
The accumulation of publically available RNA-seq data for different cell lines and
different model systems willlikely accelerate rapidly in the near future. We also envision that
microRNA targetomes will soon become much better elucidated. Using informatics alone, RNA
structure information derived from publically available NGS sequencing databases could be
merged with a well-characterized targetome data set to allow investigators to make predictions
regarding the cell type–restricted targetome. This will facilitate a much better informed
prediction of the functional impact of a microRNA in the context of a particular cell system.
30
test (K-S) were found to be < . (C) Terminal exon analysis shows significantly more down-regulation than whole locus analysis implicating transcript structure in mitigating MIR155 responses at the whole locus level. P-values were determined by a sided Wil. test and a one-sided K-S test.
Probes used for most nontiling microarrays are typically at or near the 39 end of terminal
exons. Such probes exclusively interrogate longer isoforms that are expected on average, to be
more susceptible to microRNA targeting. This may account for some of the down-regulated
genes uniquely identified in the Agilent microarray platform relative to NGS (Figure 2.3).
Despite the intrinsic bias that these microarrays have toward more regulatable isoforms, NGS
identified 2.6 times more down-regulated genes with 8-mer seeds than our Agilent microarray
data from the same cell system (FDR = 0) (Figure 2.3). NGS is therefore a more robust platform
to identify an inferred targetome while providing a better reflection of overall gene expression
since read frequency throughout the entire locus (or through the open reading frame [ORF]) can
be considered. At the same time, NGS provides the flexibility to assess isoform-specific
regulation by considering read frequency through isoformspecific exons or through
isoform-specific 3’ UTR sequences only.
Identification of microRNA targets is critical for understanding the initial contact point
between a microRNA and an affected pathway and biological function. Nevertheless, the overall
biological impact of a microRNA is manifested by the combination of these direct interactions
and downstream regulatory processes that are influenced by direct interactions. An illustration of
this point was educed by Gene Ontology analysis (Ingenuity Pathway Analysis software;
Ingenuity) of MIR155-regulated genes. The most highly implicated biological process predicted
from a gene set containing either regulated genes with MIR155 seeds or any regulated gene was
the cell cycle (which may contribute to the oncogenic function of MIR155) (Supplemental
31
process from the latter case (total of 92 genes) than the number of regulated genes with seeds
(total of 10 genes). Many of these additional genes are likely regulated through downstream
regulatory processes, yet they presumably have a contributing impact on this biological process.
To our knowledge, there is no reason to expect that indirect effects of microRNA
targeting would be restricted to nontargets. The addition of an indirect component to direct
targets could serve to either reinforce down-regulation, thereby exerting a stronger impact on a
pathway, or provide a negative feedback loop to transiently influence a pathway. Both scenarios
may explain discordant 3’ UTR reporter/NGS data that cannot be explained by altered transcript
structure. KLRA1 and HAL (this study), and SMAD1 and MYO10 (see below) [Yin et al. 2010;
this study], are examples of genes showing relative expression of 0.6 or less in 3’ UTR assays
but whose relative expression at the endogenous RNA level was found to be 50% of their 3’
UTR relative expression levels. These genes appear to be true targets of MIR155, but the greater
observed regulation at the transcript level suggests a reinforcing component to the regulation of
these genes.
Based in part on the RNA-seq data described here, we have recently validated that
MIR155 inhibits bone morphogenetic protein signaling by targeting several mediators including
SMAD1 (relative expression [RNA-seq] of 0.27, FDR = 0) and SMAD5 (relative expression
[RNA-seq] of 0.48, FDR = 0), which are known to activate transcription of MYO10 (relative
expression [RNA-seq] of 0.3, FDR = 0) [Yin et al. 2010]. Quantitative PCR analysis of all three
of these genes and Western blot analysis of SMAD1 and SMAD5 showed inhibition by MIR155
in Mutu I cells [Yin et al. 2010]. The targeting of the MYO10 regulators, SMAD1 and SMAD5,
in addition to the targeting of the MYO10 3’ UTR, illustrates a reinforcing mechanism that leads
32
information on KLRA1 or HAL, they too are candidate genes that may be suppressed through
direct and indirect mechanisms to enforce inhibition of cellular processes influenced by these
genes.
2.4 Materials and methods
2.4.1 Biological experiments
The sections related to cell culture, plasmid construction, generation of stable MIR 155
expressing cell lines, RNA isolation and real-time RT-PCR analysis of MIR 155 levels can be
found in the original paper [Xu et.al 2010]. And the details of western blot analysis and soft agar
assay are discussed in section 2.4.15 and 2.4.16 in original paper [Xu et.al 2010].
2.4.2 Sequencing and base calling
Preparation of transcription libraries for sequencing on the Illumina GA2x platform was
carried out using the RNA-seq kit (Part no. 1004898 Rev. A) according to the manufacturer’s
standard protocol. Briefly, purified RNA was fragmented via incubation for 5 min at 94°C with
the Illumina-supplied fragmentation buffer. The first strand of cDNA was next synthesized by
reverse transcription using random oligo primers. Second-strand synthesis was conducted by
incubation with RNase H and DNA polymerase I. The resulting double-stranded DNA fragments
were subsequently endrepaired, and A-nucleotide overhangs were added by incubation with Taq
Klenow lacking exonuclease activity. After the attachment of anchor sequences, fragments were
PCR-amplified using Illumina-supplied primers and loaded onto the GA2x flow cell. Image
analysis and base calling were conducted with Firecrest and Bustard programs, respectively, and
33
2.4.3 Read mapping to genome and across splice sites
Each short read file (sample), in the FASTQ format, was individually aligned against the
Human Reference Genome (hg19) following a two-step procedure. The whole set of short reads
was initially aligned to annotated exons using an exon aligner, Novoalign
(http://www.novocraft.com). We used the following parameter settings to build novoindex and
run Novoalign:
1. Novoindex -k 14 -s 1 an index file name (e.g., hg37) reference genome files name (e.g.,
chr1.fa chr2.fa chr3.fa chr4.fa chr5.fa chr6.fa chr7.fa chr8.fa chr9.fa chr10.fa chr11.fa chr12.fa
chr13.fa chr14.fa chr15.fa chr16.fa chr17.fa chr18.fa chr19.fa chr20.fa chr21.fa chr22.fa chrX.fa
chrY.fa chrM.fa), where: -k 14 is the k-mer length to be used for the index; and -s 1 is the step
size for the index.
2. For searching the full human genome on a 16-GB RAM server, the recommended
settings are k=14, s=1 or k =15, s =2.
3. Novoalign -o SAM -f short read data file name (e.g., s_1_sequence.txt) -d file location
(e.g., /Volumes/Macintosh HD 2/workspace/hg37) > s_1_novo_output, where -o SAM: the
output file is in the SAM format; -f: the following file name is the input FASTQ file; and -d:
directory where the output file should locate (note: users need to change it to the actual directory).
4. Other options were set to the default.
The Initially UnMapped reads are likely originated from exon–exon junctions that do not
exist in the reference genome. IUMs were aligned to de novo assembled exon–exon junctions
using the junction mapper, TopHat [Trapnell et al. 2009]. We used the following parameter
34
1. TopHat -p 6 -G reference genome file name (e.g., output.gff.txt) bowtieindex file name
(e.g., bowtieindex/hg37_bowtie) short read data file name (e.g., s_1_sequence.txt): -p: Uses 6
threads to align reads; and -G: Supply TopHat with a list of gene model annotations in gff format
(output.gff.txt).
2. Other options were set to the default.
2.4.4 Gene expression analysis using RNA-seq data
We performed a genome-wide gene expression analysis using gene annotation
downloaded from the UCSC Genome Browser. The expression abundance for gene i was
quantified using the RPKM measure: , where i is the gene index, is the
sum of short read counts mapped to exons and exon–exon junctions, represents all mapped
read counts in the lane, and is the sum of exon lengths [Mortazavi et al. 2008].
RPKM calculation was performed using an in-house-developed graphical user interface
(GUI) software, SAMMate, which is freely available from http://sammate.sourceforge.net/.
SAMMate takes the inputs of exon alignment files in .SAM format [Li et al. 2009], exon–exon
junction alignment file in .BED format (optional), and genome annotation in a variety of formats
to export a matrix of RPKM values for annotated genes. In addition, it also calculates RPKM
values for each customized genomic interval.
2.4.5 Analysis of Agilent MIR155 arrays
Agilent microarray data for MIR155 transduced and control Mutu I samples were
imported into the R software environment, version 2.7 (The R Development Core Team 2008),
using the Bioconductor package ‘‘limma’’ [Gentleman et al. 2004; Smyth 2005]. Quality control
35
normalization was performed using eCADS [Dabney and Storey 2007] to correct for
gene-specific dye bias. Normalized log-ratios were then analyzed using the one-class framework in
SAM [Tusher et al. 2001] to identify probes differentially expressed with an estimated FDR of 0.
2.4.6 Statistical treatment of sequencing and microarray data
We performed differential expression analysis for the NGS data set (this study) and two
previously published microarray data sets—mouse macrophage [O’Connell et al. 2008] and
Human 293 cell line [Skalsky et al. 2007]. Differentially expressed genes were identified by
significance analysis of microarrays (SAM) [Tusher et al. 2001]. SAM is a statistical technique
in which significantly differentially expressed genes between control and miRNA-155
transfected cell lines can be identified by assimilating a set of gene specific t-tests. Briefly, SAM
computes a nonparametric score for each gene by dividing the between-group difference of
(normalized log) gene expression levels and adjusted within-group gene expression variance
across the whole genome. The score is then compared with random permutation scores that are
computed in the same manner as the original score but based on randomly sampled gene
expressions. The per-gene P-value was calculated by the percentage of scores that are larger than
the original score in a fixed number of simulations, say, 1000. The per-gene P-values were
further adjusted to the false discovery rate (FDR) [Storey and Tibshirani 2003], indicating the
percentage of genes identified as being significant by chance alone. Here, we have used SAM’s
36
2.4.7 Cross-species gene mapping
Cross-species gene mapping between human and mouse gene orthologs was done using
the mapping file downloaded from
http://www.informatics.jax.org/mgihome/projects/aboutmgi.shtml.
2.4.8 Cross-platform comparison of targetome prediction using bitmap
To systematically compare the technical capabilities of NGS and microarray platforms in
detecting down-regulated genes, we used only gene identifiers that are common to all four
platforms. Among these gene identifiers, we identified a down-regulated gene list with FDR = 0
for each platform. Each of the genes was determined to be significantly down-regulated (at FDR
= 0) or not in each of the four data sets; all genes were assigned to one of the = 16 possible
clusters, which is represented by color/white patterns and corresponding to 16 rows in the bitmap.
The bitmap can be viewed as a generalized Venn Diagram to compare more than three groups.
For example, the eighth row corresponds to 1859 (total) and 102 (8-mer seed containing)
significantly downregulated genes identified at an FDR = 0 in NGS data.
2.4.9 Statistical comparison of a pair of populations
We used a rank-based two-sample one-sided Wilcoxon test to test the equality of two
population means ( ) versus one is greater than another ( ). The R function wilcox.test() was
used to perform this test.
We used Levene’s test to test the equality of two population variances ( ) versus not
equal ( ). The R function levene.test() was used to perform this test. We also used a
37
( ). The R function ks.test() was used to perform this test. In all the above tests, small P-values
(e.g., < 0.05) will reject the .
2.4.10 3’ UTR-luciferase reporter analysis
For reporter analysis, 3.75 g of either the control (pMSCV-puro-GFP-miR-CNTL) or
MIR155 (pMSCV-puro-GFP-MIR155) expression vector was cotransfected with 0.25 g of the
appropriate pMIR-REPORT-dCMV or pGL4.11 3’ UTR reporter plasmid into Mutu I
cells using Lipofectamine 2000 (Invitrogen). Cells were harvested 48 h post-transfection and
analyzed using the Promega firefly luciferase assay. The values reported are the expression
change of a given 3’ UTR relative to change in the control reporter.
2.4.11 Accession numbers
Sequencing data will be available in the NCBI Short Read Archive, SRA011001.
38
2.5 Supplemental Figures
39
Supplemental Figure 2.2. Read evidence for the last exon of MAP3K10 shows a sharp drop in mapped reads upstream from the MIR155 seed site. The read dropoff corresponds to approximately the end of a transcript supported by Genbank evidence (Z48615).

![Table 1. 1 Overview of 11 mandatory fields in alignment line. [http://samtools.sourceforge.net/SAM1.pdf.]](https://thumb-us.123doks.com/thumbv2/123dok_us/8945350.1854718/16.612.75.570.72.249/table-overview-mandatory-fields-alignment-line-samtools-sourceforge.webp)
![Table 1. 2 Overview of optional fields in alignment line. [http://samtools.sourceforge.net/SAM1.pdf.]](https://thumb-us.123doks.com/thumbv2/123dok_us/8945350.1854718/17.612.72.498.72.183/table-overview-optional-fields-alignment-line-samtools-sourceforge.webp)