© 2017, IRJET | Impact Factor value: 5.181 | ISO 9001:2008 Certified Journal
| Page 699
Multiple Sink Positioning and Relocation for Improving Lifetime in
Wireless Sensor Network
Aragaw Mehabie Gebremeskel
1, Prof. Kuda Nageswara Rao
21
Department Of Computer Science & Systems Engineering, Andhra University, Visakhapatnam, India
2
Department Of Computer Science & Systems Engineering, Professor& A.U. Webmaster, Andhra University, College
Of Engineering, Visakhapatnam, India
---***---Abstract- A wireless sensor network consists of a large number of small sensors with limited energy. Increase network lifetime, node mobility and load balancing are important requirements for many WSN applications. Clustering the sensor nodes is an effective technique to achieve these goals. In Wireless Sensor Networks, energy efficiency is an important issue, since the sensor nodes act as both data originator and data router. The sink functionality typically includes gathering sensing data from sensors in the network most single hop relays performing data processing. The nodes are equal distance to the sink, so there are no nodes which have to take the heavy traffic load and deplete their energy quickly leading the energy hole around the sink. The sink nodes which are placing the center of sensor nodes. The sensor nodes communicate with other nodes within short distance via wireless medium. The sensor nodes are placed in the static places, but the sink nodes are movable. The sink nodes move to mean value. In multiple sink positioning sinks move to their mean value. The sensor nodes are used to sense data the desired physical parameters and they send the sensed data to the sink nodes. In wireless sensor network sink relocation and sink positioning are one of the most effective solutions to improving network lifetime. A system Propose k-means clustering algorithm to minimize the energy consumption of each sensor node and sink nodes in order to maximize their network lifetime in wireless sensor networks. K-means clustering algorithm is the process of partition sensor nodes into different groups (clusters) and select a sink node from each cluster. K-means clustering algorithm used to randomly select sink nodes and calculate the distance between each sensor node to all sink nodes, then assign each sensor node to the sink node whose distance from the sink nodes is the minimum of all the sink nodes, then move the sink node to the center of all sensor nodes. In an energy efficient novel clustering scheme is designed in order to provide low energy consumption, reducing the overload on sensor nodes and increase network lifetime of wireless sensor network. The cluster based selecting sink node technique is one of the major approaches in reducing energy consumption in wireless sensor networks. The main idea of this thesis is to reduce data transmission distance of sensor nodes in wireless sensor networks by using clustering concepts. However, clustering concepts face several challenges the selection of sink nodes, moving the role of sink nodes in
clusters and optimal data routing in the network. So, the system proposes a protocol which provides energy efficient clustering and optimal data routing to increase the network lifetime.
Keywords: wireless sensor networks, k- means algorithm, sensor nodes, sink nodes
1. Introduction
1.1 Wireless Sensor Network
Wireless sensor networks, wide range of applications such as natural environmental monitoring, environmental control residential spaces or plants, object tracking, and precision agriculture. Wireless sensor network consists several micro sensor nodes, which are placed in a large scale observation area and sensing data of each node is gathered to a sink node by inter-node wireless multi-hop communication[1]. Each sensor node consists of the sensing function to measure the status of an observation point or object. Each node in wireless sensor network having the capabilities for processing, contain multiple types of memory, have a power source, have an RFC transceiver, and accommodate various sensors and actuators[2].
While many sensors connect to controllers and processing stations directly, an increasing number of sensors communicate the collected data wirelessly to a centralized processing station[3]. This is important for many network applications requiring hundreds or thousands of sensor nodes, often deployed in remote and inaccessible areas. With these enhancements, a sensor node is often not only responsible for data collection, but also for in-network analysis, correlation, and fusion of its own sensor data and data from other sensor nodes[4].
© 2017, IRJET | Impact Factor value: 5.181 | ISO 9001:2008 Certified Journal
| Page 700
processing? A user can retrieve information of his/her interest from the Wireless sensor network by putting queries and gather results from the base stations or Sink node the base station in wireless sensor network behave as an interface between users and the network[3].
Wireless sensor network can also be considered as a distributed database as the sensor The network can be connected to the internet. Through which global information sharing become Feasible. Wireless sensor network consists of a number of individual nodes that are able to Interact with the environment by sensing physical parameters or controlling the physical parameters These nodes have to collaborate in order to fulfill their tasks as usual. A single node is incapable By doing so and they use wireless communication to enable this collaboration[1]
1.1.1.Wireless sensor network model
The major component of a typical sensor network is;-
Sensor field: - A sensor field is the area in which the all sensors are placed
Sensor nodes: - sensor node has the capabilities of event sensing, Data processing and communication capabilities
Sink: - A sink is a sensor node with the specific task of data receiving, data processing and data storing from the other sensor nodes. They serve to reduce the
The total number of messages that need to be sent, hence reducing the overall energy requirements of the networks. Sink also known as data aggregation points.
Task manager: the task manager also known as a base station is a centraised point of control within the network that extracts information from the network.
1.1.2.Network components of a wireless sensor Node:
The main component of a general WSN is the sensor nodes the sink (base station),
Sensing Unit: sensor plays a very important role in wireless sensor networks by creating
A connection between physical world and computation world. The Sensor is a hardware device used to measure the change in the physical condition of an area of interest and produce a response to that change. It converts the analog data to digital data and send to the micro-controller for further processing.
Memory unit: Memory unit of the sensor node is used to store both the data and program code
Power unit: A sensor node consist a power unit that responsible for computation and transmission
and deliver power all its units. The basic power consumption at the node is due to computation and transmission where transmission is the most expensive a activity in the sensor node in terms of power consumption.
Processing Unit: processing unit is responsible for data acquisition, processing income and outgoing information, implementing and adjusting routing information considering the performance conditions of the transmission. Converters (analog to digital) timer and the universal asynchronous receive and transmit interface to the processing tasks.
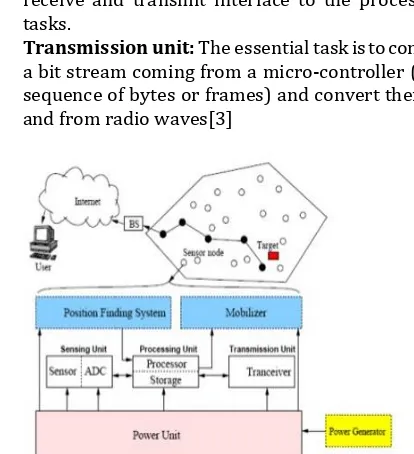
[image:2.595.333.540.235.462.2] Transmission unit: The essential task is to convert a bit stream coming from a micro-controller (or a sequence of bytes or frames) and convert them to and from radio waves[3]
Fig 1.1 Components of wireless sensor network
1.2 Clustering sensor nodes in wireless sensor network
In clustering, the sensor nodes are partitioned into different clusters. Each cluster is managed by a node referred as sink node (base station) and other nodes are referred as sensor nodes. Sensor nodes communicate directly with the sink node. They have to pass the collected data to the sink node. Sink node will aggregate the data, received from sensor nodes[5]. This minimizes the energy consumption and the number of messages communicated to sink nodes. Also number of active nodes in communication are reduced. The ultimate result of clustering the sensor nodes is prolonged network lifetime. Sensor Node: It is the core component of wireless sensor network. It has the capability of sensing, processing, routing, etc[6].
© 2017, IRJET | Impact Factor value: 5.181 | ISO 9001:2008 Certified Journal
| Page 701
Cluster: It is the organizational unit of the network, created to simplify the communication in the sensor network.
Advantages of Clustering
Transmit aggregated data to the data sink
Reducing the number of nodes taking part in the transmission
Useful Energy consumption
Scalability for large number of nodes
Reduces communication overhead
Efficient use of resources in WSNs
Balance the network traffic
1.2. Sink repositioning
In WSN, sinks are bounded with abundant resources and sensors that generate data are termed as sources. The sources can transmit data to one or multiple sinks for the purpose of analysis and processing[7]. Sink relocation is preferred by all applications that involve real time traffic for even in the middle of multiple nodes, it can balance the traffic load and thereby lessen the miss rate of real time packets.
To carry out sink repositioning, multiple sink deployment and sink mobility can be considered. Precise information about the area being monitored is needed to offer an ideal solution by the sink deployment method. First introduced to the concept of using mobile sinks to balance the energy consumption. There are 3 major parts involved in implementing Sink Mobility in Wireless Sensor Networks to improve the performance of the network: Sink node movement, data packets routing and data gathering[8].
1.2.1.Types of Sink Repositioning
Sink repositioning can be performed in the following ways.
Multiple Sink Deployment: Since the data will always be sent to the closest sink, deploying multiple sinks may decrease the average number of hops messages has to pass through.
Sink Mobility: WSNs may take the advantage of the mobile capacity, if a sink moves fast enough to deliver data with a tolerable delay. Hence, with the mechanical movements, the mobile sink picks up data from nodes and transports the data. Therefore, for the reduction of energy consumption of nodes, this approach trades data delivery latency[9].
Deploying Multiple Mobile Sinks: In this case, without delay and without causing buffer overflow, the multiple sinks are deployed so that the sensor data can be acquired[4].
2. LITERATURE REVIEW
2.1. Multiple Sink Positioning and Relocation for Improving Network Lifetime In Wireless Sensor Network
L. Friedmann and L. Boukhatem,[4] “Efficient multi-sink relocation in wireless sensor network,” they proposed a new approach for multi-sinks repositioning in a sensor network. their approach has the advantage of considering a global level network view when relocating the sinks to their optimal positions. The definition of these optimal positions is achieved by the mean of a local search algorithm which derives an optimal sinks distribution. The optimal positions are largely affected by the areas of heavy traffic and thus are likely subject to continuous variations. Moving the sinks towards the areas of interest (in terms of information production), allows to obtain a power saving provided that a stability of these areas exists.In such a configuration,simulation results show a significative enhancement in the network lifetime.Conversely,inaconfiguration where data production is chaotic or changing fast relatively to sinks velocity, the performance can be very weak. Our future plan is to extend the approach to an event mobility-aware method. We mainly focus on tracking strategies which we expect to be very helpful in some sensor applications where the observed phenomenon motion can be predicted and tracked.
P. Vadivazhagu and P. D. Selvam[5], they proposed“Network lifetime enhancement method for sink relocation and packet drop detection in wireless sensor networks,” In wireless sensor networks energy consumption of sensor is the ultimate challenge. This problem is mainly dominated by transmission and reception of data. This paper has an energy efficient routing protocol. The energy aware sink relocation scheme has designed to identify the energy drained out sink and also relocate that particular drained out the sink. By using this design we can prolong the network lifetime from the network die due to energy loss. There are so many techniques have been proposed to identify the malicious node which is formed due to the packet drops while transmission. In this paper the behavioral analysis technique is proposed to identify the malicious node. This is the highly effective packet drop detection technique. In the future work the probability of malicious node detection will be improved. Due this, the output parameters such as throughput, packet delivery ratio and delay period will be improved[7].
© 2017, IRJET | Impact Factor value: 5.181 | ISO 9001:2008 Certified Journal
| Page 702
failure of sensing and reporting events in the environment. Hence energy conservation has received increased attention in WSN research works. The concept of mobile sink has been recently introduced for WSNs in order to improve the overall performance of WSNs as it shifts the burden of energy consumption from the sensor nodes to sink nodes, which are typically considered to have unconstrained energy supply and larger computational power. In this thesis we present two sink mobility schemes: Load Base sink Movement (LBM) and Residual Energy Aware Routing (REAR) to prolong network lifetime in a random event-driven scenario. LBM computes the optimal tentative sink node position considering both the geographical distance from the sensors to sink and transmission load of sensors as well. REAR is a routing strategy that considers the residual energy of sensors when establishing routing paths. Experimental results confirm that the proposed schemes can significantly extend the network lifetime, compared to existing techniques.
M. Koç and I. Korpeoglu,[18] “Coordinated movement of multiple mobile sinks in a wireless sensor network for improved lifetime,”, they propose two multiple-sink mobility algorithms, MSMA and PMA, to coordinate movements of multiple sinks in a wireless sensor network. The MSMA uses the energy expenditure information of all nodes for different sink-site combinations. Unlike other similar approaches, the MSMA does not use all possible combinations, but instead limits the number of combinations according to a threshold value to reduce complexity. The PMA algorithm is a distributed algorithm that uses no global network information to determine the sinks’ next migration points. Each sink forbids some sites from using its children’s residual energy information. One group of sinks selects sites from the remaining set using the maximum of the minimum energy of the first-hop nodes. The other group selects points farther from the previously selected ones. We compare the performance of the proposed schemes with the MinDiffRE, RAND, and static-sink approaches in terms of network lifetime, latency, and total distance covered by the sinks. Under varying metrics, the experiment results show that the MSMA performs better in terms of network than any other scheme. The MSMA gives better network lifetime than the MinDiff-RE even though it uses up to four times fewer sink-site combinations. Latency (average hop count to any sink) is lowest for the static sink case and almost the same for the other schemes. The PMA algorithm achieves less lifetime (around 20 % on the average) compared to centralized algorithms (but better than random movement under all conditions); however, its performance increases (becomes better than the MinDiff-RE and MS-ELMA) when there are more than a few hundred nodes. Sinks also travel less compared to other schemes when using the PMA algorithm.
A. Gachhadar and O. N. Acharya,[16] Energy saving and prolonging network lifetime are a major issue in wireless sensor network. We have taken a small step in providing
energy efficient network by calculating the average distance between network nodes and taking into account the residual energy. Finally, the weight for each node is calculated based on average distance and residual energy and node with minimum weight acts as a cluster head. This approach has highly increased network lifetime by uniform cluster distribution and balancing the network loading among the clusters. The results show that our proposed scheme achieves low energy consumption and prolongs the network lifetime.
In this article, an energy efficient novel clustering scheme is designed in order to provide low energy consumption, reducing the overload on sensor nodes and increase network lifetime of wireless sensor network. The cluster based technique is one of the major approaches in reducing energy consumption in wireless sensor networks. The main idea of this article is to reduce data transmission distance of sensor nodes in wireless sensor networks by using clustering concepts. However, clustering concepts face several challenges in selection of cluster head, rotating the role of cluster head in clusters and optimal data routing in the network. So, we propose a protocol which provides energy efficient clustering and optimal data routing to increase the network longevity.
3. PROPOSED SYSTEM
Sink repositionhas been proved to be an effective method to increase the lifetime of WSN. To use this effectiveness it tried to present a new technique for clustering the sensor nodes and repositioning the sink nodes. The main motivation for proposing this system is applying the effectiveness of K MEANS algorithm with distance reduce between the sink nodes and the sensor nodes. It tried to develop sink repositioning and clustering method depending on the distance of the nodes in order to extend the lifetime of WSN. Sink repositioning by using the clustering method can reduce the data transmission distance and balance the traffic load throughout wireless sensor networks.
3.1 Proposed System Model
© 2017, IRJET | Impact Factor value: 5.181 | ISO 9001:2008 Certified Journal
| Page 703
The system infrastructure is composed of sink nodes and number of sensor nodes within a sensing area. We divide nodes into sensor nodes, and sink nodes. The sensor nodes operate in a sensing mode to monitor the environment information and transmit data to the sink nodes. Sink nodes are responsible for transmitting it to the connected user. This is a centralized system election of sink nodes take place in base station and is elected sink nodes are announced to all the other nodes. This process reduces the control overhead in sensor nodes and hence conserves energy. This approach is not only inefficient in terms of energy consumption but also unrealistic. The sink is usually located the sensing area and directly reachable to the sensor nodes. So, most realistic approach is multi-hop path among the sink node between the sink and the sensing nodes which provides more energy efficient.
Basic elements of Wireless Sensor Network:-
Sensor Node: A sensor node is the core component of a WSN. Sensor nodes can take on multiple roles in a network, such as simple sensing, data storage, routing, and data processing.
Clusters: Clusters are the organizational unit for WSNs. The dense nature of these networks requires the need for them to be broken down into 2 clusters to simplify tasks such a communication.
Sink nodes: sink nodes are the organizational leader of a cluster. They often are required to organize activities in the cluster. These tasks include, but are not limited to data aggregation and organizing the communication schedule of a cluster. It provides the communication link between the sensor network and the end-user. End User: The data in a sensor network can be used for a wide-range of applications. Therefore, a particular application may make use of the network data over the internet, using a Personal Digital Assistant (PDA), or even a desktop computer. In a queried sensor network (where the required data is gathered from a query sent through the network). This query is generated by the end user. In wireless sensor networks, data communications consume a large amount of energy. Input n set of sensor nodes and k set of sink nodes. Deploy the wireless sensor nodes at random location and select the sink nodes randomly among the sensor nodes. After selected the sink node processes the sink repositioning at the center of its assigned sensor nodes within a cluster. The following model shows the sink repositioning techniques within each cluster. To run a k-means algorithm, the system in figure 3.1 has to randomly initialize two points called the cluster sink. It has two cluster sinks, because It wants to group its sensor nodes into two clusters. K-means is an iterative algorithm and it does two steps:
1. Cluster assignment, step 2. Move sinks, step
[image:5.595.324.528.84.278.2]In Cluster assignment step, the algorithm goes through each of the sensor nodes and depending on which cluster is closer, whether the red cluster sink or the blue cluster sink, It assigns the sensor nodes to one of the two cluster sinks. In move sink step, K-means moves the sink to the average of the sensor nodes in a cluster. In other words, the algorithm calculates the average of all the sensor nodes in a cluster and moves the sinks to that average location. This process is repeated until there is no change in the clusters (or possibly until some other stopping condition is met). K is chosen randomly or by giving specific initial starting sensors by the user. Now, check out the figures 3.1 below. This is the examples of K-means being run on 14 sensor nodes (with k =2). The data does not have well defined cluster, Figure 3.1 shows the initial sensor nodes before clustering and after clustering the result after 3 iterations. The three lines in figure 3.1shows the path from each sinks initial location to its final location. Figure 3.1 shows the sink node repositioning from one up to four rounds. The total energy consumption consists of the average energy dissipated by data transmission of the sensor nodes and sink nodes. In addition, the energy consumption for data collection and aggregation of sink nodes is considered. Figure 3.2 illustrates the radio energy dissipation model in wireless networks. In this model, to exchange a B-bit message between the sensor nodes and sink nodes, the energy consumption can be calculated by Figure 3.2: Radio Energy Dissipation Model
[image:5.595.322.565.620.742.2]© 2017, IRJET | Impact Factor value: 5.181 | ISO 9001:2008 Certified Journal
| Page 704
ETx(d, L) = Eelec*L+Eamp*L (1)
ERx (L) = Eelec*L (2)
Where d is the distance between the sensor nodes and sink nodes, ETx (d,L) is the transmitter energy consumption and E Rx(L) is the receiver energy consumption. Eelec is the electronics ,energy consumption per bit in the transmitter and receiver sensor nodes. Eamp is the amplifier energy consumption in transmitter sensor nodes, which can be calculated by Eamp = Efs*d2, for d<=d0 (3)
Eamp * d4 , for d >= d0 (4
ETx(d, L) = Eelec*L+Eamp*L *d2 (5)
ERx (L) = Eelec*L (6)
Where, d0 is the threshold value. If the distance d is less than x0, the free space propagation model is used. Otherwise, the multi-path fading channel model is used. Efs and Eamp are communication, energy parameters.
4. Methodology
When the sink starts to move towards its next location at each step it will look for those sensor nodes that are just one hop away from the sink in order to check for their connectivity with the sink. If the sink is reachable then the last hop sensor nodes will adjust its transmission power so that the sink can receive the messages properly while moving to its next intermediate position. On the other hand, if the sink goes out of the transmission range of these sensor nodes, then it will look for a sensor that can be used for relaying the data further. Such selected sensor should be such that it should be reachable by both the sink and the last hop sensors and should have sufficient amount of energy. If multiple node options are available, then the one having the highest energy is selected. After this the sink will update the routing table and broadcast it to the other sensors and then proceed further to the next location.
4.2 Algorithm
The Κ-means clustering algorithm uses iterative refinement to produce a final result. The algorithm inputs are the number of clusters Κ and the sensor nodes. The sensor nodes are a collection of features for each sensor node. The algorithms starts with initial estimates for the Κ sinks, which can either be randomly generated or randomly selected from the sensor nodes. The algorithm then iterates between two steps:
1. Sensor node assignment step: Each sink node defines one of the clusters. In this step, each sensor node is assigned to its nearest sink node, based on the squared Euclidean distance. More formally, if Si is the collection of sink node in
set S, then each sensor node Sn is assigned to a cluster based on Argmin dist(Si,Sn)2, Si Є S Wheredist( · ) is the standard
(L2) Euclidean distance. Let the set of sensor nodes assignments for each ith cluster sink be Si.
2. Sinks move (update) step:
In this step, the sinks are recomputed. This is done by taking the mean of all sensor nodes assigned to that sink's cluster. The algorithm iterates between steps one and two until a stopping criteria is met (i.e., no sensor nodes change clusters, the sum of the distances is minimized, or some maximum number of iterations is reached).
This algorithm is guaranteed to converge to a result. The result may be a local optimum (i.e. not necessarily the best possible outcome), meaning that assessing more than one run of the algorithm with randomized starting sinks may give a better outcome.
4.3 K-MEANS Algorithm
K-MEANS is the simplest algorithm used for cluster sensor nodes. It chooses the sink nodes and allocate to the center of the sensor nodes smartly and it compares with the sensor node based on their intensity and characteristics and finds the distance, the sensor nodes, which are similar to the sink are assigned to the cluster having the sink. The new sink is calculated and thus k-clusters are formed by finding out the sensor nodes nearest to the sinks.
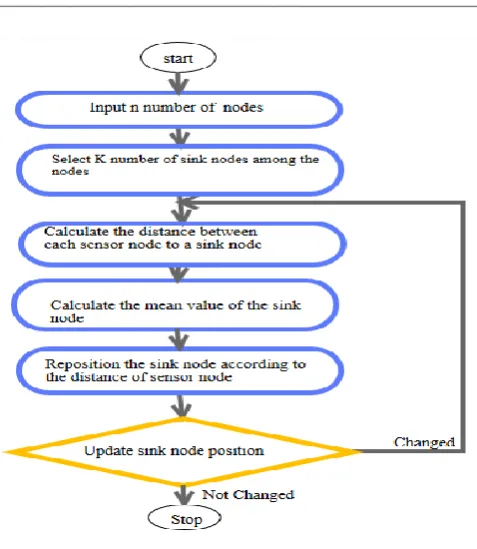
1. Choose k numbers of sink nodes randomly among sensor nodes, k being the number of clusters desired.
2. Calculate the distance between each of the sensor nodes to each of the sink nodes, and assign each sensor node to the closest sink node.
3. Calculate the new sink node by calculating the mean value of all sensor nodes in the respective cluster.
4. With the new sinks, repeat step 2. If the assignment of sinks for the sensor node changes, repeat step 3 else stop the process.
The distance between the sensor nodes is calculated using Euclidean distance as follows. The Euclidean distance between two nodes,
Sn = (Sn1,Sn2 ...Snn) S = (S1,S2 ...Sk)
Dist(Sni,Sj) = -Sj||2
||Sni – Sj|| = The Euclidean distance between sink node & sensor nodes (Distance Function)
n = Set of sensor nodes
© 2017, IRJET | Impact Factor value: 5.181 | ISO 9001:2008 Certified Journal
| Page 705
Figure 4.1 K-means Algorithm Flowchart
5. Results and Discussion
The Performance of the existed K- means clustering algorithms via simulations is presented in this section. This work uses MATLAB as the simulation tool where all simulations are conducted on networks using the IEEE 802.15.4 at the MAC layer. The system considers a wireless sensor network with N = 49 nodes randomly distributed in a 800 x800 m field. Without losing generalization, the system assumes the sinks are in the center of the their assign sensor nodes. Simulation parameters are listed in Table 1. The sensor nodes in the network which is divided into five clusters, each has its own sink node. The system has clustered the network in the same number of clusters. The system found an intra cluster distance of the cluster. Results have shown that mentioned the cluster sinks can be placed randomly or separated by some minimum distance. Results show that if the cluster sink are separated by some minimum distance it gives small energy consumption.
© 2017, IRJET | Impact Factor value: 5.181 | ISO 9001:2008 Certified Journal
| Page 706
sink nodes. In Figure 5.1 there are 49 nodes, which are 44 sensor nodes and 5 sink nodes distributed in 800m by 800m sensing area. In the figure shows the sink position before and after the sink nodes shifting their original position. The sink which has blue color shows that placed at the original position and sinks in pink color shows the position of a sink after twelve iterations the sink node placed the last position. Figure 5.1 shows the sensor nodes position (Sn), sink nodes position before sinks repositioning (SBR) and sink nodes position sinks after repositioning(SAR) of a given test system contain 49 sensor nodes. Among the 49 sensor nodes 5 of the nodes are selected to be a sink node. The selection criteria of the sinks is by the following formula
Sn = Ns/Ks
Where Sn = sinks node
NS = Total number of sensor nodes Ks = Number of clusters
0 100 200 300 400 500 600 700 800
0 100 200 300 400 500 600 700 800
Random Node Deployment
X-axis
Y
-a
x
i
s
[image:8.595.44.290.327.539.2]SN SBR SAR
Figure 5.1 Deployment of Nodes
SN : Sensor node
SBR:Sink Node before Repositioning SAR:Sink Node After Repositioning
All the parameters on which the simulation is based are listed in Table 1. Performance Analysis is done on the basis of Energy Consumption and the node which die out first. Analysis is performed in each round by calculating the total network energy consumed during each round. Figure 5.2 shows the decrease in total network energy is each round. Energy Consumption is measured for K-means and it was found that energy consumption in each round is highly decreased. Figure 5.2 shows the total network energy when the number of nodes is equal to 49 and the sensing area is taken to 800m x 800m. It is evident that energy conserved by proposed algorithm is higher reducing energy consumption.
Figure 5.2 depicts when the nodes dies which have a long distance from their sink and half of the sensor nodes alive their distance near to their sink. The energy consumption in a single hop network increases due to larger distances from sinks to sensor nodes. So, in K-means clustering algorithm the election of cluster sink is uniform and thereby can be a large number of cluster sinks which may drain the total network energy. The reason for this behavior is that the data communications consume a large amount of energy in wireless sensor networks belongs to distance. However, the transmission distance between sensor nodes and sink node is suitable by using our scheme. The transmission power of sensor nodes is reduced. The blue color in figure 5.2 shows the energy consumption of nodes while the sink nodes is not placed on the mean value of its sensor nodes, so the node which is far away from the sink consume more energy than the node nearest to the sink. in the figure 5.2 red color shows less energy consumption compare to the blue color, the energy consumption after the sink node is placed on the mean value of its assigned sensor nodes. It shows that energy consumption is much lesser if the cluster sinks are separated with minimum distance. The node which has less energy consumption mean it is nearest to the sink node.
5 10 15 20 25 30 35 40 45
0 0.2 0.4 0.6 0.8 1 1.2 1.4 1.6 1.8
x 10-4
Energy Consumption
Number of Nodes
E
ne
r
gy
(
J
)
[image:8.595.327.566.391.595.2]IEC FEC
Figure 5.2 energy consumption of Nodes
IEC: initial energy consumption FEC:Final energy consumption
© 2017, IRJET | Impact Factor value: 5.181 | ISO 9001:2008 Certified Journal
| Page 707
Energy, in a node gets decreased. The current value of energy in a node after receiving or transmitting, routing packets is the residual energy. Data Transmission is established between nodes.Residual energy of the node is evaluated by accessing the inbuilt variable energy in find Energy procedure at different times.
Figure 5.3 shows the residual energy of 12 rounds a given test system containing 49 nodes. The first round in red line achieves less residual energy of each node compare to other rounds which means they consume more energy.the second round blue line achieves low residual energy but better than the first round. From the first round up to the fourth round residual energy low compare to other rounds. Figure 5.3 shows that yellow line achieves higher residual energy after the 12 rounds, which is taken in this simulation work.
0 5 10 15 20 25 30 35 40 45 50
8 9 10x 10
-4
Number of Nodes
E
ne
r
gy
(
J
)
Resigual Energy of sensor nodes
[image:9.595.50.293.302.550.2]RE1 RE2 RE3 RE4 RE5 RE6 RE7 RE8 RE9 RE10 RE11 RE12
Figure 5.3 Residual energy of nodes
Conclusion
Energy saving and prolonging network lifetime are a major issue in wireless sensor network. The system has taken a small step in providing energy efficient network by calculating the average distance between the network nodes and taking into account the residual energy. Finally the weight for each node is calculated based on average distance and residual energy and node with the center position acts as a sink node. This approach has highly increased network lifetime by uniform sensor node distribution and balancing the network loading among the clusters. The results show that proposed scheme achieves low energy consumption and prolongs the network lifetime.
REFERENCES
[1] A. Hać, Wireless sensor network designs. Chichester, West Sussex, England ; Hoboken, NJ: J. Wiley, 2003.
[2] W. Dargie and C. Poellabauer, Fundamentals of wireless sensor networks: theory and practice. Chichester, West Sussex, U.K. ; Hoboken, NJ: Wiley, 2010.
[3] H. Karl and A. Willig, Protocols and architectures for wireless sensor networks. Hoboken, NJ: Wiley, 2005.
[4] L. Friedmann and L. Boukhatem, “Efficient multi-sink relocation in wireless sensor network,” in Networking and Services, 2007. ICNS. Third International Conference on, 2007, pp. 90–90.
[5] J. R. Patole, “Clustering in wireless sensor network using K-MEANS and MAP REDUCE algorithm,” MSc Coll. Eng. Pune India, 2012.
[6] Z. Vincze, R. Vida, and A. Vidacs, “Deploying multiple sinks in multi-hop wireless sensor networks,” in Pervasive Services, IEEE International Conference on, 2007, pp. 55–63.
[7] L. B. Saad and B. Tourancheau, “Multiple Mobile Sinks Positioning in Wireless Sensor Networks for Buildings,” 2009, pp. 264–270.
[8] J. Guo, “Sink Mobility Schemes in Wireless Sensor Networks for Network Lifetime Extension,” 2012.
[9] P. Shrivastava and S. B. Pokle, “Sink Repositioning Technique to Improve the Performance of the Wireless Sensor Networks,” Int. J. Future Comput. Commun., pp. 372– 374, 2012.
[10] P. Vadivazhagu and P. D. Selvam, “Network lifetime enhancement method for sink relocation and packet drop detection in wireless sensor networks,” in Communications and Signal Processing (ICCSP), 2015 International Conference on, 2015, pp. 0500–0504.
[11] M. Koç and I. Korpeoglu, “Controlled Sink Mobility Algorithms for Wireless Sensor Networks,” Int. J. Distrib. Sens. Netw., vol. 10, no. 4, p. 167508, Apr. 2014.
[12] J. Guo, “Sink Mobility Schemes in Wireless Sensor Networks for Network Lifetime Extension,” 2012.
[13] R. Faludi, Building wireless sensor networks: [a practical guide to the ZigBee Mesh networking protocol], 1. ed. Beijing: O’Reilly, 2011.
© 2017, IRJET | Impact Factor value: 5.181 | ISO 9001:2008 Certified Journal
| Page 708
[15] M. J. Handy, M. Haase, and D. Timmermann, “Low energy adaptive clustering hierarchy with deterministic cluster-head selection,” in Mobile and Wireless Communications Network, 2002. 4th International Workshop on, 2002, pp. 368–372.
[16] A. Gachhadar and O. N. Acharya, “K-means Based Energy Aware Clustering Algorithm in Wireless Sensor Network.”
[17] V. Kumar, A. Kumar, M. Singh, and others, “Improving network lifetime & reporting delay in wireless sensor networks using multiple mobile sinks,” in Computing for Sustainable Global Development (INDIACom), 2016 3rd International Conference on, 2016, pp. 1675–1678.