World Maritime University
The Maritime Commons: Digital Repository of the World
Maritime University
World Maritime University Dissertations Dissertations
2000
Changes in export structure in Vietnam : impacts
on Vietnamese maritime transport
Pham Thi Anh Thu World Maritime University
Follow this and additional works at:http://commons.wmu.se/all_dissertations
This Dissertation is brought to you courtesy of Maritime Commons. Open Access items may be downloaded for non-commercial, fair use academic purposes. No items may be hosted on another server or web site without express written permission from the World Maritime University. For more Recommended Citation
Thu, Pham Thi Anh, "Changes in export structure in Vietnam : impacts on Vietnamese maritime transport" (2000).World Maritime University Dissertations. 279.
WORLD MARITIME UNIVERSITY
Malmö, SwedenCHANGES IN EXPORT STRUCTURE
IN VIETNAM
Impacts on Vietnamese maritime transport
By
PHAM THI ANH THU
VietnamA dissertation submitted to the World Maritime University in partial fulfillment of the requirements for the award of the degree of
MASTER OF SCIENCE
in
SHIPPING MANAGEMENT
2000
DECLARATION
I certify that all the material in this dissertation that is not my own work has been identified, and that no material is included for which a degree has previously been conferred on me.
The contents of this dissertation reflect my own personal views, and are not necessarily endorsed by the University.
Signature : ……….
Date : ……….
Supervised by:
Dr. Shuo Ma
Course Professor, Shipping and Port Management World Maritime University
Assessor:
Capt. Jan Horck
Lecturer, Shipping and Port Management World Maritime University
Co-assessor:
ACKNOWLEDGEMENTS
I would like to express my great gratitude and sincere thanks to all those who have given me encouragement, guidance and support in the completion of this dissertation.
My great thanks are given to the World Maritime University for sponsoring my studies here from the University’s Special Funds. I also would like to express my profound gratitude to Mr. Le Quy Quynh, graduate of the World Maritime University, for recommending me to study at the World Maritime University and his kind help to me during my studies here.
I am indebted to my supervisor, Prof. Dr. Shuo Ma, for his useful guidance and comments during my writing of this dissertation. I also wish to thank other professors and lecturers of the Shipping Management course for their advice on this work. My thanks also go to all the staff of the World Maritime University’s library for their helpful assistance to me in collecting necessary data and information for this dissertation. I am very grateful to the teachers of English of the World Maritime University for improving my English usage and particularly to Mr. Clive Cole for reviewing the English language of this dissertation.
I also would like to take this opportunity to convey my thanks to my colleagues at the World Maritime University who gave me their assistance during my stay in Sweden and shared some discussions with me from time to time.
ABSTRACT
Title of Dissertation: Changes in export structure in Vietnam – Impacts on
Vietnamese maritime transport
Degree: M.Sc.
This study is an analysis of export structure in Vietnam, its trends over the past years and expectations in the coming time.
The overall macro-economic policy of the Government, especially the economic renovation policy including changes in trade and investment policies, and its impacts on structural changes in export performance are a major aspect of this study. Besides, external factors play a very important role as well, bringing in a lot of opportunities and also challenges to Vietnam. The future depends very much on how Vietnam continues its reforms as well as makes suitable policies under its particular conditions.
The results of this analysis show that Vietnam has the potential to export various products and in the export composition processed products and labour-intensive manufacturing tend to grow quickly and much faster than raw materials and fresh food. In terms of demand for maritime transport, this coincides with the fast growth of containerised cargoes; however, the volume for other types of cargo will still be significant in the medium term. Therefore, it is the role of the national shipping industry to take advantage of these developments and make suitable changes in developing its fleet and the necessary infrastructure for the national benefit.
KEYWORD:Seaborne trade, foreign trade, export structure, manufactured
TABLE OF CONTENTS
Declaration i
Acknowledgements ii
Abstract iii
Table of Contents iv
List of Tables vii
List of Figures ix
List of Abbreviations x
1 Introduction 1
2 Economic and trade policies – bases for export promotion
2.1 Prospects for the Vietnamese economy 4
2.1.1 Renovation policy 4
2.1.2 Slowdown since 1997 and three-year reform program
(2001-2003) 5
2.2 Changes in the structure of the economy 7
2.3 Trade policy reform and integration process 8
2.3.1 Trading reform in the 1989-1999 period 9
2.3.2 Opening up to international trade: A three-year agenda 12
2.3.3 Participation in trade agreements 12
3 Export dynamics
3.1 Export patterns in East Asian countries 15
3.2 Exploiting comparative advantages for export development
in Vietnam 18
3.2.1 Initial comparative advantages 18
3.2.2 Moving towards processed agricultural exports 19
3.2.3 Promoting the export of manufacturing products 20
3.2.3.1 The role of FDI 21
3.3 Structural changes 23
3.3.1 Recent trends in export structure 23
3.3.2 Effects of the ‘Opening up to the international trade’
program 25
4 Market factor in export structure changes
4.1 Market expansion policy and changes in export market structure 29
4.2 Effects of Japan’s MFN status and AFTA participation 33
4.2.1 MFN status by Japan 33
4.2.2 ASEAN market and effects of AFTA 34
4.3 Potential of the EU market 37
4.3.1 Garments 38
4.3.2 Footwear 39
4.3.3 Seafood 39
4.4 US market and effects of MFN status 40
4.4.1 Garments – a strong growth to be expected 42
4.4.2 Footwear 43
4.4.3 Seafood 44
5 Demand for maritime transport
5.1 The importance of seaborne trade 46
5.1.1 Sea trade in economic development 46
5.1.2 Sea trade structure changes 48
5.2 Export cargoes 50
5.2.1 Non-containerised cargoes 50
5.2.1.1 Dry cargoes 51
5.2.1.2 Liquid bulk cargoes 51
5.2.2 Containerised cargoes 52
5.2.2.1 Containerisation in Vietnam 52
5.2.2.2 Containerised exports 54
6 Impacts on Vietnamese maritime transport
6.1 Vietnam’s transportation share and necessary co-operation from
domestic traders 60
6.1.1 Transportation market 60
6.1.2 Cargo reservation 62
6.1.3 Trading terms in foreign trade contracts 62
6.2 Shipping fleet development 63
6.2.1 Shipping fleet structure 63
6.2.2 Competitiveness and scope of activities 65
6.3 Port development 67
7 Conclusion 71
References 76
Appendices
Appendix 1 List of Vietnamese exports by SITC groups, as of 1998 81
Appendix 2 Vietnamese main trading partners (% of total) 83
LIST OF TABLES
Table 2.1 GDP growth rate (%) 7
Table 2.2 Macroeconomic structure of Vietnam (%) 7
Table 2.3 Structure of GDP of some Asian countries (%) 8
Table 2.4 Private participation in foreign trade 11
Table 3.1 Primary commodities and labour-intensive and
resource-based exports as a share of total non-oil exports of selected developing countries and regions, 1965-1994
17
Table 3.2 Merchandise exports by commodity (US$ million) 18
Table 3.3 Investment by sector (01/01/88 – 25/04/98) (US$ billion) 21
Table 3.4 Export structure by product group in Vietnam 24
Table 3.5 Indicators on export performance by some Asian
countries (1994-1998)
24
Table 4.1 Vietnam’s export turnover to Asian countries 30
Table 4.2 Vietnam’s large exports to ASEAN in 1998 36
Table 4.3 Exports from Vietnam to the US for major commodities
(US$ million)
42
Table 4.4 Export of aquatic products to Japan, EU and the US
(US$1000)
44
Table 5.1 Cargo structure in metric ton 49
Table 5.2 Volume of some main non-containerised exports (1000
tons)
50
Table 5.3 Container traffic forecast, by country 54
Table 5.4 Container trade (1995-1998) 55
Table 5.5 Compared value and volume trend of major exports
(1994-1998)
Table 6.1 Vietnamese share of sea transportation in 1997 (million tons)
61
LIST OF FIGURES
Figure 2.1 Vietnam’s exports in the 1990s 9
Figure 3.1 Revealed comparative advantage (RCA): VIETNAM 19
Figure 3.2 FDI and exports correlation (1991-1998) 27
Figure 4.1 Export growth by partner 32
Figure 4.2 Export structure by market 33
Figure 4.3 Exports to EU 37
Figure 4.4 Garment exports to Japan, EU and the US 43
Figure 5.1 Overseas seaborne trade dependence 47
Figure 5.2 Industrial production and international sea trade
correlation (1990-1997) 48
Figure 5.3 GDP and international sea trade correlation (1990-1997) 48
Figure 5.4 Overseas cargo volume and forecast 50
Figure 5.5 Containerisation in Vietnam (1989-1999) 53
LIST OF ABBREVIATIONS
ADB Asian Development Bank
AFTA ASEAN Free Trade Area
AmchamVietnam American Chamber of Commerce in Vietnam
APEC Asia-Pacific Economic Cooperation
ASEAN Association of Southeast Asian Nations
CEPT Common Effective Preferential Tariff
CFR Cost and freight
CIF Cost, insurance and freight
CMEA Council for Mutual Economic Assistance
DWT Deadweight
EPZ Export Processing Zone
EU European Union
FDI Foreign Direct Investment
FOB Free on board
GDP Gross Domestic Product
GT Gross tonnage
GSP General System of Preference
IAP Individual Action Plans
IMF International Monetary Fund
LPG Liquefied Petroleum Gas
MDF Maritime Dependence Factor
MFN Most-Favored Nation
MoT Ministry of Trade
NIEs Newly Industrializing Economies
OECF Japanese Overseas Economic Development Fund
RCA Revealed Comparative Advantage
SITC Standard International Trade Classification
Tcf Trillion cubic feet
TEU Twenty-foot equivalent unit
TNCs Transnational Corporations
UNCTAD United Nations Conference on Trade and Development
UNDP United Nations Development Program
US United States
US$ United States Dollars
VICT Vietnam International Container Terminal
Vinacoal Vietnam National Coal Corporation
VINALINES Vietnam National Shipping Lines
VINAMARINE Vietnam National Maritime Bureau
VND Vietnamese Dong
Vtic Vietnam Trade Information Centre
WB World Bank
CHAPTER 1
1 INTRODUCTION
Vietnam is an emerging economy in Southeast Asia. Its development has been remarkable over the past decade since the Vietnamese Government started its economic renovation policy in the late 1980s. Vietnam has been taking steps to become integrated in the region and in the world.
Vietnam itself has an abundance of natural resources, which are potential for exporting agricultural products and minerals. Besides, with a population of nearly 80 million people, Vietnam can provide a large labour force for labour-intensive industries. The open-door policy since the late 1990s has been a driving force for the export of Vietnamese products based on such available resources. Together with this, changes inside the export structure are also happening as a result of the integration process and in response to the new market conditions.
clarified in the chapter-by-chapter analyses in this dissertation. Finally, changes in trade certainly create impacts on the transportation activities and particularly maritime transport, which is considered as the dominating transport mode for Vietnamese international trade. What is the current situation of Vietnamese shipping industry and its role in providing transportation services for the national cargoes? Opportunities for the national shipping are plenty; however, the challenges are big as well.
Chapter 2 entitled ‘Economic and trade policies – bases for export development’ gives a global picture of the Vietnamese economy: the changes happening inside Vietnam, the difficulties Vietnam is facing and steps it has been taking for future development. It is the longer steps in the economic and trade reforms together with benefits of participating in trade agreements that can bring bright prospects for the national economy in general and positive changes in export structure in particular.
Chapter 3 entitled ‘Export dynamics’ shows how Vietnam exploits its comparative advantages in promoting exports. General trends in export activities in East Asian countries are examined as a typical development model in Asia, which Vietnam is now following up at the early stages. Recent changes show that export of processed food and labour-intensive manufactured products are growing quite fast in Vietnam.
Chapter 5 entitled ‘Demand for maritime transport’ links the development of exports to the potential cargo volume for shipping. Containerised cargoes have been growing dramatically and are expected to further develop in the coming time. However, given Vietnam’s abundant natural resources, the export volume of liquid bulk like crude oil or other dry cargoes like coal still offer great potential for maritime transport.
Chapter 6 entitled ‘Impacts on national maritime transport’ shows that the Vietnamese shipping industry has been developing much slower compared with the national trade development. If Vietnam wishes to benefit from high cargo movements in the country, many tasks must be done. The difficulties are quite large, especially the matter of capital sources. Therefore, the role of the Government is very important in producing appropriate policies as directions for the national shipping industry.
Chapter 7 gives the conclusion and recommendations.
CHAPTER 2
2 ECONOMIC AND TRADE POLICIES – BASES FOR EXPORT
PROMOTION
2.1 Prospects for the Vietnamese economy
2.1.1 Renovation policy
doubled, transforming Vietnam from a net food importer to one of the world's largest exporters of rice. Economic reforms also resulted in a dramatic increase in Vietnam's foreign trade, which now represents 80 percent of GDP. In addition, foreign direct investors kept pouring their money into this newly emerging market. The average level of foreign investment inflows for the 1995-1997 period reached US$2 billion a year. Vietnam appeared to be the next "Asian tiger".
2.1.2 Slowdown since 1997 and three-year reform program (2001-2003)
Despite of the above mentioned achievements in the economy, it is important to know that the past two years (1998-1999) marked a big drop in Vietnam's growth rate within this decade, from 8-9 percent during 1990-1997 period to around 4 percent in both 1998 and 1999. In fact, Vietnam is facing twin challenges, one from the effects of the East Asian economic crisis, and one from serious structural problems such as its high current account deficit and a high level of external indebtedness at 23 percent of GDP in 1997.
As a result, the growth rate of exports and foreign direct investment (FDI) fell to levels not seen since the early 1990s. Regarding exports, it only grew at 0.9 percent in 1998, compared with the 20-30 percent annual growth of previous years. The reasons were partly due to lower Asian demand for Vietnamese goods (70 percent of Vietnam's exports have gone to other Asian countries in recent years) and partly to falling world commodity prices. Besides, Vietnam's principal engine of economic growth, FDI inflows also shrank dramatically, falling to US$800 million in 1998 and US$600 million in 1999 from US$2 billion in 1997.
with the aim of accelerating its reform process. There are some warnings that without a clear and firm direction in the reform of banks, state-enterprises, trade, and private investment, Vietnam may not benefit fully from the strong regional recovery. The reason is that existing and potential exporters of manufactured products and processed agriculture may not make the investments in additional capacity that are needed to meet rising regional demands and to sustain the high export growth rate. Potential foreign investors will not get the signal they need to come to Vietnam, which is reflected recently by the returning of investments to the Republic of Korea, Malaysia and Thailand.
Recognizing such challenges, during the past time, the Vietnamese Government has been quickly considering the adoption of a three-year reform program (2000-2002) developed by its ministries in consultation with international financial institutions with the aim to improve the efficiency of scarce investment resources. This program includes:
* creating a supportive environment for private investment;
* creating a sound banking system;
* reforming the state enterprise system;
* and opening up to international trade.
The adoption and implementation of such a program will support the growth of Vietnam and avoid the continuing slowdown. With accelerated reforms and the additional external financing that would accompany such reforms, exports and imports will grow at a sufficient rate to permit higher investment and growth. Growth projections of Vietnam under the accelerated reform can be seen in Table 2.1.
Table 2.1: GDP growth rate (%)
Item 1992-1997 1998 1999 2000
(projected)
2001 (projected)
2002 (projected)
Total GDP 8.6 4.0 4.0 4.0 – 5.0 5.5 – 6.5 6.0 – 7.0
Agriculture 4.4 2.8 4.8 3.5 3.5 3.5
Industry 12.8 7.0 5.7 5.8 – 7.4 9.0 – 9.8 8.8 – 10.0
Services 9.0 2.0 1.6 2.7 – 3.9 5.1 – 6.7 4.9 – 6.3
Source: World Bank
2.2 Changes in the structure of the economy
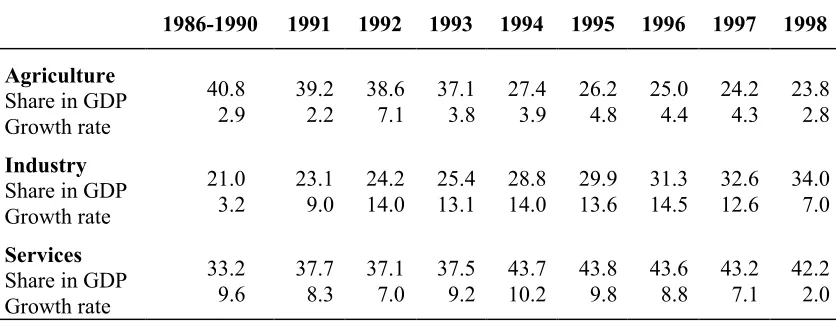
The growth in the Vietnam economy brings with it the changes in the economic structure, which are in turn an important factor to ensure the economic development in the direction of industrialization and modernization happening now in Vietnam. As usually seen in any country during the initial phase of industrialization, Vietnam's macroeconomic structure has started to change in the direction in which industry and services have increased in both absolute numbers and proportions while agriculture has increased in absolute number but has decreased relatively in proportion. (Table 2.2)
Table 2.2: Macroeconomic structure of Vietnam (%)
1986-1990 1991 1992 1993 1994 1995 1996 1997 1998
Agriculture Share in GDP Growth rate 40.8 2.9 39.2 2.2 38.6 7.1 37.1 3.8 27.4 3.9 26.2 4.8 25.0 4.4 24.2 4.3 23.8 2.8 Industry Share in GDP Growth rate 21.0 3.2 23.1 9.0 24.2 14.0 25.4 13.1 28.8 14.0 29.9 13.6 31.3 14.5 32.6 12.6 34.0 7.0 Services Share in GDP Growth rate 33.2 9.6 37.7 8.3 37.1 7.0 37.5 9.2 43.7 10.2 43.8 9.8 43.6 8.8 43.2 7.1 42.2 2.0
Industry and services are the fastest growing economic sectors. Agriculture employs 70 percent of the labour force but contributes an ever-shrinking proportion of national economic output, 23.8 percent in 1998 from 40.8 percent on average during the 1986-1990 period. Industry contributed 34 percent of the economic pie in 1998, while services accounted for 42.2 percent.
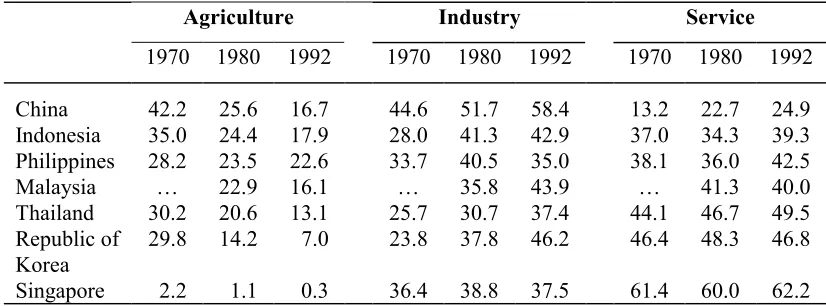
However, Vietnam is still at lower level of development and industrialization in comparison with other Asian nations (Table 2.3). For example, Vietnam's GDP composition in 1998 was equivalent to that of Malaysia in 1980, i.e. around 20 years lagging behind; and equivalent to that of earlier developed countries like the Republic of Korea in the mid 1970s, i.e. 25 years behind. Nevertheless, usually, later developed countries can move at a faster rate. Therefore, under the recent growth, Vietnam's economic structure might reach the 1992 level of Malaysia in 2005, in which the ratio among the three sectors is around 16:44:40.
Table 2.3: Structure of GDP of some Asian countries (%)
Agriculture Industry Service
1970 1980 1992 1970 1980 1992 1970 1980 1992
China 42.2 25.6 16.7 44.6 51.7 58.4 13.2 22.7 24.9
Indonesia 35.0 24.4 17.9 28.0 41.3 42.9 37.0 34.3 39.3
Philippines 28.2 23.5 22.6 33.7 40.5 35.0 38.1 36.0 42.5
Malaysia … 22.9 16.1 … 35.8 43.9 … 41.3 40.0
Thailand 30.2 20.6 13.1 25.7 30.7 37.4 44.1 46.7 49.5
Republic of Korea
29.8 14.2 7.0 23.8 37.8 46.2 46.4 48.3 46.8
Singapore 2.2 1.1 0.3 36.4 38.8 37.5 61.4 60.0 62.2
Source: Asian Economic Outlook 1993.
2.3 Trade policy reform and integration process
or assistance rather than trading of goods for commercial purpose. Since the opening up of the economy, by reducing state intervention, encouraging private enterprises and foreign investment, and liberalizing prices and trade, foreign trade has been dramatically increasing and has become one of the key elements for the country’s growth during the past decade. Vietnam two-way trade now represents about 80 percent of GDP, an indication of country’s notable integration within the world economy. Vietnam has increased its export capacity dramatically (Figure 2.1). The average export growth in 1991-1997 was impressively 28 percent. After a drop in 1998 at 2 percent, it increased at 23 percent in 1999.
Figure 2.1: Vietnam’s exports in the 1990s
Source: United Nations Development Program
Improvements in trade policies as a result of the open door policy have driven the growth of trade and will continue to bring a lot of opportunities for Vietnamese goods penetrating into various countries and regions in the world.
2.3.1 Trading reforms in the 1989-1999 period
Over the past 10 years, there has been significant liberalization of foreign trade in Vietnam. Appendix 3 in the last page of this dissertation shows various measures taken in each year since 1989 relating to this matter. Categories over the black
0 2 ,0 0 0 4 ,0 0 0 6 ,0 0 0 8 ,0 0 0 1 0 ,0 0 0 1 2 ,0 0 0 1 4 ,0 0 0
US$
m
illio
n
horizontal line show steps taken to liberalize trade and the categories below the line show the opposite. It can be realized that trade liberalization has been done continuously. Export restrictions as seen in 1990 and 1995 were actually reduced in the following years.
During the 1992-1997 period, tariffs were decreased remarkably, which helped to promote exports and imports. The maximum tariff rate was reduced to 80 percent and the number of bands reduced to 35. The share of imports subject to non-tariff barriers fell from four-fifths to two-fifths. The lower import prices created cheaper inputs for export production so that investments increased and thus helped promote exports. Partly in response to those measures the share of exports plus imports to GDP rose from 0.5 to 0.8 (World Bank, 1999, p. 10). Concerning exports alone, on the whole duties on exports are very attractive, for instance crude oil (4 percent), rice (0-1 percent), coffee (0 percent), garments (0 percent).
However, despite such improvements, by the end of 1997, some major constraints were still considered to hamper the continuing growth of Vietnam's foreign trade activities. If not solved immediately, they would have caused a negative effect on foreign trade in particular and the general development in general. First of all, the trading rights were not automatically obtained but must be through the Ministry of Trade, which obviously favoured the access of state enterprises to such rights, not the private sector (foreign invested and domestic private enterprises). Second, non-tariff barriers on imports such as licences, bans, and quotas provided high protection for some inefficient domestic industries such as petroleum, fertilizer, cement etc. and thus, the investment in these industries diverted funds to other processed agriculture and light manufacturing sectors where Vietnam has a potential to export. Third, on the export side, the allocation of quotas on garments and rice was an administrative nature, discouraging the exports of such commodities.
Vietnamese Government took a number of steps to further reduce the restrictions on trade. They included the freeing up of trading rights, the liberalization of exports and the reductions in maximum tariff rate and the number of tariff rates. These have improved the transparency, reduced rents to state enterprises, expanded access to all importers and exporters, as well as increased competition among trading and manufacturing firms.
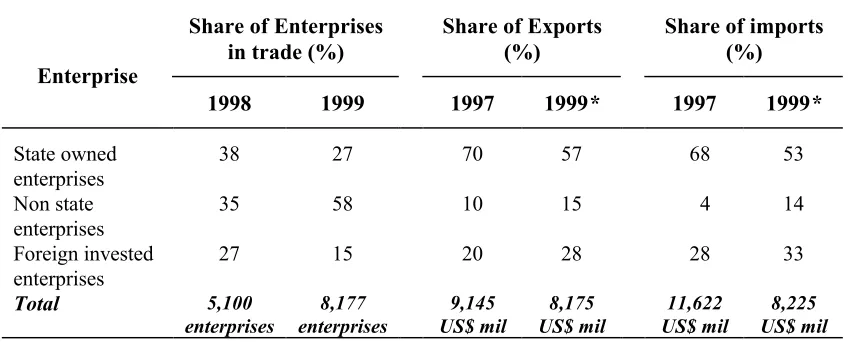
Regarding exports, export taxes on several products including rice were eliminated. Moreover, the private sector has more access to export quotas on rice and garments. Regarding imports, the maximum import tariff decreased from 80 percent to 50 percent, and the number of tariff bands from 35 to 12. Access to foreign exchanges was eased.
Table 2.4: Private participation in foreign trade
Share of Enterprises in trade (%)
Share of Exports (%)
Share of imports (%) Enterprise
1998 1999 1997 1999* 1997 1999*
State owned enterprises
38 27 70 57 68 53
Non state enterprises
35 58 10 15 4 14
Foreign invested
enterprises 27 15 20 28 28 33
Total 5,100 enterprises 8,177 enterprises 9,145 US$ mil 8,175 US$ mil 11,622 US$ mil 8,225 US$ mil
Source: Ministry of Trade and General Department of Customs
*Related to 9 months trade value
such as garments, footwear, seafood and so on, are, on average, exporting more than 75 percent of their production.
2.3.2 Opening up to International Trade: A Three- Year Agenda
As mentioned earlier, for future development, "Opening up to International Trade", a comprehensive reform of Vietnam's trade policy, is one of main subjects in the three-year reform for 2001-2003. This subject has been approved by the MoT, the International Monetary Fund (IMF) and the World Bank (WB). The main aims of this program are to remove import-licensing restrictions (on at least 17 of the 19 products), continue to liberalize trading rights, and to sign the Vietnam-US trade agreement, which in turn, is an important step towards joining the WTO.
This trade reform agenda, when implemented, will bring several improvements to Vietnam's trade. First, because trading rights are more liberalized, there will be more competition among trading companies, both private and state firms, improving the quality of import-export activities. Second, access to imports will be easier as some non-tariff barriers, like import licensing, are removed. Third, lower import protection together with lower taxes on exports will improve incentives for investors to move towards processed agriculture and manufactured exports.
2.3.3 Participation in trade agreements
countries, which is considered an important step for Vietnam’s entry into WTO. Being a member of the trade agreements, Vietnam has to continue to be committed to trade reform, further opening its trading activities with the outside world.
ASEAN. Together with the accession into ASEAN in 1995, Vietnam jointed the
ASEAN Free Trade Area (AFTA). Therefore, Vietnam committed itself to reducing tariffs along with other AFTA member countries (Malaysia, Indonesia, Brunei, Singapore, Thailand, Philippines) to 0-5 percent by 2006. When AFTA is implemented, Vietnamese goods will have more opportunities to penetrate into the markets of other ASEAN member countries.
APEC. It is not a long time since Vietnam joined APEC. The participation of
Vietnam in APEC since 1998 with the status of a full and equal member is opening new opportunities for Vietnam’s economy and its foreign trade. The APEC countries are all main partners and major investors in Vietnam. Trade between Vietnam and the other countries in the Asian-Pacific region accounts for more than 80 percent of Vietnam’s total international trade. On the one hand, by joining APEC Vietnam can make the fullest use of the privileges given by APEC to developing countries; on the other hand, Vietnam also needs to formulate concrete plans for trade liberalization in the future. Though APEC's trade liberalization program works on a voluntary basis, every member has to submit its Individual Action Plans (IAPs) every year to report on its progress and show future plans for trade and investment liberalization.
Vietnam-US trade agreement. As mentioned earlier, the conclusion of the
the signing of the Vietnam-US trade agreement has just been completed on 13 July 2000, earlier than planed, bringing a lot of bright potential to the Vietnamese economy in general, and Vietnamese trade in particular.
WTO. Vietnam submitted its proposal to join the World Trade Organization (WTO)
in January 1995. The future for the admission of Vietnam into the world’s largest trade organization is not so far away, especially after the recent signing of the bilateral trade agreement between Vietnam and the United States. Becoming a WTO member will certainly be beneficial for Vietnam. The advantages might include unconditional MFN status, a lower tariff on exports, and better access to the world market of Vietnamese goods.
*****************
CHAPTER 3
3 EXPORT DYNAMICS
3.1 Export patterns in East Asian countries
During the past decades, East Asia has been emerging as a new growth pole in the world economy. There has been what is called a ‘flying geese paradigm’ in this region, which was led by Japan. The first-tier newly industrializing economies (NIEs) include the Republic of Korea, Taiwan, Hong Kong and Singapore, which started their industrialization in the 1960s, and then the second-tier NIEs include Thailand, Malaysia and Indonesia, and more recently some other emerging economies in Asia like China, India and Vietnam.
agricultural and mineral exports to processed resource-based products. Import substitution industries emerged after that in activities where local resources, including labour, could be quickly mobilized. Labour-intensive exports as a share of their domestic production rose steadily and rapidly and soon accounted for the bulk of exports. Meanwhile, the share of primary commodities in total exports fell rapidly in both economies. As wages tended to rise with economic development, such initial comparative advantages of first-tier NIEs were unlikely to persist. First-tier NIEs began upgrading their structure of manufacturing output towards scale- and skill-intensive activities. By the second half of the 1980s, the share of these activities in total manufacturing output surpassed that of resource- and labour-intensive activities.
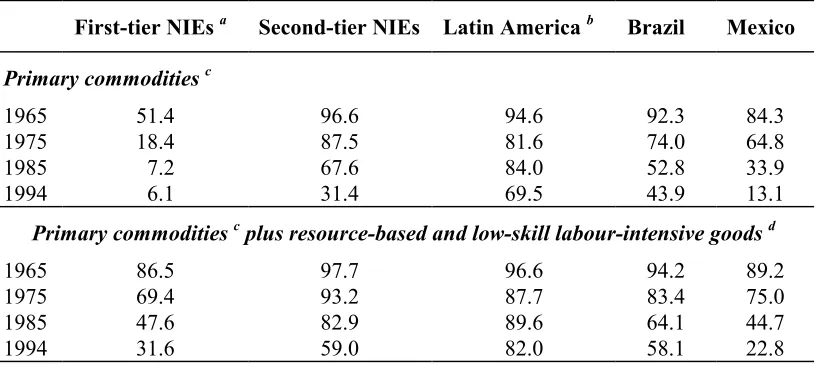
Regarding the second-tier NIEs, their initial comparative advantages can be seen as natural resources which are much richer compared with the first-tier ones (exports of primary commodities still account for almost one third of their total export earnings (other than fuels)). That is why there was initially considerable scope for them to accelerate growth through diversification and increased processing of natural-resource-based products. Beginning in the early 1970s, the second-tier NIEs also developed those export-oriented manufacturing industries where lower labour costs gave them a competitive edge such as in textiles, clothing and footwear. Table 3.1 shows the trend of declining exports of primary and low-skill labour intensive products in some developing countries.
Table 3.1: Primary commodities and labour-intensive and resource-based exports as a share of total non-oil exports of selected developing countries and
regions, 1965-1994
First-tier NIEs a Second-tier NIEs Latin America b Brazil Mexico
Primary commodities c
1965 1975 1985 1994 51.4 18.4 7.2 6.1 96.6 87.5 67.6 31.4 94.6 81.6 84.0 69.5 92.3 74.0 52.8 43.9 84.3 64.8 33.9 13.1
Primary commodities c plus resource-based and low-skill labour-intensive goods d
1965 1975 1985 1994 86.5 69.4 47.6 31.6 97.7 93.2 82.9 59.0 96.6 87.7 89.6 82.0 94.2 83.4 64.1 58.1 89.2 75.0 44.7 22.8
Source: UNCTAD, Trade and Development Report, 1996 a Republic of Korea and Taiwan
b Argentina, Chile and Colombia
c Excluding petroleum and including non-ferrous metals
d Wood and paper products; non-metallic mineral products; textiles and clothing (including footwear); and toys and sports equipment.
3.2 Exploiting comparative advantages for export development in Vietnam
3.2.1 Initial comparative advantages
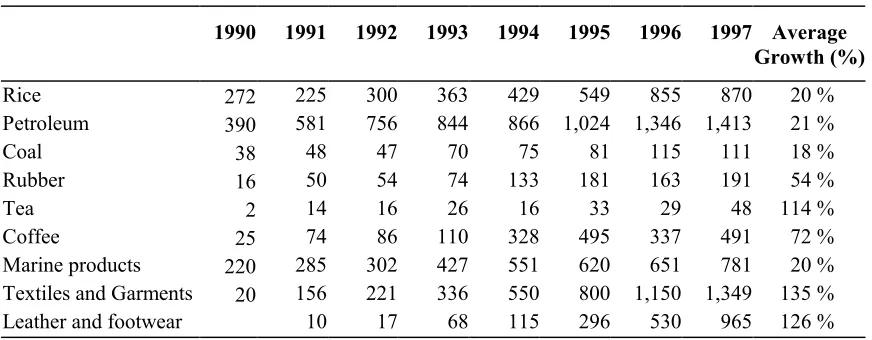
Compared with other countries in East Asia, Vietnam did not begin its industrialization until the late 1980s. It has gained a lot of experience from NIEs during its economic development, especially industrialization strategies. Vietnam also carried out export-oriented policies right at the beginning. The clear reason behind this is the necessity of foreign currency to serve its industrialization process that requires importing a large volume of capital goods and intermediate goods. Export earnings in foreign currency become a very important source to overcome the balance of payment constraints. Looking at the major exports of Vietnam (Table 3.2), it can be easily recognized that most of them are agricultural or mining products like crude oil and rice (based on natural resources), and light manufactured products like garments and leather products (mainly labour intensive). The natural resources and labour are Vietnam’s comparative advantages that are being exploited for export development. Here, Vietnam's exports look like those of East Asian countries in their early stages.
Table 3.2: Merchandise exports by commodity (US$ million)
1990 1991 1992 1993 1994 1995 1996 1997 Average
Growth (%)
Rice 272 225 300 363 429 549 855 870 20 % Petroleum 390 581 756 844 866 1,024 1,346 1,413 21 % Coal 38 48 47 70 75 81 115 111 18 % Rubber 16 50 54 74 133 181 163 191 54 % Tea 2 14 16 26 16 33 29 48 114 % Coffee 25 74 86 110 328 495 337 491 72 % Marine products 220 285 302 427 551 620 651 781 20 % Textiles and Garments 20 156 221 336 550 800 1,150 1,349 135 % Leather and footwear 10 17 68 115 296 530 965 126 %
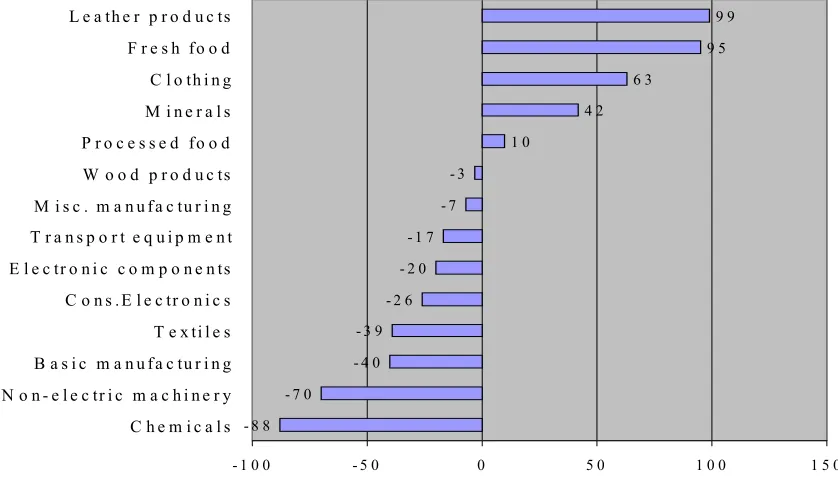
Comparing the comparative advantages of Vietnamese products, the Revealed Comparative Advantage (RCA) index can give us a better overview. This indicator aims at measuring specialization, showing how a country allocates its resources to its various industries. In Figure 3.1, it is clear that Vietnam has specialized more in leather products, fresh food, clothing, minerals and processed food, which can be categorized as primary, natural-based and labour-intensive products, compared with other products belonging to technology or capital-intensive groups.
Figure 3.1: Revealed Comparative Advantage (RCA): VIETNAM
Source: International Trade Center (WTO/UNCTAD), 2000
3.2.2 Moving towards processed agricultural exports
Like some second-tier NIEs and China which have rich natural resources, there is a trend in Vietnamese commodity exports to focus on processing those products with the aim to diversify export products and increase the value for export, while taking take advantage of the generally higher price elasticity of demand for the less volatile
- 8 8 - 7 0
- 4 0 - 3 9
- 2 6 - 2 0
- 1 7 - 7 - 3 1 0 4 2 6 3 9 5 9 9
- 1 0 0 - 5 0 0 5 0 1 0 0 1 5 0
prices of more processed products. The labour factor is also a comparative advantage Vietnam can exploit in developing the processing industry. Processed export products accounted for just 7-8 percent of total exports before 1990, but they went up to 29 percent in 1996 and 36.5 percent in 1997.
Typical is Vietnamese rice. Though ranking second in export performance in the world after Thailand, it is on average not of as good quality as Thai rice. The reality shows that Vietnamese and Thai rice have the same quality from the fields but the poorer processing activities of Vietnam have resulted in a lower quality of rice. Therefore, the Government has encouraged a lot of investment in rice processing factories.
Another example is rubber. Over the past time rubber has been usually exported in the form of raw materials, which has caused waste and low export profits. At the moment, the capacity of the rubber processing industry is able to process all local rubber production; therefore, the Government is considering to stop exporting non-processed rubber, mainly to China, and seeks new export markets like ASEAN, the US, and Africa.
A lot of investments, both from internal and external sources have also been recently done in processing fruit, seafood etc.
3.2.3 Promoting the export of manufacturing products
of the light variety, characterized by labour intensify. Vietnam has a comparative advantage in labour-intensive products because its labour force of about 40 million people (in 1998) is relatively cheap, and mainly unskilled. As a result, major manufactured exports for the time being are garments and shoes and leather products.
3.2.3.1 The role of FDI
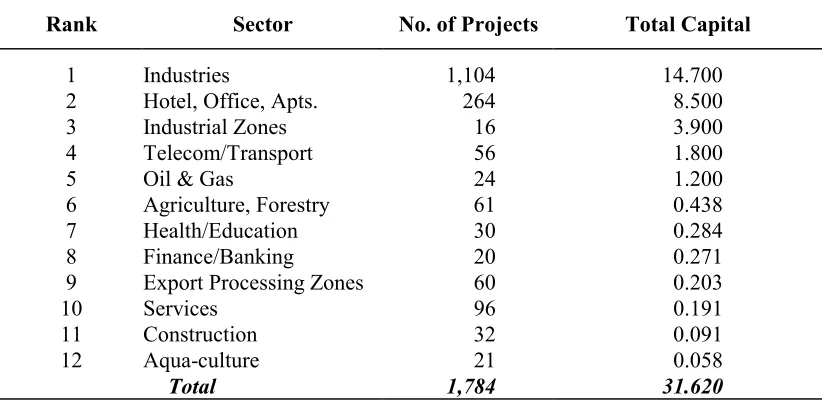
Vietnam’s industrialization course has depended much on FDI, which is considered as the main engine of the growth of the Vietnam economy in the past. Foreign investors themselves find Vietnam a potentially big market with cheap labour, abundant natural resources, and low cost of land utilization where they can allocate their investments. The structure of FDI in Vietnam can be seen in Table 3.3.
Table 3.3:Investment by sector (1/1/88 - 25/4/98) (US$ billion)
Rank Sector No. of Projects Total Capital
1 Industries 1,104 14.700
2 Hotel, Office, Apts. 264 8.500
3 Industrial Zones 16 3.900
4 Telecom/Transport 56 1.800
5 Oil & Gas 24 1.200
6 Agriculture, Forestry 61 0.438
7 Health/Education 30 0.284
8 Finance/Banking 20 0.271
9 Export Processing Zones 60 0.203
10 Services 96 0.191
11 Construction 32 0.091
12 Aqua-culture 21 0.058
Total 1,784 31.620
Source: Ministry of Planning and Investment
exploration in particular constituted the main preoccupation of foreign investors (accounting for 32.2 percent of the total investment capital). However, as from 1991 onward, the service sector and other industries, including processing and manufacturing industries for exports, have occupied a predominant position.
It is important to note that Vietnam has, step-by-step, now been participating in the general waves of economic development in the region. The fact that major investors in Vietnam are mainly from Asia including Singapore, Taiwan, Hong Kong, Japan, Republic of Korea, and even some second-tier NIEs like Thailand and Malaysia, which are at a higher level of industrialization than Vietnam, can prove this trend.
TNCs based in these more advanced economies shift their production and their simple processes to the less advanced economies like Vietnam, which have cheaper and more abundant labour. From early 1990s, firms from Taiwan, Republic of Korea, Hong Kong and elsewhere in Southeast Asia set up factories to make shoes, clothes, and toys. Japanese companies bid feverishly to build 'investment zones' to house even more foreign factories etc. Compared with other countries in the Southeast Asia region, Vietnam's labour force is the cheapest by the Government’s setting the national minimum wage at US$30 per month for unskilled labour and US$35 per month for skilled labour.
3.2.3.2 Export processing zones (EPZs)
With the aim to move towards manufacturing exports, Vietnam has so far tried its best to benefit from TNCs’ strategies by attracting parts of its comparative advantages in those TNCs' production chain. As a result, since the early 1990s, the Government has emphasized establishing EPZs in different parts of the country as a strategy to develop export-oriented manufacturing (Fujita, 1996, p. 6).
withholding tax, especially for manufacturing enterprises. For example, all manufacturing enterprises in EPZs are exempt from export duties levied on exports, and are also exempt from import duties levied on imports of equipment, supplies and raw materials.
As of 1997, Vietnam had 6 EPZs. They have succeeded in attracting various foreign companies from Japan, Republic of Korea, Taiwan, Thailand, Singapore, Europe, and North America. The main activities in the EPZs are to produce textiles, garments, electricity, electronics, precision machinery, plastics, food, alcohol, medical equipment, and software. The two biggest EPZs of Vietnam are Tan Thuan EPZ and Linh Trung EPZ. Tan Thuan EPZ has been selected by Corporate Location, a leading British newspaper, as one of the best EPZs of the Asia Pacific region. It exported US$76 million last year (1999). During the last few years, Linh Trung EPZ has been seeing a steady increase in its exports: US$9.6 million in 1996, US$42 million in 1997, US$80 million in 1998, and over US$106 million last year.
3.3 Structural changes
3.3.1 Recent trends in export structure
Table 3.4: Export structure by product group in Vietnam
Products Trend of exports (average growth %)
Share in national export (%)
1 Fresh food 7 21
2 Processed food 12 10
3 Wood products 97 2
4 Textile 38 2
5 Leather products 46 21
6 Basic manufacturing 49 2
7 Non-electric machinery 69 1
8 Cons. electronics 291 1
9 Electronics components 317 5
10 Clothing 20 15
11 Misc. manufacturing 55 3
12 Minerals 6 16
Source: International Trade Centre (UNCTAD/WTO), 1998 (http//: intracen.org)
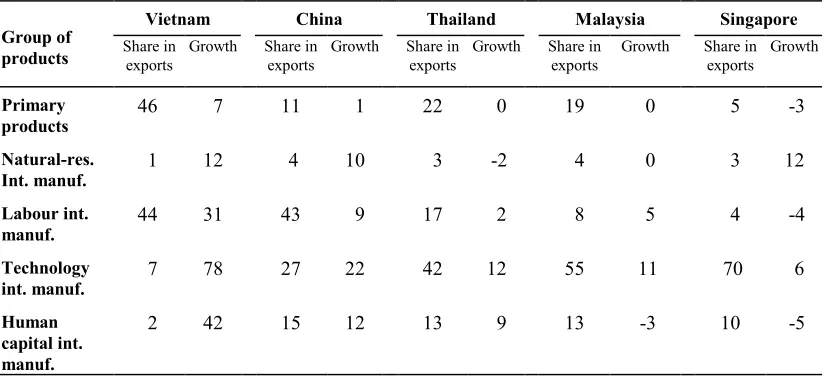
As a whole, Vietnam's export structure in terms of factor intensify can be seen in Table 3.5. During the 1994-1998 period, manufactured exports grew very fast (31 percent for labour-intensive and 78 percent for technology-intensive manufacturing), while primary exports grew only 7 percent.
Table 3.5: Indicators on export performance by some Asian countries (1994-1998)
Vietnam China Thailand Malaysia Singapore
Group of
products Share inexports Growth Share inexports Growth Share inexports Growth Share inexports Growth Share inexports Growth
Primary
products 46 7 11 1 22 0 19 0 5 -3
Natural-res.
Int. manuf. 1 12 4 10 3 -2 4 0 3 12
Labour int.
manuf. 44 31 43 9 17 2 8 5 4 -4
Technology
int. manuf. 7 78 27 22 42 12 55 11 70 6
Human capital int. manuf.
2 42 15 12 13 9 13 -3 10 -5
In reality, Vietnam's export structure is moving in the same way as other more advanced economies in the region. However, one should keep in mind that Vietnam is far behind these countries in terms of development level. Therefore, its export structure is somewhat like that of other countries in the initial period of export-oriented industrialization.
Primary and labor-intensive exports in Vietnam have accounted for 90 percent of total exports, which stand only at 54 percent in China, 39 percent in Thailand, 27 percent in Malaysia and 9 percent in Singapore. In the case of Singapore, its main exports now are technology intensive manufacturing and human capital intensive manufacturing, the general structure we can see in first-tier NIEs. Second-tier NIEs like Thailand and Malaysia have also shifted more and more to technology and human capital intensive manufacturing, though the ratio is still smaller than of that of Singapore, while labour–intensive manufacturing and primary products are still significant in the export performance.
We make a simple forecast based on the statistics in Table 3.1 and the fact that Vietnam is lagging 20 years behind second-tier NIEs at the moment but might move faster. It might be expected that in around 2010 Vietnam's export structure will be equivalent to that of second-tier NIEs in 1994 in which primary commodities account for about 31 percent of total non-oil exports, and primary products plus resource-based and low-skilled labour-intensive goods account for 59 percent. Or if in comparison with China, whose industrialization began 10 years before Vietnam in the late 1970s, Vietnam could, therefore, expect the present situation of China (Table 3.5) in the next ten years.
3.3.2 Effects of the 'Opening up to the International Trade' program
sluggish 2 percent in 1998 to 14 percent in 1999 and 26.2 percent in the first half of 2000, continuous decline in investments could hamper future development.
Vietnamese investments have been falling sharply recently, from 29 percent of GDP in 1997 to 19 percent in 1999, due in large to a precipitous drop in FDI. Since foreign-invested manufacturing accounts for about 20 percent of exports, the drastic decline in investment will have less direct but farther-reaching effects on export growth. This is because the existing foreign-invested capacity may be limited going into the next few years without new investments. In addition, domestic manufacturers depend much on flows of foreign investment to develop their production capacity. The manufacturing trend may be in trouble then, since it jeopardizes Vietnam’s development strategy, which envisions low-tech export industries, like shoe-making, providing the first big step in a progression away from a farming-based economy.
Therefore, further reform has become a necessity for the development of the Vietnamese economy in general and exports in particular, which can create a more attractive environment for investment inflows. Otherwise, Vietnam would continue its difficulties for the time being and the general trend of development could not be reached.
In reality, Vietnam itself has begun its initial steps to respond to the current situation. On May 16, 2000, the National Assembly approved the Amended Foreign Investment Law for the purpose of attracting more foreign investors, which took effect as from 1st July 2000. And, most importantly, if the 'Opening up to the international trade' program is implemented, Vietnam will move more away from import substitution to an export-oriented economy.
these areas. Foreign invested enterprises and state enterprises prefer investing in these sectors. On the contrary, those policies discourage exports of processed agriculture and light manufacturing, both of which are critical for sustaining rural growth in particular and higher export growth in general. High protection industries generate little employment for each dollar invested, and divert funds from potential export-sectors.
Figure 3.2 below shows the correlation between FDI inflows and the growth of exports from Vietnam during the 1991-1998 period. FDI had a low correlation with exports with a correlation coefficient of 0.66 only. This can be explained by the fact that in the past, FDI has been not much effective in promoting Vietnamese exports, which mainly include primary and labour intensive manufactured products.
Figure 3.2: FDI and exports correlation (1991-1998)
The current situation shows that it is impossible for Vietnam to return to the years before 1997 even after the Asian crisis has blown over a few years from now. The tougher competition for FDI and export shares from Vietnam’s ASEAN neighbours – who will have devaluated their currencies and restructured their economies by that time – will simply make it more difficult to finance import substitution. (Ari, 1998, p. 325).
Y = 2.14X + 1584 R sq = 0.66 0
2,000 4,000 6,000 8,000 10,000
0 1000 2000 3000 4000 FDI disbursements (US$ million)
Expor
ts
(
U
S$
m
The announcement that import barriers will be reduced over the next two-to-three years under the reform program will discourage further flows of investment to current protected sectors and encourage existing producers in those sectors to begin adjusting to the announced change. More importantly, the announced liberalization will lead to increasing flows of investment - both foreign and domestic - into labour-intensive exports, processed agricultural exports and rural industry, areas where Vietnam is most competitive.
This trend will be certainly promoted in Vietnam when the deadline for the tariff reductions under AFTA for Vietnam is in 2006. Domestic producers, therefore, should try their best to improve the efficiency or move to the sectors of Vietnam's competitiveness before they are kicked out by import products. The expected implementation of the Vietnam-US trade agreement also requires more openness of the economy, and in turn it will generate additional export demand from Vietnam to the vast American market and thus foreign investments in processed agriculture manufactured exports. This will be analysed more in the next chapter.
*********************
CHAPTER 4
4 MARKET FACTORS IN EXPORT STRUCTURE CHANGES
In the previous parts of this dissertation, characteristics and changes in export structure of Vietnam have been discussed. The analysis mainly comes from the angle of the general trend in Vietnam’s economy and trade, internal factors promoting the changes like trade policy, investments and economic reform. This chapter will try to analyse opportunities and new directions in the export performance with different partners, i.e. the external factors that can also be important to contribute to export structure changes. Important trade agreements, both bilateral and regional, will be focused on in order to assess their possible effects on Vietnamese exports.
4.1 Market expansion policy and changes in export market structure
Meanwhile, the roles of the two big world markets, EU and the US, are much smaller, even though they have increased during recent times. Exports to the EU increased from 5 percent in 1989 to 17 percent in 1996. Vietnam's trade with the US also increased, especially if we take into account the fact that it was virtually non-existent in 1989; however, the increase seems limited by the lack of the trade agreement (just 4 percent in 1996).
However, what are more interesting are recent changes in the Vietnamese export markets and expectations for the future.
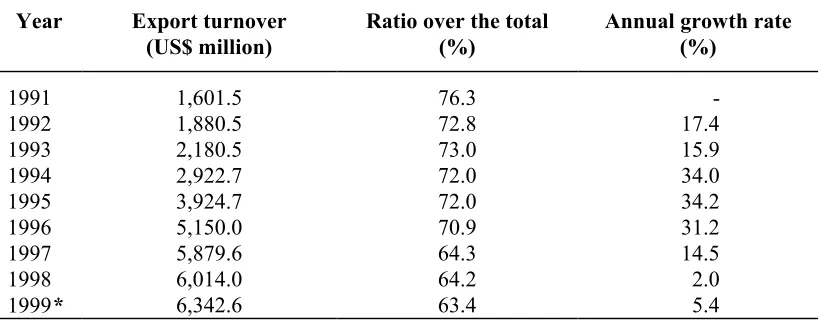
It is undeniable that in the last 10 years, export turnover to countries in Asia has seen significant growths, especially in 1995 and 1996 when this figure reached 30 percent (Table 4.1). However, looking at such growths year by year, one can recognize the diminishing trend in the share of this region in Vietnam’s total exports, especially considerable decreases during recent years, down by around 10 percent.
Table 4.1: Vietnam's export turnover to Asian countries
Year Export turnover (US$ million)
Ratio over the total (%)
Annual growth rate (%)
1991 1,601.5 76.3
-1992 1,880.5 72.8 17.4
1993 2,180.5 73.0 15.9
1994 2,922.7 72.0 34.0
1995 3,924.7 72.0 34.2
1996 5,150.0 70.9 31.2
1997 5,879.6 64.3 14.5
1998 6,014.0 64.2 2.0
1999* 6,342.6 63.4 5.4
Source: Vietnam Trade Information Centre (Vtic), 2000
* Expert estimation
semi-processed products, which are then reprocessed for exporting to third countries. Similarly, the majority of exports to Singapore, especially garments and footwear, have been re-exported to third markets. Current Vietnamese policies are trying to access direct consuming markets, moving away from intermediate markets. Typically, crude oil is one big currency earner for Vietnam from Japan; however, its share has decreased in recent years, for example from 25 percent in 1998 down to 20 percent in 1999. Besides, in reality, the Singaporean share in total Vietnamese exports to ASEAN has been decreasing in recent years: 83.89 percent in 1996, 63.14 percent in 1997, 47.5 percent in 1998 and only 37.61 percent in the first ten months of 1999.
Another clear reason is the effects of the Asian economic crisis. Due to the effects of the crisis, Vietnam’s exports to Asia (i.e. East Asia and Japan) fell by 5 and 20 percent in 1997 and 1998, respectively. Too much dependency on Asian markets brought unavoidable consequences on its exports when there was a sharp fall in demand from this major market. Moreover, Vietnamese products lost their competitiveness due to dramatic currency depreciation in Asian crisis countries.
Figure 4.1: Export growth by partner
Source: Ministry of Trade, 1999
In the coming years, the share of Asian markets will continue to slow down. The most important factor is because of the Government’s direction of expanding export markets outside Asia. “Expanding export markets in the direction of multilateralization is an urgent task on the basis of sustaining and developing existing markets, re-establishing traditional markets (i.e. Eastern European ones), making great efforts in expanding new markets in North America, Middle East and Africa...”. (Government Report in the 5th Session of the 10th National Assembly in 1999). Market expansion policy is the right direction for the purpose of diversification of buyers, which will help insulate national exports against international shocks. It is also in accordance with Vietnam’s integration trend in the world economy. Moreover, current potentials can bring a lot of hopes for the increase in exports to the EU, especially the US with the recent signing of Vietnam-US Trade Agreement (to be elaborated upon later).
Forecasts for the export market structure by 2010 can be seen Figure 4.2.
-40 -20 0 20 40 60 80 100 120
Asian crisis countries
Japan Other Asian
Europe United States
FSU Rest of world
Figure 4.2: Export structure by market
Source: Ministry of Trade
4.2 Effects of Japanese MFN status and AFTA participation
4.2.1 MFN status by Japan
Japan is the biggest importer of Vietnamese products at the moment. Export values from Japan reached US$3 billion in 1998, equivalent to 32.8 percent of Vietnam's total exports. A very good new recently is that the MFN status was finally granted to made-in Vietnam goods by the government of Japan on May 26, 1999. The result of this is that Vietnamese exports of various kinds are subject to tax reductions of 10-100 percent compared to those prior to May 26, 1999. However, the grant of MFN status by Japan is not assessed to help push up Vietnamese exports to the Japan market immediately. Only a modest rise in Vietnam-Japan trade is expected in the short term. Forecast for Vietnam's export turnover from the Japanese market is some 17 percent in 2000 (after MFN) from 15 percent last year.
The reason is that the existing Vietnamese export structure is just not geared to it right now. The structure is relatively simple. Five main exports are crude oil, marine products, garments, rice and coal, which have occupied around 70 percent of total
73 17 4 6
64 21 6.5 8.5
45 22 23 10
0% 20% 40% 60% 80% 100%
1996 1998 2010
exports to Japan in recent years. Meanwhile, the tariff differential for those is slight or nothing. The most potential export item of Vietnam to Japan is crude oil (accounting for 25 percent of Vietnam’s crude oil exports in 1998), but the tax rate applied before and after the date of granting MFN status was zero percent. The same can be seen in the case of coal. Regarding rice, which also currently has great potential to be exported to Japan, a fixed tariff rate (US$3/kg) is applied to all exporters. Regarding processed products, as much as 90 percent of the second and third largest Vietnamese exports to Japan - seafood and garments - have been granted GSP (General System of Preference which offers a tax rate lower than that fixed by MFN) since 1998, and only 10 percent enjoy MFN preferences.
However, after the MFN status is granted, expenses for imports from Japan are lower; therefore, Vietnamese producers can benefit from the decreasing price of Japanese made materials and machinery, which then helps promote Vietnamese products' competitiveness in Japan as well as other markets. Furthermore, in order to benefit from the MFN status, Vietnam will try to promote the export of other products of its strength to Japan like footwear and leather products (rates for these products have decreased from 20 percent to 10 percent), souvenir products including fine arts (at the rate of 0-3 percent). For instance, although Vietnam annually exports nearly US$1 billion of footwear, the Japanese market has been accounting for only 6 percent of the total.
In short, MFN from Japan will be beneficial for exports from Vietnam in the medium and long term, especially manufacturing products.
4.2.2 ASEAN market and the effects of AFTA
It is important to notice that the objective of establishing an ASEAN Free Trade Area or AFTA is being carried out among ASEAN member countries. Therefore, it is necessary to assess the effects of AFTA participation on Vietnam’s exports to ASEAN countries.
The Common Effective Preferential Tariff (CEPT) Agreement for AFTA requires that tariff rates levied on a wide range of products traded within the region are reduced to 0-5 percent. Quantitative restrictions and other non-tariff barriers are to be eliminated. The target of a free trade area has been continuously moved forward. From the original schedule in 2008, AFTA will now be fully completed by the year 2002 for six original signatories to CEPT (Indonesia, Philippines, Thailand, Malaysia, Singapore and Brunei). Vietnam is among new ASEAN members entering into ASEAN in 1995; therefore, the deadline for tax reduction to 0-5 percent is up to 2006.
Looking at the Vietnam’s current exports to ASEAN countries, AFTA participation has not been assessed to have much effect on Vietnam's exports to ASEAN, at least in the initial stage.
First, in terms of export markets, Singapore is Vietnam’s biggest export market in ASEAN. However, Singapore was already a free market before AFTA; therefore, CEPT participation will not create great effects on Vietnamese exports to Singapore.
not remarkable because import tariffs of most ASEAN countries are low (0-5 percent) before AFTA participation. In addition, agri-exports, typically rice and coffee (accounting for around 75-85 percent of total agricultural products) will not be included in CEPT until 2010.
Table 4.2: Vietnam's large exports to ASEAN in 1998
Items Volume/Value % of total exports
Rice 2.05 million tons 55
Coffee 50.068 tons 13.1
Rubber 26.711 tons 14
Vegetable and fruits US$8.14 million 15.2
Textiles and garments US$43.2 million 3.2
Crude oil 2.74 million tons 22.6
Coal 275.022 tons 8.7
Source: Vietnam Trade Information Center, 1999
Therefore, given the current export composition, Vietnam would derive only negligible benefits from AFTA. What Vietnam appears to benefit most from AFTA is the ability to better access the ASEAN markets for its agricultural exports. However, such benefits can not be obtained until 2010.
However, this process will take time and we can not expect much improvements in Vietnam’s exports to ASEAN, at least in the short term. Vietnam’s goods are now in danger of severe competition in the Vietnamese market after the year 2006, especially manufactured products.
4.3 Potential of the EU market
In terms of export partners of Vietnam, the EU only ranks after the groups of East Asia and ASEAN countries.
Looking at Figure 4.3, it is obvious that exports to the EU have not strongly increased until the last few years, after the signing of the Framework Agreement on Economic Cooperation between Vietnam and the EU five years ago. The average growth of exports to the EU was 46.5 percent per year during the 1994-1998. The unusual decrease in 1997 resulted from the Asian economic crisis in which Vietnamese exports lost great competitiveness compared with exports from some Asian crisis countries.
Figure 4.3: Exports to EU
Source: Ministry of Trade 1999’s figure is estimated
0 5 0 0 1 ,0 0 0 1 ,5 0 0 2 ,0 0 0 2 ,5 0 0
1 9 8 6 1 9 8 7 1 9 8 8 1 9 8 9 1 9 9 0 1 9 9 1 1 9 9 2 1 9 9 3 1 9 9 4 1 9 9 5 1 9 9 6 1 9 9 7 1 9 9 8 1 9 9 9
US$
m
illio
It is worth mentioning that the import-export structures between Vietnam and the EU favours Vietnam’s national economic development. Compared with Asia, light industrial products and consumer goods are main exports to the EU, accounting for 80 percent of Vietnam’s exports. Major Vietnam's exports to the EU include textiles-garments, leather and footwear. Vietnam has a lot of potential to promote its exports to the EU because the EU’s share in Vietnam’s total exports is still low (17 percent in 1998) while the EU is a market for a larger percent of the world’s exports. Besides, Vietnam’s current policy aims to promote the access to this big direct consuming market. Hopefully, that can further raise the export of manufactured products including garments and footwear, and agricultural processed products like seafood from Vietnam to this market.
4.3.1 Garments
At the moment, EU accounts for around 50 percent of the total Vietnamese garment exports. The potential for exporting garments to this market is still big in the coming years.
Following the 1992 signing and 1993 implementation of the Agreement on Textiles and Garments between the EU and Vietnam, export revenue has increased sharply at an average annual growth rate of 23 percent and volume grew by an average of 43.5 percent per year. Especially, in contrast to a declining demand in Asia for Vietnamese garment and textile exports during the crisis period, the EU and Vietnam signed a new trade deal in September 1998, which allows Vietnam to export one third more textiles and clothes than previously to Europe. This is a significant boost for Vietnamese manufacturers because the European market is quite large and a significant amount of its exports go to this market.
More recently on 31st March, 2000, the EU agreed to increase the quotas for
year 2001, the newly signed agreement is the recognition of the good quality of Vietnamese products. This brings more opportunities for the Vietnamese textile industry.
It must be noted that quotas applied by EU are a measure to limit the imports into this market. However, for Vietnam still with a small quantity of exports to the EU, this is a big opportunity and ensures the stability of the market factor. On the other hand, in reality, “European quotas have been raised several times but they are not fully used and the Vietnamese actual share of European imports is significantly lower than comparable countries” (World Bank, 1999, p. 39). Vietnam's administration of garment export quotas to Europe is neither transparent nor efficient. The Government has been solving that problem by the application of quota auctions and quota distribution based on export achievements of exporters.
Increasing the competitiveness of garments is another important matter, especially with the fact that quota system will be eliminated in 2005.
4.3.2 Footwear
Currently, GSP tariffs of between 5 and 12 percent have been applied to Vietnamese footwear in the EU market. That is why EU is the biggest footwear importer of Vietnam, accounting for around 75 percent of its total footwear exports. However, it is important to note that such tariff preferences will be eliminated by 2004. By then, Vietnamese footwear producers will suffer from fierce competition from big footwear producing countries like China and other countries in Southeast Asia.
4.3.3 Seafood
the world’s largest shrimp market, each year importing over 400,000 tons of shrimp of several varieties (Vietnam Trade Information Center, 2000). However, Vietnam only exported 11,528 tons of shrimp into the EU in 1997 and 12,995 tons in 1998, only accounting for roughly 5 percent of the EU’s total imports from developing countries (around 60 percent of shrimp imports into the EU is from developing countries).
In reality, Vietnam's seafood exports have had a bright spot by recent approval of the Veterinary Steering Committee of the European Union to place 18 Vietnamese aqua-product exporters in Group 1. This includes those countries authorized to directly export unlimited volumes of their products to the EU and whose products will be checked only once. This provides an ample opportunity for Vietnam's seafood exporters since this large market always imports stable quantities of seafood at a high price. Furthermore, entering Group 1 will facilitate their exports to the US and Japan who also agree with the technical requirements of the EU.
However, the most important thing is that the competitiveness of Vietnamese seafood is not so high compared with products from other countries to the EU like Thailand, India, Bangladesh, and Indonesia. Moreover, 18 businesses that have been permitted to export seafood directly into the EU accounted for only 32 percent of Vietnam’s total seafood export to the EU in the first 10 months of 1999, of which exports of shrimp only accounted for 20 percent. Therefore, the ability to boost this export to the EU market will depend much on Vietnam’s improvements of its products and limiting the internal competition among domestic businesses.
In general, the EU market is quite a potential for Vietnamese products; however, there also exist difficulties regarding the competitiveness of the export products.
4.4 US market and effects of MFN status
biggest market to which any developing country wishes to promote its exports. It is estimated that the US market consumes a total import value of over US$1,200 billion every year. The US currently is among the biggest importers of countries in Asia, bringing around ten billion dollars of export values to ASEAN countries like Malaysia, Thailand and Indonesia, and around 20 billion dollars to Singapore or China in 1994 (Voon, 1998, p. 275). Meanwhile, Vietnam’s export earnings from the US market reached only US$468 million in 1998.
In reality, Vietnamese access to the American market is limited because of no MFN status, which is reflected in the modest 6.5 per cent of Vietnam's exports to American markets in 1998, up from 4 per cent in 1996. The general tariff rates that the United States imposes average 35 percent compared with 4.9 percent for the MFN rate. However, surprisingly, Vietnam’s exports to the US market have increased rapidly over recent years (after the lifting of the US’s embargo on Vietnam in 1994). It grew at around 178 percent in the 1995-1998 period, even higher than the growth of exports from the US to Vietnam. Hence, when MFN status is given, the trend will be accelerated strongly. The WB estimates that Vietnam's export earnings will increase by US$800 million in the first year of MFN alone.
MFN status requires the signing of the Vietnam-American Trade Agreement, which has been done recently on 13 July 2000. The agreement is to be implemented right after the approval of the US’s Congress, which is hopefully to be done next year. By then, exports to the US should increase significantly, particularly in the garments and footwear industries; rice, coffee, coal and oil exports are likely to increase as well (American Chamber of Commerce in Vietnam, 2000). The American market share is projected to increase to 23 percent in 2010.
below levels of those to Europe and Japan. “Since neither Japan nor Europe applies discriminatory tariff rates to products from Vietnam, Vietnamese exports to the US should approach the levels in Japan and Europe soon after MFN status is granted” (Taylor & Brasher, 1996).
Table 4.3: Vietnam’s exports to the US for major commodities (US$ million)
Description US 1996 EU-12* 1995
Japan 1996
MFN tariff
Non-MFN tariff
Vietnam total 310.127 1,408.679 2,288.502
Fish and seafood 29.159 28.106 390.080 0% 0%
Spices, coffee and tea 123.068 257.288 37.554 0% 0%
Mineral fuel, oil etc. 73.999 21.490 786.316 -
-Luggage & leather prod 0.608 83.005 70.694 17.0% 65%
Knit apparel 3.285 37.644 173.153 20.7% 45%
Woven apparel 20.962 290.890 389.999 8.5% 90%
Footwear 32.631 459.520 49.444 20.0% 35%
Ceramic products 0.764 31.733 5.257 Big difference
Furniture and bedding 0.300 25.043 69.465 Big difference
Total 284.776 1,234.719 1,971.961
% of all imports 91.8% 87.6% 86.2
Source: Global Trade Information Services, Inc.
* EU-12 does not include Austria, Finland and Sweden.
4.4.1 Garments - a strong growth to be expected